CONTOUR ·PLANS
BY COMPUTER
CONTOUR
PLA NS
BY
COMPUTER
WALTER C. BOUGHTON
Lincoln P'apers in Water Resources
No.6 February 1969
A Research Publication of the New Zealanq. Agricultural Engineering
Institute, Lincoln College, Canterbury, New Zealand
FO:RWORD
Lincoln College, the College of Agriculture of the University of Canterbury, sponsors an active research and teaching programme in hydrology~ soil conservation and water resources development. The purpose of these Papers is to communicate research results and new developments in these fields as rapidly as possible, and particularly to report the results of projects undertaken in conjunction by the ~epartment
of Agricultural Engineering and the New Zealand Agric-ultural Engineering Institute. From time to time the opportunity will be taken to publish material originating elsewhere in New Zealand with which the College is associated and which could not otherwise be made available.
The Lincoln Papers in Water Resources are
CONTENTS
Page
Foreword v
Abstract 1
Introduction
3
Method of Contouring
3
Contouring Grid Surveys
5
The Computer
8
The Programme
8
Applications 11
Future Development 12
ABSTRACT
OF
PAPER
A method of plotting and contouring grid surveys using a digital computer is described. Contour
positions in each square element of a grij survey are determined by linear interpolation between the sides of the square. The resultant shape of ground surface is curvilinear, equivalent to a relaxation net between the sides which connect the four corner levels. Application of the method to surveys for
flood irrigation design and other purposes Jc described, and a copy of the computer programme is given in
the Appendix.
1 <1· Introduction
New Zealand is generally well endowed with water, but there are many areas where rainfall is insufficient to meet full
summer demands and where irrigation is necessary to achieve full agricultural development. Irrigation is already well developed in Otago and Canterbury and is increasing in other areas.
Although the cost of investigation and design is small compared to the cost of construction of irrigation works, it is the most important stage of the work. Contour plans of the area to be irrigated are essential for the design of irrigation lay-outs. Plans for the design of spray irrigation systems are usually prepared with contour intervals of
5
feet1 sometimes10 feet in very steep country. Surface irrigation design1 on
the other hand, requires more accurate information of the ground surface and plans with contour intervals of
3
inches,6
inches, or 1 foot are usually prepared,At present, flood irrigation design in New Zealand accent-uates uniformity of the final layout with the consequence that large quantities of earthworks are often involved in construction, The reason for this is that uniformity of layout is best suited for the automatic operation which has developed in New iealand. The result is that there is considerable scope for improvement of designs to lessen the construction costs, as much as will be permitted by automatically operated systems.
In addition to the scope existing for the lowering of costs together with possible improvements in investigation and design, there is a need for faster and more efficient survey methods because of the shortage of trained staff to do the work. The shortage of labour in New Zealand is most evident in the pro-fessional ranks and sub-propro-fessional assistants, There is scope for speeding up much of the routine work, such as surveys,
involved in irrigation works in order to increase the amount of work which can be undertaken by the people available.
The computer program described in this report is directed towards reduction of the, labour involved in the preparation of survey plans, particularly fo~ irrigation design.
2. Method of Contouring
Clark (ref. 1) divides methods of contouring into two classes - direct and indirect.
Direct methods comprise those in which the contours to be plotted are actually traced out in the field by the location
and marking of a series of points on each. These points are then surveyed and plotted and the appropriate contours are drawn through them.
Indirect methods are those in which the points, located as regards position and elevationl are not necessarily situated on the contours to be shown but serve, on being plotteds as a basis for the interpolation of the required contours. This system is used in a wide range of surveys and usually proves less labor-ious than the first.
In both methods, but particularly in the case of the latter~ the accuracy of the resulting plan will greatly depend upon the number and disposition of the selected points. Direct contouring has the merit of superior accuracy and is suitable for the close contouring of small areas where considerable pre-cision is required. However this method is slow and is rarely adopted on large surveys,
With indirect methods, the surveyed points may
be:-(a) set out on a grid pattern
(b) taken along straight lines which serve as cross sections
(c) taken on scattered spot heights which define high and low points, and change of grade.
The methods adopted for preparation of irrigation plans differ among authorities, depending on the type of work, the terrain involved, and the established practice of the authority concerned •. Staff of the New Zealand Agricultural Engineering Institute and the Department of Agriculture officers at Winchmore Irrigation Research Station use grid surveys with levels taken at one chain intervals to produce contour plans for flood
irrigation designs. Ministry of Works officers preparing similar plans for the same purpose use a direct survey method of locating contours in the field and surveying points along the contour
locations,
Plotting and contouring of grid surveys by hand can be
tedious, particularly where small contour intervals are required. It seems clear that much of the use of direct methods of survey-ing stems from the labour involved in the plottsurvey-ing and contoursurvey-ing of grid surveys.
Grid surveys have two advantages over other methods used for flood irrigation work. First, the systematic nature of the
survey is adaptable to automatic plotting and contouring by
computers. Secondly, new methods of flood irrigation design such
as the Plane Method1 Profile Method, and Contour-Ad~ustment
Method (see Schwab et alt ref. 2) are based on grid surveys, and it seems probable that future developments in irrigation design will follow this trend.
As a first step towards utilizing these advantages, a computer program has been prepared to plot and contour grid surveys. The method incorporated in the program is described in this report and a copy of the computer program is given in the Appendix.
3.
Contouring Grid SurveysTo find the locations of contours on a grid survey by manual means1 the points where contours cross the grid lines
are first estimated by linear interpolation between the grid levels.
Fig.1(a) shows a small segment of a grid survey and 1(b) shows a cross-section along one line of levels. The ground surface is assumed to consist of straight lines between the
grid levels. Locations of contours between the levels are deter-mined by linear interpolation.
By this interpolation, the locations where contours cross the grid lines are marked as shown in Fig.1(c). The contour lines are then drawn in to join the points of same level as shown in Fig.1(d).
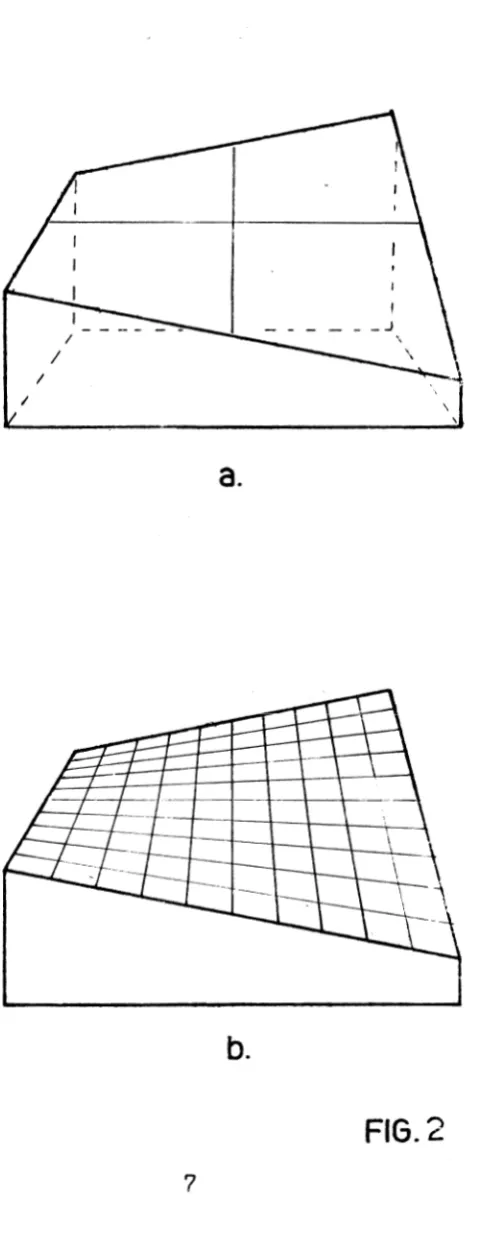
In order to have this form of contouring undertaken by computer, it is necessary to be specific about how the contours are to be drawn to join points of the same level, The principle of linear interpolation can be extended to the whole surface area within a grid square as shown in Fig.2.
Fig,2(a) shows a square unit from a grid survey. The mid-point along one side of the unit is joined to the mid-mid-point of the opposite side by a straight line, A straight line also joins the mid-points of the sides in the other direction, If additional points on the sides are joined, the result is a curvilinear surface formed of only straight lines as shown in Fig.2(b). This surface is the relaxation net which would be formed between the straight lines which join the four corners of the square and form the sides.
This definition of the shape of the surface would be too complex to use for the location of contours by hand methods of plotting and contouring but is both suitable and necessary for contouring by computer.
a.
-1·5
'
0 · 5
-I
16
- - - 4
~=-
--1--3
-2
--+-1
section
AA
b.
I
~
I
-2·5
3 · 5
--1·5
- - + - - -
0·5-1 , I
d.
I \
a.
b.
FIG.
2
4. The Computer
The digital computer at Lincoln College is an
I,B,M,
1130 model with an 8K core storage and one exchangeable magnetic disk backing storeo The machine is equipped with a card reader/punch and an on-line printero There was no plotter available at the time of preparation of the program so use was made of the on-line printer for plotting of the contour planoThe printer has a printing speed of 80 lines per minute with 120 characters across the page. The characters are spaced 10 per inch across the page and line spacing may be selected at either
6
or 8 lines per incho The 8 lines per inch spacing was adopted for the program in order to get the most definition of the con~tour lineso
5o The Program
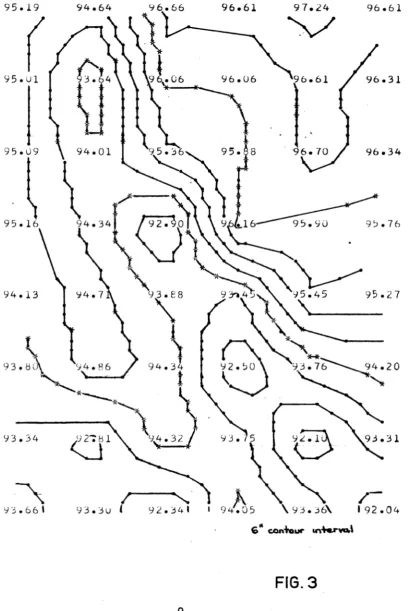
The program has been arranged to print the grid levels on a 1 i·nch x 1 inch pattern and to mark the locations of contour lines between the levels by printing a series of pointso Fig.3 illustrates the result. Contour lines are formed by joining together the sequences of printed pointso This is normally done when the computer printout is traced or photographed to produce the final plan.
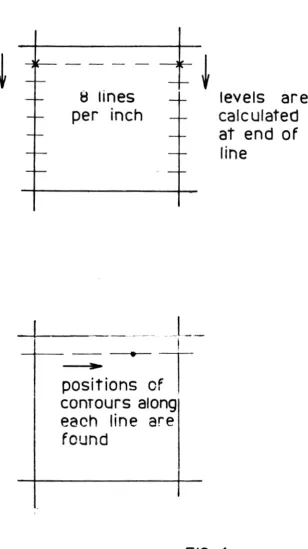
The printer output is set out at 8 lines per inch down the page and 10 characters per inch across the pageo The program is arranged to work down the page one row at a time with 8 rows per grid square as shown in Figo4a Levels at the side of the square are calculated for each row as shown in Fig.4(a)o The position of any contour along the row is then determined and marked by the printing of an asterick or point.
After finishing with the first row in the square shown in Fig.4(b) the program moves to the same row in the next square to the right. All calculations and printing on this row are com~
pleted across the page before the printer advances one row and calculations proceed to the next row1 starting again with the
square at the left hand side.
The width of survey which can be plotted on the printer is limited to 10 grids of 1 inch width1 i.eo a 10 chain strip if the
levels are taken on a 1 chain grid. Surveys wider than 10 chains are handled in strips and joined together after printingo When a survey is broken into strips for plotting on the computer, the last column of levels from the first strip is used as the first column in the next strip to provide a joining linko
95.19 94.64 96.61 97.24 96.61
(
'V
'-J5.ul '-)6.06 96.61
96.34
95.16 9~.76
94.13
'-)3.34
FIG. 3
---§-+
8 lines
per inch
- - - 4 - - - · - - - · - - · - - - ___
j __ _
I
pos~ion~
o ; r
conrours along
each line are
found
levels are
calculated
at
end of
line
FIG. 4
Each row of levels is punched as data onto cards with a maximum of 11 levels on any single card to give a 10 chain strip. The contour interval required is specified on a data card each time the program is runo This gives flexibility in use of the program because different surveys can be plotted with different contour intervals. It has also proved useful in plotting a survey1 first with a large contour interval to show broad
topo-graphic form and then with a smaller interval to give the fine detail. Once the data hRs been punched onto cards1 it is a
simple matter to try different contour intervals and select the most suitable.
The program has been arranged to print astericks instead of points for every 4th contour line. The original purpose of this was based on the use of the program for plotting
3
inch contours for flood irrigation design. The different symbol gives a distinctive appearance to the even foot contours and makes interpretation easier when contours are close togetheroThe accuracy of plotting by the printer is very high. Individual points vary from the 1 inch x 1 inch grid by less than one~hundredth of an inch. The accuracy is equal to that obtained by a good draughtsmano
A copy of the program is given in the Appendix.
6.
ApplicationsThe program is suitable for plotting and contouring all grid surveys. However1 i t is most suitable for the specific
application for which it was intended i.e. grid surveys of surface irrigation areas. The program has now been tested and used on a number of areas surveyed for surface irrigation design1
both by staff of Lincoln College9 by Agriculture Department
staff from Winchmore Irrigation Research Station~ and by Ministry of Works staff. The results from a variety of applications have proven successful.
There seems to be opportunity for extending the use of grid surveys to the design of drainage of flat areas1 now that the
labour of contouring and plotting of plans is removed. Surface drainage design often requires survey information of an accuracy approaching the requirements for surface irrigation design. In such cases, there is now opportunity for surveying the area on a grid pattern and using the computer to plot the survey with whatever contour interval is desired.
One research application that has already made use of the program is an investigation into the correlation of grass grub populations with micro-topography of the ground. In order to obtain fine detail of the ground contours, the research area was surveyed on a grid pattern with levels taken at half-chain intervals. The computer program was used to produce two contour plans of the area ~ first with one foot contours to show broad topographic form and then with three inch contours to show the smaller detail.
The program has also been used for an application completely different to the contouring of plans of the ground surface. At Winchmore Irrigation Research Station~ an experiment has been set up to record the water distribution patterns of irrigation sprinklers under varying wind conditions. Depths of water applied are measured around the sprinkler in cans set out on a grid pattern. It has been possible to save considerable effort in the plotting and contouring of the distribution patterns by using the contour plotting program.
7.
Future DevelopmentsThe utility of the plotting program can be increased by using the computer to eliminate most of the tedious reduction of survey data which precedes the plotting. At present, the program uses reduced levels already set out on data cards in their
correct position for plotting.
The reduction of survey information from the field readings to the reduced levels associated with grid coordinates is a
routine matter. An improvement to the progr~m which is now being undertaken is to arrange for the computer to carry out the reduc-tion of levels as a preliminary step before plotting and contour-ing. The field readings are punched directly onto cards and the completed tabulation of rises~ falls, and reduced levels are printed out by the computer. The reduced levels are then plotted and contoured by the plotting program as described above.
Use of the printer to plot a series of points along the contour positions has served a purpose in demonstrating that contouring by computer is feasible. However, the most pressing need at present is to adapt the program for use with an on-line plotter to produce continuous contour lines. A plotter is expected at the University of Canterbury in the near future and the program will be adapted for its use as soon as possible.
One aspect of the logic of the program that has become apparent during use is concerned with persistency of valleys and ridges as ~ alternative to complete linear interpolation.
Fig.3 illustrates a small portion of an actual survey which has been contoured by strict linear interpolation. The low spots from RL 92.04 at the bottom right corner, diagonally across the page do not connect because of the method of fixing the ground surface between the points as illustrated in Fig.2.
However, if further information had been recorded, say by taking levels at ~ chains instead of the 1 chain grid, a low value could occur between RL 92.04 and RL 92.10, and also between RL 92.10 and RL q2.50 and the low points could have been joined together to form a continuous gully. Where surveys are manually plotted and contoured by the surveyor, it is possible to make use of unrecorded information of the locations of such gullies, which the surveyor carries by memory, thereby eliminating the need for very small grid intervals in the survey.
To enable the computer to duplicate such results, i t seems necessary to either provide more information by way of smaller grid intervals or to provide some systematic way of recording the additional information now collected intuitively by surveyors. There is little point in pursuing the first alternative as the need for such additional information would negate the advantage gained by automatic plotting. There seems more scope for improve-ment by closer study of the intuitive aspects of current survey methods.
Clark,
D.
Schwab, G.O., Barnes,
K.K.
REFERENCES
Plane and Geodetic Surveying, Vol.1, Plane Surveying, Constable and Co.
Frevert,
R.K.,
Edminster, T.W.~ andSoil and Water Conservation Engineering, Wiley, 1966.
APPENDIX
Computer Program
DIMENSION
SPOTA(j1),SPOTB(11),M(5,20)~SPOT(11,50)1002 FORMAT(11F6.2)
1001
FORMAT(2!3)
1003
FORMAT(1X~F8.2,10(2X,F8.2))1004 FORMAT('
11118x,v v)
1005 FORMAT(5A2)
1006
FORMAT(F4.2)
1007 FORMAT(1X
1F5.2)
READ(2~1005)((M(I1K),I=1,5),K=1,20)
READ(2
11006)CONTR
WRITE(3
11007)CONTR
READ(2,1001)NROWS,NCOLS
COEF=1o0/(4.0*CONTR)
DO 500 K=1
9NROWS
READ(2
91002)(SPOT(I,K),I=1
9NCOLS)
500 CONTINUE
DO 501 K=1
1NCOLS
SPOTA(K)=SPOT(K,1)*COEF
501
CONTINUE
WRITE(3,1003)(SPOT(K,1),K=1,NCOLS)
WRITE(3
91004)
DO 450 NUT=2,NROWS
DO 502 K=1,NCOLS
SPOTB(K)=SPOT(K,NUT)*COEF
502 CONTINUE
DO 452 N=1
17
EN=N
DO 451 JJ=2
9NCOLS
J=JJ~1
AN=SPOTA(J)+(SPOTB(J)-SPOTA(J))*EN/8.0
BN=SPOTA(JJ)+(SPOTB(JJ)-SPOTA(JJ))*EN/8.0
CN=AN~BNIF(ABS(CN)-2.5)170,451,451
170 IF(CN)150,451,152
150 NAN=4.0*AN+1.0
NNA=NAN
ANA=NAN
DIFF=(BN~AN)/2.5
AN=4.0*AN~ANA+DIFF/2.0
BN=4.0 *BN
~ANAKY=O
IF(AN)153,154
9154
154 AN=AN-1.0
153 AN=AN+DIFF
KY=KY+1
IF(KY~
0)155,155,451
155 IF(AN)153,156,156
156 1=1
NAN=NAN/4
NAN=NAN*4
IF(NAN-NNA)300
1301,300
300 K=KY
GO TO 302
301
K=KY+10
302 NNA=NNA+1
NAN=NNA
161
GO T0(201,202,203,204,205,206,207,208,209,210),J
152 NBM=4.0*BN+1.0
NNB=NBM
BNB=NBM
DIFF=(AN~BN)/2.5 BN=4.0*BN~BNB+DIFF/2.0AN=4.0*AN-BNB
KY=10
IF(BN)157,158,158
158
BN=BN~1.0157 BN=BN+DIFF
KY=KY~1
IF(KY)451,451,159
159
IF(BN)157,160,160
160 1=2
NBM=NBM/4
NBM=NBM*4
IF(NNB-NBM)303,304,303
303 K=KY
GO TO 305
304 K=KY+10
305 NNB=NNB+1
NBM=NNB
GO TO 161
201
WRITE(3,1101)(M(I,K),I=1,5)
GO TO (154,158),1
202 WRITE(3,1102)(M(I,K),I=1,5)
GO TO (154,158),1
203 WRITE(3,1103)(M(I,K),I=1,5)
GO TO (154,158),1
204 WRITE(3,1104)(M(I,K),I=1,5)
GO T0(154,158),1
205
WRITE(3,1105)(M(I,K~I=1,5)GO T0(154,158),1
206 WRITE(3,1106)(M(I,K),I=1,5)
GO T0(154,158),1
207 WRITE(3,1107)(M(I,K),I=1,5)
GO T0(154,158),1
208 WRITE(3,1108)(M(I,K),I=1,5)
GO T0(154,158),1
209 WRITE(3,11oqXMCI,K),I=1,5)
GO T0(154,158),L
2~0 WRITE(3~110)(M(I,K),I=1,5)
GO T0(154,158),L
1101
FORMAT('+', 6X,5A2)
1102 FORMAT(v+',16X,5A2)
1103 FORMAT('+',26X,5A2)
1104 FORMAT('+',36X,5A2)
1105 FORMAT('+',46X,5A2)
1106 FORMAT('+',56X,5A2)
1107 FORMAT('+',66X,5A2)
1108 FORMAT('+',76X,5A2)
1109 FORMAT('+',86X,5A2)
1110 FORMAT('+',96X,5A2)
451
CONTINUE
IF(N~7)1,452,452
1 WRITE
(3,1 004)
452
CONTINUE
WRITE(3,1003)(SPOT(J,NUT),J=1,NCOLS)
WRITE(3,1004)
DO 453 J=1,NCOLS
453
SPOTA(J)=SPOTB(J)
450 CONTINUE
CALL EXIT
END
LINCOLN PAPERS IN WATER -RESOURCES
No.
1:No. 2:
No.
3:
No.
4:
No.
5:
No.
6:
.