Open Access
Methodology article
Similarity-based gene detection: using COGs to find
evolutionarily-conserved ORFs
Bradford C Powell
1and Clyde A Hutchison III*
1,2,3Address: 1Curriculum in Genetics and Molecular Biology, University of North Carolina at Chapel Hill, Chapel Hill, North Carolina, USA, 2Department of Microbiology and Immunology, University of North Carolina at Chapel Hill, Chapel Hill, North Carolina, USA and 3J. Craig
Venter Institute, Rockville, Maryland, USA
Email: Bradford C Powell - [email protected]; Clyde A Hutchison* - [email protected] * Corresponding author
Abstract
Background: Experimental verification of gene products has not kept pace with the rapid growth
of microbial sequence information. However, existing annotations of gene locations contain sufficient information to screen for probable errors. Furthermore, comparisons among genomes become more informative as more genomes are examined. We studied all open reading frames (ORFs) of at least 30 codons from the genomes of 27 sequenced bacterial strains. We grouped the potential peptide sequences encoded from the ORFs by forming Clusters of Orthologous Groups (COGs). We used this grouping in order to find homologous relationships that would not be distinguishable from noise when using simple BLAST searches. Although COG analysis was initially developed to group annotated genes, we applied it to the task of grouping anonymous DNA sequences that may encode proteins.
Results: "Mixed COGs" of ORFs (clusters in which some sequences correspond to annotated
genes and some do not) are attractive targets when seeking errors of gene predicion. Examination of mixed COGs reveals some situations in which genes appear to have been missed in current annotations and a smaller number of regions that appear to have been annotated as gene loci erroneously. This technique can also be used to detect potential pseudogenes or sequencing errors. Our method uses an adjustable parameter for degree of conservation among the studied genomes (stringency). We detail results for one level of stringency at which we found 83 potential genes which had not previously been identified, 60 potential pseudogenes, and 7 sequences with existing gene annotations that are probably incorrect.
Conclusion: Systematic study of sequence conservation offers a way to improve existing
annotations by identifying potentially homologous regions where the annotation of the presence or absence of a gene is inconsistent among genomes.
Background
The rapidly growing amount of genomic sequence infor-mation necessitates tools for its annotation. Although pre-dicting bacterial genes is in many ways simpler than
predicting eukaryotic genes, it is clear that there remains room for improvement in the bacterial case. Several groups have undertaken efforts to re-annotate specific genomes [1-3], often finding a small but significant
Published: 19 January 2006
BMC Bioinformatics 2006, 7:31 doi:10.1186/1471-2105-7-31
Received: 03 August 2005 Accepted: 19 January 2006 This article is available from: http://www.biomedcentral.com/1471-2105/7/31
© 2006 Powell and Hutchison; licensee BioMed Central Ltd.
This is an Open Access article distributed under the terms of the Creative Commons Attribution License (http://creativecommons.org/licenses/by/2.0), which permits unrestricted use, distribution, and reproduction in any medium, provided the original work is properly cited.
number of errors in existing annotation of gene loci. The presence of these errors has motivated the effort of some groups to systematically revise the gene annotations in public databases as a continuous process [4,5].
Because technology for genome sequencing is much more mature than proteomic analysis, only a small fraction of annotated bacterial gene products have been detected as protein; most have been annotated using only computa-tional methods. Although methods for detecting and identifying all proteins in a cell are being developed [3,6,7] and incorporated into annotations of newly-sequenced genomes [8], these techniques are currently limited by the ability to express all of the polypeptides in an organism and separate them into fractions with low enough complexity for analysis. It is still useful to refine our computational predictions so that we can make tar-geted searches for potential proteins.
Accuracy of gene identification is particularly important in studies of the gene content of a genome as a whole. Studies of phyletic patterns of gene presence [9], the extent of horizontal gene transfer among genomes, the entire set of protein structures encoded by a genome [10], and the components of a "minimal genome" [11,12] are all predicated on an accurate catalog of the genes within an organism. Because these studies involve comparing the presence or absence of genes among several organisms, it is particularly important that all of the genes present be identified. Insights in these areas of study could impact our understanding of bacterial evolution physiology and pathogenicity. As an example, in the initial report of the Mycoplasma mobile genome sequence the correlation of presence or absence of certain genes with a presence or absence of a specific phenotypic characteristic (motility) among nine species was used to suggest genes which might confer that phenotype [8].
Methods for predicting protein-coding genes are often divided into intrinsic and extrinsic classes [13,14]. Intrinsic methods only use evidence from within the primary sequence of a genome. This evidence may include i) the presence of a relatively long frame uninterrupted by a stop codon, ii) the statistical pattern of polynucleotide stretches that match the typical frequencies present in other coding regions of the organism and iii) the existence of appropriate non-coding control elements. It may be difficult to identify some small genes using the first two types of evidence; small genes can be difficult to distin-guish from open reading frames that occur by chance, and in such short regions, sequence characteristics may be affected stochastically. Gene finding methods which use sequence characteristics or control elements often need to be tuned for the specific organism studied, and in many
cases several statistical models of coding regions may need to be developed in a single organism [15].
Extrinsic methods use information from comparisons of genomes. These analyses originally used simple pairwise comparisons among potential protein-coding regions. Harrison et al. [16] examined ORFs of 15 or more codons in 65 microbial genome sequences, using BLAST E-value of less than 10-4 to indicate similarity suggestive of
con-served function. Other searches use sequence alignments of a protein family as a query against all possible transla-tions of the genome of interest. This alignment may be specified beforehand (e.g. using a Pfam protein family) or developed as part of the search as by PSI-BLAST [17]. Pair hidden Markov models use a pairwise sequence align-ment coupled to a hidden Markov model to more pre-cisely determine the amino termini of protein-coding genes [18]. Programs have been developed that use pair-wise alignment of syntenic regions to predict gene struc-ture in eukaryotes [19]. The ratio of synonymous to nonsynonymous substitutions between pairs of putative genes can be used to examine whether there is selection for protein-coding function, but this requires sequences from closely related organisms [20]. The majority of bac-terial genome annotations have used intrinsic methods at least initially to predict the presence of genes. Extrinsic gene prediction methods serve as a useful complement to intrinsic methods because independent information is used to make the same prediction.
In this study we describe a systematic extension to exam-ining similarity shared among several genomes using a modification of the analysis of Clusters of Orthologous Groups (COGs). COGs were developed to cluster anno-tated genes into functionally related groups in order to facilitate the transfer of functional annotations among organisms [21]. Here we use COGs to cluster open reading frames as a means of recognizing genes. An advantage of the COG analysis is that no explicit threshold for sequence similarity is used; genes that are missed in pair-wise comparisons may be detected. Because the focus is on annotation of gene location rather than gene function, we are not concerned with finding genes that are strictly orthologous. Evidence of homology to another gene is sufficient to imply that a region is a gene, and we make no effort to avoid the joining of COGs which may occur due to a gene fusion [22]. The idea of stringency [23] of COGs expands upon the initial COG definition by requiring an adjustable of connectedness for grouping genes. As the number of studied organisms increases, the stringency can further filter some similarities which may have occurred by chance. ORFs that do not correspond to annotated genes but that nonetheless have conserved sequences present in several genomes are likely to be protein-coding genes that have been missed by current annotations.
A cluster of ORFs can be examined with regards to its mul-tiple sequence alignment, the network of similarities among the ORFs, and the respective genomic contexts of the ORFs in the cluster. These characteristics of ORF clus-ters can be used to screen existing gene predictions for potential errors. The extrinsic nature of the use of COGs of ORFs is complementary to the intrinsic methods that have been used in producing the majority of gene loci annota-tions. Because our strategy has different strengths and weaknesses from the intrinsic methods, it may be expected to pick up some genes that other methods have missed.
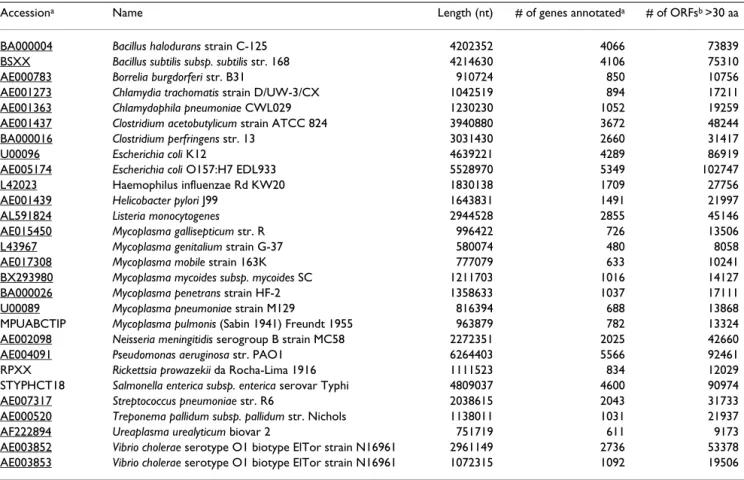
In this study we examined open reading frames from the complete genome sequences of 27 bacteria (Table 1). We selected these genome sequences for the following rea-sons. M. genitalium and M. pneumoniae are model systems for defining the minimal cellular genome. Consequently, their proteins became the focus of research at the Berkeley Structural Genomics Center [10,24]. Other members of the class Mollicutes provide a closely related set which may help identify genes specific to this class. The protein products of M. pneumoniae and M. mobile have been recently studied using high-throughput identification
using multidimensional chromatography and mass spec-trometry [3,8]. We included other small-genome parasitic bacteria to study the extent to which gene content has con-vergently evolved among this group. We also included a more diverse selection of bacterial genome sequences from major phylogenetic groups to see how robust our strategy would be when examining distantly related organisms.
We wanted to detect fragments of genes and genes which use start codons other than ATG, so we used a very general definition of an ORF: any frame of length at least 30 codons (90nucleotides) uninterrupted by stop codons. The software developed as part of this study, SPROCKET, can be used to detect probable errors in existing gene annotations.
Results
Gene discovery using conservation of potential peptide sequence
Extrinsic gene-finding methods are based on the duality that, given sufficient evolutionary distance, conserved sequences are likely to be functional and that functional sequences are likely to be conserved. The conserved
Table 1: Genomes included in this study
Accessiona Name Length (nt) # of genes annotateda # of ORFsb >30 aa
BA000004 Bacillus halodurans strain C-125 4202352 4066 73839
BSXX Bacillus subtilis subsp. subtilis str. 168 4214630 4106 75310
AE000783 Borrelia burgdorferi str. B31 910724 850 10756
AE001273 Chlamydia trachomatis strain D/UW-3/CX 1042519 894 17211
AE001363 Chlamydophila pneumoniae CWL029 1230230 1052 19259
AE001437 Clostridium acetobutylicum strain ATCC 824 3940880 3672 48244
BA000016 Clostridium perfringens str. 13 3031430 2660 31417
U00096 Escherichia coli K12 4639221 4289 86919
AE005174 Escherichia coli O157:H7 EDL933 5528970 5349 102747
L42023 Haemophilus influenzae Rd KW20 1830138 1709 27756
AE001439 Helicobacter pylori J99 1643831 1491 21997
AL591824 Listeria monocytogenes 2944528 2855 45146
AE015450 Mycoplasma gallisepticum str. R 996422 726 13506
L43967 Mycoplasma genitalium strain G-37 580074 480 8058
AE017308 Mycoplasma mobile strain 163K 777079 633 10241
BX293980 Mycoplasma mycoides subsp. mycoides SC 1211703 1016 14127
BA000026 Mycoplasma penetrans strain HF-2 1358633 1037 17111
U00089 Mycoplasma pneumoniae strain M129 816394 688 13868
MPUABCTIP Mycoplasma pulmonis (Sabin 1941) Freundt 1955 963879 782 13324
AE002098 Neisseria meningitidis serogroup B strain MC58 2272351 2025 42660
AE004091 Pseudomonas aeruginosa str. PAO1 6264403 5566 92461
RPXX Rickettsia prowazekii da Rocha-Lima 1916 1111523 834 12029
STYPHCT18 Salmonella enterica subsp. enterica serovar Typhi 4809037 4600 90974
AE007317 Streptococcus pneumoniae str. R6 2038615 2043 31733
AE000520 Treponema pallidum subsp. pallidum str. Nichols 1138011 1031 21937
AF222894 Ureaplasma urealyticum biovar 2 751719 611 9173
AE003852 Vibrio cholerae serotype O1 biotype ElTor strain N16961 2961149 2736 53378
AE003853 Vibrio cholerae serotype O1 biotype ElTor strain N16961 1072315 1092 19506
regions may represent control elements or may encode functional RNA molecules or proteins. We examined the extent to which multi-species sequence conservation could be used to detect the presence of protein-coding
genes. We considered two systems for classifying ORFs as genes or not-genes. The first system was based solely on existence of a COG containing the ORF. If we determined that an ORF was a member of a COG then we classified it
Gene prediction based on sequence conservation
Figure 1
Gene prediction based on sequence conservation. (A) and (B) show receiver-operator characteristic curves
summariz-ing the sensitivity and specificity of gene prediction based on COG membership when compared to the current gene annota-tions. In (A), an ORF is classified as a gene if it is conserved in a COG at a certain stringency; for (B), the ORF must be in a COG that contains at least one annotated gene from another species. Curves are produced by examining COGs at different stringencies. At stringency 2, tests are very sensitive but not very specific (points at upper right of each panel). As stringency increases, specificity increases and sensitivity decreases (indicated by arrow). For clarity, full ROC curves are shown for only seven of the organisms studied, and for the pooled result among all of the organisms studied. The plotting symbols and colors used in (A) and (B) are next to the organism names in (C). (C) shows the areas under the curves in (A) black bars and (B) grey bars. The ROC curve of a perfect test would enclose an area of 1, for a completely arbitrary test the area would be 0.5. The organisms in (C) are ordered by the area under the ROC curve in (B).
0.0 0.2 0.4 0.6 0.8 1.0 0.0 0.2 0.4 0.6 0.8 1.0
1 Specificity (False positive rate)
Sensitivity (True positive rate)
A Increasing stringency 0.0 0.2 0.4 0.6 0.8 1.0 0.0 0.2 0.4 0.6 0.8 1.0
1 Specificity (False positive rate)
Sensitivity (True positive rate)
B
Increasing stringency
Area under ROC curve
0.5 0.6 0.7 0.8 0.9 1.0
Clostridium acetobutylicum Mycoplasma mycoides Escherichia coli O157:H7 Treponema pallidum Mycoplasma penetrans Vibrio cholerae Bacillus halodurans Bacillus subtilis Chlamydophila pneumoniae Pseudomonas aeruginosa Helicobacter pylori Streptococcus pneumoniae pooled species Mycoplasma pulmonis Neisseria meningitidis Borrelia burgdorferi Clostridium perfringens Salmonella typhi Listeria monocytogenes Mycoplasma pneumoniae Mycoplasma gallisepticum Chlamydia trachomatis Ureaplasma parvum Escherichia coli K12 Mycoplasma mobile Rickettsia prowazekii Haemophilus influenzae Mycoplasma genitalium C
as a gene, otherwise we classified it as not being a gene. Our second classification system used existing gene anno-tations for all genomes except the one containing the ORF to be classified, reducing the number of false positives. In this system we classified an ORF as a gene if we found it in a COG containing at least one ORF from another genome that was annotated as a gene. In both systems the COG stringency controlled the extent of conservation required for classification. We compared these gene predictions to existing gene annotations using sensitivity/specificity analysis. Although there are errors in existing gene annotations (as discussed below) the current annotations represent the expert consensus. Sensitivity for a gene classification sys-tem is the number of correct gene predictions divided by the number of actual genes. The specificity is the number of true negative predictions divided by the total number of non-genes.
Sensitivity and specificity of gene predictions varied at dif-ferent stringency levels of the COGs used in classification. The accuracies of both classification systems are summa-rized in Figure 1. Receiver-operator characteristic (ROC) plots show the true positive rate (sensitivity) along the vertical axis against the false positive rate (1-specificity) along the horizontal axis. An ideal test (when compared
to an ideal "gold standard") would be represented by a point plotted in the upper-left corner (0,1). Figures 1A and 1B show the classifications based solely on COG membership and based on COG membership with an annotated gene from another organism, respectively. Each point plotted on this graph represents the sensitivity and specificity of classification at a given stringency. ROC curves are shown for a sample of seven of the genome sequences studied and for the pooled results for all of the genomes. The accuracy of tests for each genome sequence and pooled results for all of the genome sequences are summarized across COG stringencies by the area under the ROC plots (Figure 1C). The sensitivity and specificity values for all of the studied genomes were computed [see Additional file 1].
"Mixed" COGs
COGs formed from ORFs can also be used to mine exist-ing gene location annotation for potential errors. COGs in which there are some ORFs that correspond to annotated genes and other ORFs that do not correspond to anno-tated genes represent potential anomalies in existing annotations. The number of these mixed COGs at differ-ent stringencies is shown in Figure 2. Also shown in Figure 2 are the number of COGs at each stringency level which contain only ORFs which correspond to annotated genes ("all matches") or which contain no ORFs which corre-spond to annotated genes ("no matches"). The initial increase in numbers of COGs when moving from strin-gency two (single-linkage clusters) to three is the result of larger, weakly connected COGs splitting into several smaller COGs. As stringency increases beyond three, the number of COGs in each group decreases exponentially. The "all matches" and "mixed" classes have similar con-nectedness structures in that the numbers of COGs in these classes decay at similar rates. The number of COGs in the "no matches" class drops more rapidly because the less well-conserved or connected sets of ORFs that may not be conserved due to protein-coding function are not present at higher stringencies.
Screening existing gene predictions for errors
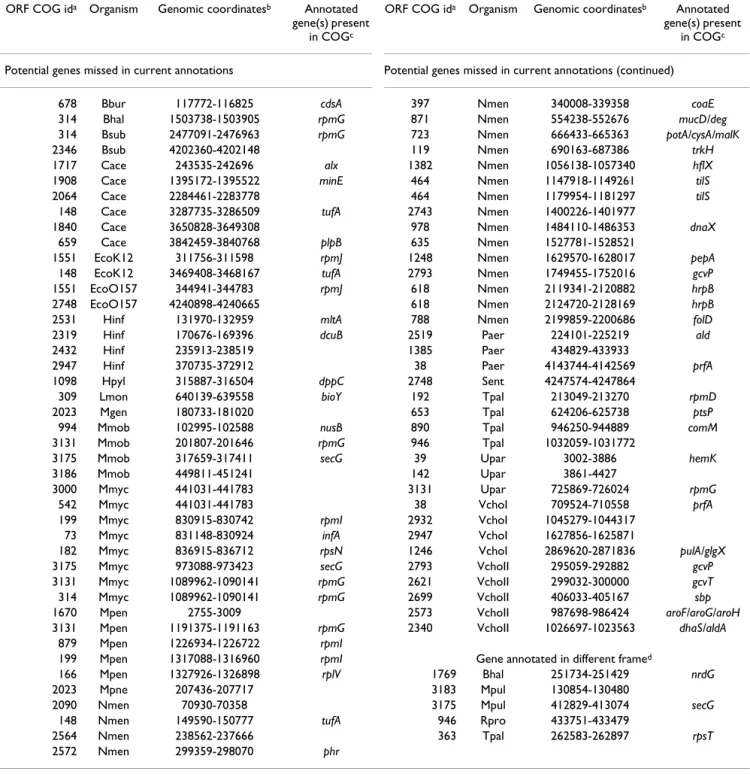
Mixed COGs are attractive targets when looking for errors in existing gene predictions. We examined the genomic context and peptide sequence alignments of the mixed COGs of stringency six to explain the inconsistency of gene annotation within these COGs. In COGs where the majority of ORFs correspond to annotated genes, the remaining ORFs are likely to represent missed genes or pseudogenes. At stringency six there are 147 mixed COGs in which the majority of ORFs correspond to annotated genes (Table 2). At this stringency every member of a COG is in a bidirectional best-hit relationship with at least six other ORFs in the COG. These COGs contain 143 ORFs that are not associated with annotated genes. Some of the
Presence of annotated genes in COGs of ORFs
Figure 2
Presence of annotated genes in COGs of ORFs. Open
reading frames (ORFs) of at least 90 nucleotides between stop codons were used to construct COGs at varying strin-gencies as described in the methods. COGs were divided into one of three groups: "All members match annotated genes" – contain only ORFs which correspond to annotated genes, "No members match annotated genes" – contain no ORFs which match annotated genes, or "Mixed" – contain some ORFs that correspond to annotated genes and some that do not. The numbers of ORFs in COGs of each of these classes are plotted along the y-axis with a logarithmic scale.
Stringency Number of COGs 2 4 6 8 10 12 14 16 18 20 22 24 26 1 1 0 100 1000 10000 All COGs
All members match annotated genes No members match annotated genes Some members match annotated genes Subgroups:
Table 2: ORFs in Majority-annotated mixed COGs of stringency 6 that may represent missed genes
ORF COG ida Organism Genomic coordinatesb Annotated
gene(s) present
in COGc
ORF COG ida Organism Genomic coordinatesb Annotated
gene(s) present
in COGc
Potential genes missed in current annotations Potential genes missed in current annotations (continued)
678 Bbur 117772-116825 cdsA 397 Nmen 340008-339358 coaE
314 Bhal 1503738-1503905 rpmG 871 Nmen 554238-552676 mucD/deg
314 Bsub 2477091-2476963 rpmG 723 Nmen 666433-665363 potA/cysA/malK
2346 Bsub 4202360-4202148 119 Nmen 690163-687386 trkH
1717 Cace 243535-242696 alx 1382 Nmen 1056138-1057340 hflX
1908 Cace 1395172-1395522 minE 464 Nmen 1147918-1149261 tilS
2064 Cace 2284461-2283778 464 Nmen 1179954-1181297 tilS
148 Cace 3287735-3286509 tufA 2743 Nmen 1400226-1401977
1840 Cace 3650828-3649308 978 Nmen 1484110-1486353 dnaX
659 Cace 3842459-3840768 plpB 635 Nmen 1527781-1528521
1551 EcoK12 311756-311598 rpmJ 1248 Nmen 1629570-1628017 pepA
148 EcoK12 3469408-3468167 tufA 2793 Nmen 1749455-1752016 gcvP
1551 EcoO157 344941-344783 rpmJ 618 Nmen 2119341-2120882 hrpB
2748 EcoO157 4240898-4240665 618 Nmen 2124720-2128169 hrpB
2531 Hinf 131970-132959 mltA 788 Nmen 2199859-2200686 folD
2319 Hinf 170676-169396 dcuB 2519 Paer 224101-225219 ald
2432 Hinf 235913-238519 1385 Paer 434829-433933
2947 Hinf 370735-372912 38 Paer 4143744-4142569 prfA
1098 Hpyl 315887-316504 dppC 2748 Sent 4247574-4247864
309 Lmon 640139-639558 bioY 192 Tpal 213049-213270 rpmD
2023 Mgen 180733-181020 653 Tpal 624206-625738 ptsP
994 Mmob 102995-102588 nusB 890 Tpal 946250-944889 comM
3131 Mmob 201807-201646 rpmG 946 Tpal 1032059-1031772
3175 Mmob 317659-317411 secG 39 Upar 3002-3886 hemK
3186 Mmob 449811-451241 142 Upar 3861-4427
3000 Mmyc 441031-441783 3131 Upar 725869-726024 rpmG
542 Mmyc 441031-441783 38 VchoI 709524-710558 prfA
199 Mmyc 830915-830742 rpmI 2932 VchoI 1045279-1044317
73 Mmyc 831148-830924 infA 2947 VchoI 1627856-1625871
182 Mmyc 836915-836712 rpsN 1246 VchoI 2869620-2871836 pulA/glgX
3175 Mmyc 973088-973423 secG 2793 VchoII 295059-292882 gcvP
3131 Mmyc 1089962-1090141 rpmG 2621 VchoII 299032-300000 gcvT
314 Mmyc 1089962-1090141 rpmG 2699 VchoII 406033-405167 sbp
1670 Mpen 2755-3009 2573 VchoII 987698-986424 aroF/aroG/aroH
3131 Mpen 1191375-1191163 rpmG 2340 VchoII 1026697-1023563 dhaS/aldA
879 Mpen 1226934-1226722 rpmI
199 Mpen 1317088-1316960 rpmI Gene annotated in different framed
166 Mpen 1327926-1326898 rplV 1769 Bhal 251734-251429 nrdG
2023 Mpne 207436-207717 3183 Mpul 130854-130480
2090 Nmen 70930-70358 3175 Mpul 412829-413074 secG
148 Nmen 149590-150777 tufA 946 Rpro 433751-433479
2564 Nmen 238562-237666 363 Tpal 262583-262897 rpsT
2572 Nmen 299359-298070 phr
aThe identifiers for COGs are local to this study. They do not correspond to numbers in the NCBI COG database.
bCoordinates in which the first number is greater than the second indicate that the ORF is on the minus strand.
cA named annotated putative ortholog in another organism or paralog within the organism to the ORF listed.
dThese COGs may indicate both that the ORF listed is a missed gene and that the annotated
COGs contained multiple ORFs that did not correspond to annotated genes and some ORFs were members of mul-tiple COGs.
The potential amino acid sequences of 83 of these ORFs contain regions that have substantial similarity to the
multiple-sequence alignment of the annotated genes that are also members of the COG (Table 2). We judge that these ORFs are likely to represent genes missed in current annotations. 5 of the 83 candidate genes involve instances where there were two ORFs with approximately equal
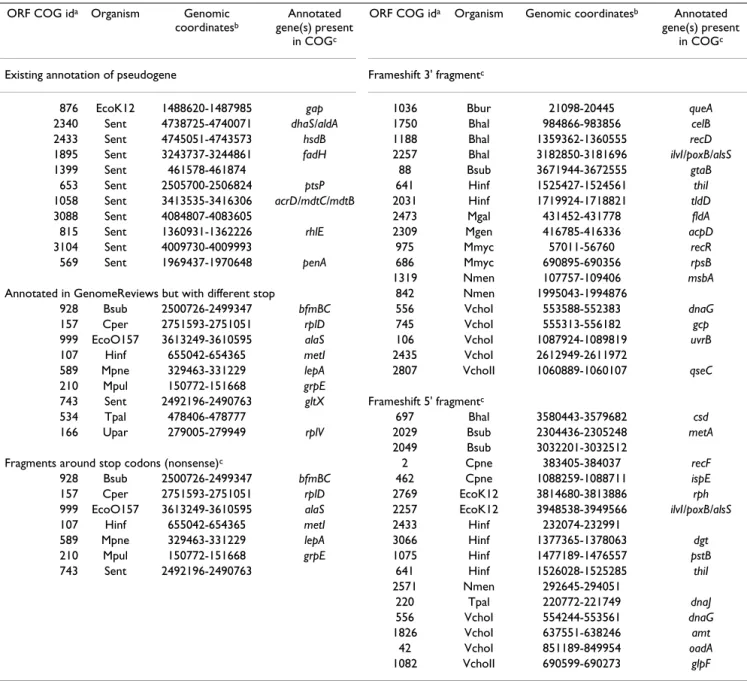
length present in two different strands; however the oppo-site strand had previously been chosen as coding. In 60 (of 143) cases comparison of gene lengths to ORF lengths indicates that the ORFs that are not annotated as genes may be pseudogenes (Table 3); most have frameshifts but some have nonsense mutations. 20 of these are annotated as pseudogenes in Genome Reviews 25.0 [4,25]. It is possible that some of the apparent non-sense or frameshift mutations may be due to sequencing errors.
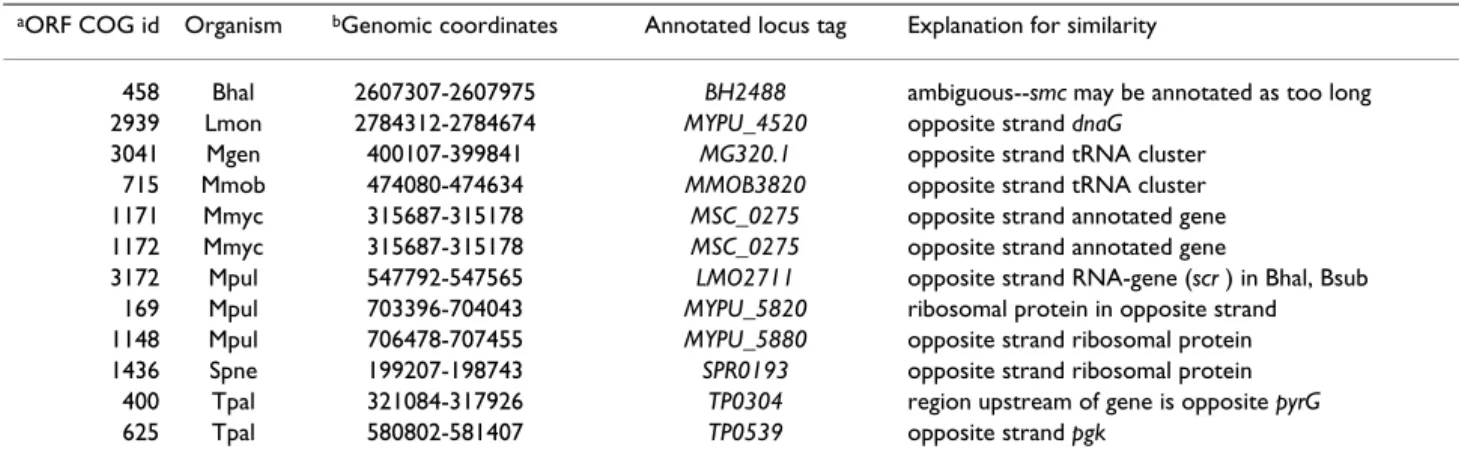
For COGs in which the majority of members do not cor-respond to annotated genes, the preponderance of evi-dence suggests that sequence conservation can be better explained by reasons other than protein coding of the ORF. At stringency 6 there are 12 of this type of COG among the organisms we studied, representing 11 distinct annotated genes (Table 4). The presence of a conserved ORF of length sufficient to be a potential gene may be explained by the presence of a gene in the opposite strand. This is particularly likely in species such as those of the Mollicutes class that do not use UGA as a stop codon. In
Table 3: ORFs in majority-annotated mixed COGs that do not appear to represent missed genes
ORF COG ida Organism Genomic
coordinatesb
Annotated gene(s) present
in COGc
ORF COG ida Organism Genomic coordinatesb Annotated
gene(s) present
in COGc
Existing annotation of pseudogene Frameshift 3' fragmentc
876 EcoK12 1488620-1487985 gap 1036 Bbur 21098-20445 queA
2340 Sent 4738725-4740071 dhaS/aldA 1750 Bhal 984866-983856 celB
2433 Sent 4745051-4743573 hsdB 1188 Bhal 1359362-1360555 recD
1895 Sent 3243737-3244861 fadH 2257 Bhal 3182850-3181696 ilvI/poxB/alsS
1399 Sent 461578-461874 88 Bsub 3671944-3672555 gtaB
653 Sent 2505700-2506824 ptsP 641 Hinf 1525427-1524561 thiI
1058 Sent 3413535-3416306 acrD/mdtC/mdtB 2031 Hinf 1719924-1718821 tldD
3088 Sent 4084807-4083605 2473 Mgal 431452-431778 fldA
815 Sent 1360931-1362226 rhlE 2309 Mgen 416785-416336 acpD
3104 Sent 4009730-4009993 975 Mmyc 57011-56760 recR
569 Sent 1969437-1970648 penA 686 Mmyc 690895-690356 rpsB
1319 Nmen 107757-109406 msbA
Annotated in GenomeReviews but with different stop 842 Nmen 1995043-1994876
928 Bsub 2500726-2499347 bfmBC 556 VchoI 553588-552383 dnaG
157 Cper 2751593-2751051 rplD 745 VchoI 555313-556182 gcp
999 EcoO157 3613249-3610595 alaS 106 VchoI 1087924-1089819 uvrB
107 Hinf 655042-654365 metI 2435 VchoI 2612949-2611972
589 Mpne 329463-331229 lepA 2807 VchoII 1060889-1060107 qseC
210 Mpul 150772-151668 grpE
743 Sent 2492196-2490763 gltX Frameshift 5' fragmentc
534 Tpal 478406-478777 697 Bhal 3580443-3579682 csd
166 Upar 279005-279949 rplV 2029 Bsub 2304436-2305248 metA
2049 Bsub 3032201-3032512
Fragments around stop codons (nonsense)c 2 Cpne 383405-384037 recF
928 Bsub 2500726-2499347 bfmBC 462 Cpne 1088259-1088711 ispE
157 Cper 2751593-2751051 rplD 2769 EcoK12 3814680-3813886 rph
999 EcoO157 3613249-3610595 alaS 2257 EcoK12 3948538-3949566 ilvI/poxB/alsS
107 Hinf 655042-654365 metI 2433 Hinf 232074-232991
589 Mpne 329463-331229 lepA 3066 Hinf 1377365-1378063 dgt
210 Mpul 150772-151668 grpE 1075 Hinf 1477189-1476557 pstB
743 Sent 2492196-2490763 641 Hinf 1526028-1525285 thiI
2571 Nmen 292645-294051 220 Tpal 220772-221749 dnaJ 556 VchoI 554244-553561 dnaG 1826 VchoI 637551-638246 amt 42 VchoI 851189-849954 oadA 1082 VchoII 690599-690273 glpF
aThe identifers for COGs are local to this study. They do not correspond to numbers in the NCBI COG database.
bCoordinates in which the first number is greater than the second indicate that the ORF is on the minus strand.
cA named annotated putative ortholog in another organism or paralog within the organism to the ORF listed.
these organisms, the exclusion of TAA and TAG in the actual coding frame can be associated with a relative shortage of TAn codons in the opposite strand, leading to ORFs of substantial length on the non-coding strand. This was the case for 7 of the 11, and we predict that the previ-ous annotations are erroneprevi-ous. Three of the annotated genes in majority-unannotated COGs overlap regions that appear to encode non-translated RNA genes. The con-straints of the RNA genes may have reduced the probabil-ity of occurrence of stop codons in the region, which lead to ORFs of sufficient length that they have been annotated as hypothetical genes in previous annotations.
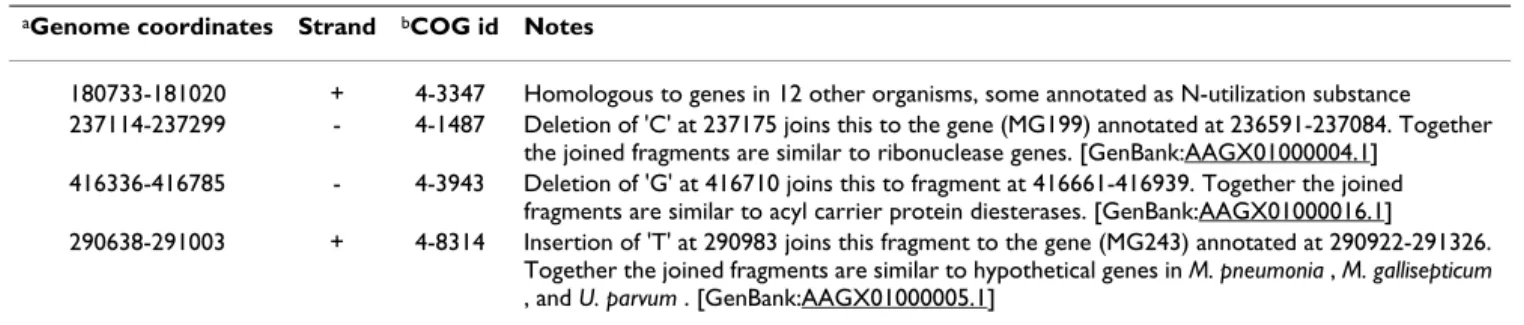
Possible pseudogenes as listed in Table 3 can be re-sequenced to evaluate whether there is in fact an underly-ing sequencunderly-ing error. Although this could be done on individual regions of a genome, the recent re-sequencing [26] of Mycoplasma genitalium strain G-37 [Gen-Bank:AAGX00000000] when compared to the original sequence [NC_000908.1] is illustrative. There are no mixed COGs at stringency 6 which contain unnannotated ORFs from the original M. genitalium sequence, but there are four such COGs at stringency 4 (Table 5). One of these ORFs (in COG 4-3347) is highly similar to sequences from 12 other organisms. The other ORFs contain appar-ent frameshifts that are resolved in the new sequence.
Discussion
Peptide sequence similarity as a gene discovery technique Although studies of intrinsic gene prediction report higher accuracies (for example, GeneMark is reported to have detected genes with sensitivity 98.3% and specificity 91.3% averaged over eight prokaryotes [27], this fact should be considered with the caveat that those algo-rithms or algoalgo-rithms similar to them were used to pro-duce the initial annotations. Because intrinsic methods require statistical models of coding sequence to be tuned
to a specific organism, they may miss recently acquired genes for which selection has not yet altered the polynu-cleotide frequencies to match the new host organism. Intrinsic methods may also miss small genes for which there is insufficient nucleotide sequence to provide a sta-tistically significant result. Most of the genes missed by our method are likely to be species specific among the organisms studied, (i.e. they are ORFans [28] within the context of the analyzed genomes). Our method may be more able to pick up genes that may have been horizon-tally transferred when compared to intrinsic methods. A different choice of size cutoff for consideration of ORFs would affect the accuracy of our method because longer ORFs are more likely to represent genes but genes smaller than the cutoff would be excluded. An increase in ORF size cutoff would result in an increase in specificity with a corresponding decrease in sensitivity. The fact that we were able to detect some genes that had been missed in prior genome annotations is in part because we used a very small size cutoff for consideration of which ORFs may be genes. The newly detected genes we report are dis-proportionately small (27% are shorter than 100 codons, compared to 11% of annotated genes).
A comparison of Figures 1A and 1B shows that incorporat-ing gene information from other organisms greatly increases the specificity (reducing false positives) of simi-larity-based gene identification, with a much smaller decrease in sensitivity. Classification using stringency 2 COGs (i.e. single linkage clusters) is highly sensitive but not very specific. Increasing stringency to three (the COGs as described by Tatusov et al. [21]) causes the largest dif-ference in specificity. The difdif-ference in specificity between stringencies two and three is even more pronounced when incorporating gene information from the other organ-isms.
Table 4: Minority-annotated mixed COGs of stringency 6
aORF COG id Organism bGenomic coordinates Annotated locus tag Explanation for similarity
458 Bhal 2607307-2607975 BH2488 ambiguous--smc may be annotated as too long
2939 Lmon 2784312-2784674 MYPU_4520 opposite strand dnaG
3041 Mgen 400107-399841 MG320.1 opposite strand tRNA cluster
715 Mmob 474080-474634 MMOB3820 opposite strand tRNA cluster
1171 Mmyc 315687-315178 MSC_0275 opposite strand annotated gene
1172 Mmyc 315687-315178 MSC_0275 opposite strand annotated gene
3172 Mpul 547792-547565 LMO2711 opposite strand RNA-gene (scr ) in Bhal, Bsub
169 Mpul 703396-704043 MYPU_5820 ribosomal protein in opposite strand
1148 Mpul 706478-707455 MYPU_5880 opposite strand ribosomal protein
1436 Spne 199207-198743 SPR0193 opposite strand ribosomal protein
400 Tpal 321084-317926 TP0304 region upstream of gene is opposite pyrG
625 Tpal 580802-581407 TP0539 opposite strand pgk
aCOG identifiers are local to this study.
The two gene prediction systems shown in Figure 1 are in general most accurate for the small genomes (Mycoplasma genitalium , Haemophilus influenzae , other Mycoplasma spe-cies). The high accuracies for Mollicutes may be explained by the presence of many members of this class in the set of organisms studied. The genes for Escherichia coli strain K12 can also be relatively well predicted, perhaps due to the fact that it is so well studied. Classification of E. coli genes performs particularly well in the second classifica-tion system, when informaclassifica-tion about annotated genes from other genomes is included. This may be due to the fact that the characteristics of genes of E. coli have been used to find those other genes in other organisms. Limitations of using sequence conservation for gene prediction
Genes with little conservation among the studied genomes or which are only present in a few genomes can-not be detected using sequence conservation, leading to false negatives. Sequence similarity can be due to reasons other than selection due to protein-coding function. This can lead to false positive gene predictions. Sequences that do not encode protein may be similar because: i) they are conserved for other reasons (non-coding control ele-ments, RNA-genes) or ii) because there is insufficient evo-lutionary distance between a pair of studied species. The latter can be the case for pseudogenes – a region in one genome may contain a gene while the corresponding region in another genome may not actually code for pro-tein but may not have accumulated enough mutations to prevent detection of homology.
Examples of gene prediction inconsistencies in COGs of ORFs
The ORFs in Mycoplasma penetrans from 1316960 to 1317088 on the minus strand and in Mycoplasma mycoides from 830742 to 830915 on the minus strand do not con-tain annotated genes. They are however members of a COG at stringency 6 (COG id 199 in Table 2) in which the majority of ORFs (25 of 27) correspond to annotated genes. The annotated members of the COG encode the
50S ribosomal protein L36. The sequence identities from the M. penetrans ORF to the annotated genes in the COG range from 39.0% to 83.3%. For the M. mycoides ORF the range is from 35.2% to 75.7%. Neither of the ORFs have any interruption in coding potential compared to the annotated genes in the COG. It is likely that these ORFs contain genes that were missed in the initial annotations of their organisms. The peptides they encode are less than 40 amino acids long, and this may account for the fact that the genes had not been previously detected.
The Vibrio cholerae ORF from 637551 to 638246 in the plus strand of chromosome I is present in a COG of strin-gency 6 (COG id 1826 in Table 3) in which 11 ORFs cor-respond to annotated genes. The V. cholerae ORF is only about 60% as long as the annotated genes, and the poten-tial peptide sequence it encodes aligns to the amino termi-nal region of the annotated genes. Examination of the genomic context of the members of this COG reveals a nearby V. cholerae ORF from positions 638126 to 638788 which could encode peptide which would align the to car-boxy terminus of the annotated genes of this COG. This suggests the presence of a frameshift or sequencing error in the region encompassing the two V. cholerae ORFs. The secG gene annotated in M. genitalium , M. penetrans , M. pneumoniae and U. parvum has homologs in M. gallisep-ticum , M. mobile , M. mycoides and M. pulmonis . The M. genitalium homolog was detected by curators of the Genome Reviews database (it is not identified in the EMBL genome file). This group of homologs is present in COG id 3175 in Table 2. The M. gallisepticum homolog is identified as a potential gene, but given the annotation "unique hypothetical". The M. mobile and M. mycoides homologs are not identified as genes. In M. pulmonis , the ORF homologous to secG (genomic coordinates 412829 to 413074 on the forward strand) is not identified as a gene, but overlaps the locus MYPU_3500 which is on the opposite strand. It is likely that this is an error in the exist-ing annotation – that the secG homolog is a real gene and
Table 5: Mixed COGs containing ORFs from Mycoplasma genitalium that do not correspond to annotated genes aGenome coordinates Strand bCOG id Notes
180733-181020 + 4-3347 Homologous to genes in 12 other organisms, some annotated as N-utilization substance
237114-237299 - 4-1487 Deletion of 'C' at 237175 joins this to the gene (MG199) annotated at 236591-237084. Together
the joined fragments are similar to ribonuclease genes. [GenBank:AAGX01000004.1]
416336-416785 - 4-3943 Deletion of 'G' at 416710 joins this to fragment at 416661-416939. Together the joined
fragments are similar to acyl carrier protein diesterases. [GenBank:AAGX01000016.1]
290638-291003 + 4-8314 Insertion of 'T' at 290983 joins this fragment to the gene (MG243) annotated at 290922-291326.
Together the joined fragments are similar to hypothetical genes in M. pneumonia , M. gallisepticum , and U. parvum . [GenBank:AAGX01000005.1]
aCoordinates and insertions/deletions refer to [GenBank:NC_000908.1]
the MYPU_3500 locus, while being slightly longer, does not actually encode a peptide sequence in the cell. Detecting pseudogenes
Several groups have used computational techniques to find pseudogenes in prokaryotes. Intrinsic techniques are poorly suited for identifying pseudogenes. Pseudogenes may lack characteristics of protein-coding sequence in a particular organism because they have resulted from recent horizontal transfer [29] or because there is a lack of selective pressure to maintain the characteristics. As a result, extrinsic techniques are common when searching for pseudogenes. Liu et al. [29] sought pseudogenes using SwissProt entries as queries in FastX searches against genome sequences. They used a fixed similarity cutoff score of 0.01 to define significant matches. The lack of selective pressure and resulting genetic drift that makes it difficult to find pseudogenes by intrinsic methods can also make it difficult to find homology between a pseudo-gene and the pseudo-gene from which it was derived in disparate genome sequences. Lerat and Ochman [30] considered sets of closely related organisms and used thresholds for inferred homology as strict as TBLASTN E-value < 10-15
and protein identity >79%. By using COGs we were able to detect much more distant homology. There were 232 COGs of stringency-6 that contained at least one best-hit with a BLASTP E-value > 1.0.
Potential extensions and modifications to the methods of this study
One obvious extension of this study is to apply the strat-egy described here to more genome sequences. The scala-bility of the methods described in this study are limited primarily by the initial BLASTP searches of translations of the ORFs. Because all pairwise comparisons are per-formed, this step scales as the square of the number of ORFs among the genome sequences studied, which can be approximated by the square of the number of genome sequences. As of June 2005, there are 211 bacterial and 21 archaeal genome sequences published [31], about 8.9 times the number of genome sequences analyzed here. The similarity search comparison step is time consuming but highly parallel. Because each similarity search is inde-pendent of the other searches, the process can be carried out among many CPUs. New genome sequences can be added to the study incrementally.
One shortcut that could mitigate scaling issues would be to form a standard set of COGs of the various stringencies among only the annotated genes. All of the ORFs in a test genome sequence could then be compared to the mem-bers of the standard COGs. The annotated genes of the genomes studied here are only 5.75% of the ORFs of 30 or more codons, greatly reducing the number of compari-sons that would need to be performed. This shortcut has
COGs at varying stringencies
Figure 3
COGs at varying stringencies. The concept of stringency
places a requirement of interconnectedness of elements of a COG. As stringency increases, COGs may split into smaller COGs and less-connected nodes are dropped. Each vertex represents a gene (as used in the initial definition of COGs) or an ORF (as used in this study). Edges represent bidirec-tional best-hit pairs. Dashed lines enclose elements of a single COG. Grayed vertices and edges do not participate in a COG at the given stringency. There is a single COG of strin-gency (2) containing all of the vertices in this graph because they are all transitively connected. Stringency (3) COGs are as described by Tatusov et al. [21]. An orthologous group of stringency 3 forms a triangle (such as {i , j , k }); orthologous groups of stringency (3) are clustered if they share two verti-ces (alternatively: if they share an edge). Stringency (4) OGs are clustered if they share three vertices. The orthologous groups {j , k , l , m } and {l , m , n , o } only share two vertices so they form two separate COGs. At stringency (5) only one orthologous group, and thus only one COG, remains.
a few drawbacks: i) it will not be possible to detect genes which are not present in enough of the genomes in the standard set (depending on stringency) and ii) it will not be possible to find the 'minority-annotated' mixed COGs that can indicate over-prediction of genes.
The varying stringency COGs produced using the tech-niques of this study could also be used in other analyses. The multiple sequence alignments of COGs could be used to help define which of several potential translational start sites may be used in a given gene. Stringency-three COGs which contain members in many organisms have been used to indicate genes which may be essential on account of their pervasiveness. Higher stringency COGs show not only that corresponding elements are present in many organisms but also that between most or all of pairs of organisms the elements are best-hit pairs of each other. Relationship to proteomic studies
Jaffe et al. [3] revisited the annotation of genes in Myco-plasma pneumoniae , incorporating evidence of peptides detected using multi-dimensional chromatography fol-lowed by analysis by mass-spectrometry. They detected evidence for 16 proteins which could not be associated with annotated genes. One of these (from 207448 to 207717 in the (+) strand) was present in COGs up to stringency 10. Two more (from 250021 to 250293 and from 415490 to 416032, both on the (+) strand) were present in COGs of stringency 3. The others were only present in COGs of stringency 2. The Jaffe et al. study was aided by the fact that M. pneumoniae has a simple lifestyle and grows in a relatively static natural environment. Although some change in M. pneumoniae gene expression is reported in response to heat shock [32], it is thought that most of its genes are expressed constitutively. In organisms with more complex niches or lifestyles that may involve growing in multiple hosts or environments, the shotgun proteomic approach will require exposing the organisms to multiple conditions in order to induce detectable expression of all proteins.
Conclusion
In this paper, we describe a method that can be used in combination with existing techniques for detecting pro-tein-coding gene sequences in bacterial genomes. Our method is extrinsic an individual in that it incorporates pairwise sequence similarities among several genomes. The methods we describe can also be used to screen exist-ing gene predictions. The "mixed COGs", in which some open reading frames correspond to annotated genes and some do not, are attractive targets for further study. Such COGs exist even when requiring best-hit similarity pair-ings among many organisms, and we list the COGs of this type that exist at stringency six among 27 sequenced
bac-SPROCKET
Figure 4
SPROCKET. The SPROCKET program was developed to
facilitate the analysis performed in this study. For the mem-bers of a COG, a user can view the peptide sequence align-ment (using CLUSTALW), a graph of the best-hit
terial strains. The methods we describe can be used to gen-erate hypotheses about the presence of specific genes that may have been missed in existing annotations. Such a hypothesis could be evaluated by a targeted search for the expected protein product based on predicted protein char-acteristics.
Methods
Sequence preparation, comparison and Best Hit determination
Sequences and existing annotations for genomes under study (Table 1) were obtained from the Genome Reviews database [4] version 25.0 [25]. The annotations in the Genome Review database include those from the EMBL sequence files with corresponding accessions as well as some genes that were identified on the basis of BLAST similarity to sequences in UniProt. We located open read-ing frames (ORFs) usread-ing the criterion of at least 90 nucle-otides (30 codons) between in-frame stop codons (for codon usage tables appropriate to each organism – the included Mollicute species do not use UGA as a stop codon).
Sequence libraries composed of all of the ORFs in the sequences of included genomes were searched using each ORF as a query. These all-against-all searches were per-formed using WU-BLAST (BLASTP 2.0 MP-WashU [06-Apr-2005] [macosx-10.2-g4-ILP32F64 2005-04-06T17:46:37], BLOSUM62 similarity matrix, filtered with SEG, Smith-Waterman alignment used in the scoring phase). The top ten hits from each query to a library of ORFs from another organism were recorded provided the BLAST e-score was less than or equal to 20. There were 84009520 BLAST hits which met these criteria.
COG analysis
A modification of the concept of Clusters of Orthologous Groups (COGs) [21,33,34] which includes levels of strin-gency [23] was used to group similar sequences among organisms. The COGs formed are graphs with ORFs as ver-tices using the following procedure:
1. For each ORF, compare it to all ORFs in another organ-ism, recording the best hit (BeT), provided that hit meets the loose stringency cutoff mentioned above (e-score less than 20).
2. If an ORF a has ORF b as its best hit in another organism and b has a as its best hit when the reciprocal similarity search is performed then a and b are said to have a "bidi-rectional" or "congruent" best-hit relationship. A pair of vertices will have edges connecting them if the ORFs they represent have a bidirectional best-hit relationship. For purposes of this step, ORFs the two strains of E. coli were not compared to each other.
3. For a given stringency n , cliques (complete graphs – wherein all nodes are connected to all other nodes) of size n are found. Cliques are joined when they share a sub-clique of size n-1 maximally-joined sets of sub-cliques form a COG.
According to this formalization, the original COGs as described by Tatusov, et al. [21] are COGs of stringency three. They consist of triangles formed from congruent best-hit relationships which are clustered by shared edges. These triangles are cliques of size 3 and are referred to by Tatusov et al. as orthologous groups (OGs). Stringency-two COGs are equivalent to graphs clustered by single linkage. Each stringency-two COG is an individual con-nected component of the total graph. As stringency increases, poorly connected vertices drop out of COGs and COGs may split (Figure 3).
Like the extended COGs used in the STRING database [35], the COGs in this study are 'non-supervised'; we have not performed any manual curation subsequent to COG production. A gene fusion may result in the merging of two disparate COGs. Although such an artifact affects the use of COGs in functional annotation, it is not problem-atic when using COGs for gene recognition so we made no effort to avoid these merging events. The BLAST searches resulted in 2649524 best-hit pairs involving 891039 ORFs. Only 38 best-hit pairs involved a similarity with E-value as high as 20, and none of these best-hit pairs held together a COG of stringency three or higher. SPROCKET
The SPROCKET program (System for Protein Recognition using ORF COGs – a Knowledge Extraction Tool) pro-vides several ways of viewing and analyzing COG data of the type produced in this study (Figure 4). The front-end of the program is written in Java and runs on any platform with a version 1.4 or later Java virtual machine. Data for the program is stored in a relational database using a schema based on the BioSQL schema developed by the Open Bioinformatics Foundation [36] with extensions for the COG-specific information. Loading of initial sequences into the database was performed using por-tions of the BioJava project [37].
A summary view of the COGs shows the number of mem-bers of a COG and how many of those memmem-bers share a stop codon with an annotated gene. Individual COGs can be examined in more detail by seeing a list of their mem-bers, a force-directed graph layout showing best-hit rela-tionships among these members, an alignment of the potential peptide sequences of the ORFs as produced by CLUSTALW [38] or a graphical view of the regions of the genomes around the ORFs which are in a COG.
We provide source code for producing high stringency COGs [see Additional file 2] and for browsing the data-base of COGs [see Additional file 3].
Availability and Requirements
Project name: SPROCKET
Project home page: http://groove.med.unc.edu/sprocket Operating system(s): Platform independent
Programming language: C++ (COG construction), Java (COG viewing)
Other requirements: Java 1.4 or higher, PostgreSQL (only required if data stored locally)
License: GNU GPL (COG construction), BSD (COG view-ing)
Authors' contributions
BP conceived the study, wrote the software, analyzed the results and drafted the manuscript. CH supervised the study and provided extensive suggestions on the research as it progressed and on the manuscript. Both authors read and approved the final manuscript.
Additional material
Acknowledgements
This work was supported by a Public Health Service research grant subcon-tracted to UNC-CH (Clyde A. Hutchison III) from the Berkeley Structural Genomics Center (GM62412, Sung-Hou Kim). We thank Morgan Giddings
for computational resources and Jack Snoeyink and Craig Falls for algorith-mic insights into calculating high-stringency COGs.
References
1. Dandekar T, Huynen M, Regula JT, Ueberle B, Zimmermann CU, Andrade MA, Doerks T, Sanchez-Pulido L, Snel B, Suyama M, Yuan YP, Herrmann R, Bork P: Re-annotating the Mycoplasma
pneu-moniae genome sequence: adding value, function and read-ing frames. Nucleic Acids Res 2000, 28(17):3278-3288.
2. Iliopoulos I, Tsoka S, Andrade MA, Enright AJ, Carroll M, Poullet P, Promponas V, Liakopoulos T, Palaios G, Pasquier C, Hamodrakas S, Tamames J, Yagnik AT, Tramontano A, Devos D, Blaschke C, Valencia A, Brett D, Martin D, Leroy C, Rigoutsos I, Sander C, Ouzounis CA:
Evaluation of annotation strategies using an entire genome sequence. Bioinformatics 2003, 19(6):717-726.
3. Jaffe JD, Berg HC, Church GM: Proteogenomic mapping as a
complementary method to perform genome annotation.
Proteomics 2004, 4(1):59-77.
4. Kersey P, Bower L, Morris L, Horne A, Petryszak R, Kanz C, Kanapin A, Das U, Michoud K, Phan I, Gattiker A, Kulikova T, Faruque N, Dug-gan K, McLaren P, Reimholz B, Duret L, Penel S, Reuter I, Apweiler R:
Integr8 and Genome Reviews: integrated views of complete genomes and proteomes. Nucleic Acids Res 2005, 33(Database issue):D297-302.
5. Pruitt KD, Tatusova T, Maglott DR: NCBI Reference Sequence
(RefSeq): a curated non-redundant sequence database of genomes, transcripts and proteins. Nucleic Acids Res 2005, 33(Database issue):D501-4.
6. Arthur JW, Wilkins MR: Using proteomics to mine genome
sequences. J Proteome Res 2004, 3(3):393-402.
7. Giddings MC, Shah AA, Gesteland R, Moore B: Genome-based
peptide fingerprint scanning. Proc Natl Acad Sci U S A 2003, 100(1):20-25.
8. Jaffe JD, Stange-Thomann N, Smith C, DeCaprio D, Fisher S, Butler J, Calvo S, Elkins T, FitzGerald MG, Hafez N, Kodira CD, Major J, Wang S, Wilkinson J, Nicol R, Nusbaum C, Birren B, Berg HC, Church GM:
The complete genome and proteome of Mycoplasma mobile. Genome Res 2004, 14(8):1447-1461.
9. Wu J, Kasif S, DeLisi C: Identification of functional links
between genes using phylogenetic profiles. Bioinformatics 2003, 19(12):1524-1530.
10. Kim SH, Shin DH, Choi IG, Schulze-Gahmen U, Chen S, Kim R:
Structure-based functional inference in structural genomics.
J Struct Funct Genomics 2003, 4(2-3):129-135.
11. Hutchison CA, Peterson SN, Gill SR, Cline RT, White O, Fraser CM, Smith HO, Venter JC: Global transposon mutagenesis and a
minimal Mycoplasma genome. Science 1999,
286(5447):2165-2169.
12. Mushegian AR, Koonin EV: A minimal gene set for cellular life
derived by comparison of complete bacterial genomes. Proc
Natl Acad Sci U S A 1996, 93(19):10268-10273.
13. Fickett JW: Finding genes by computer: the state of the art.
Trends Genet 1996, 12(8):316-320.
14. Fleischmann RD, Adams MD, White O, Clayton RA, Kirkness EF, Kerlavage AR, Bult CJ, Tomb JF, Dougherty BA, Merrick JM, McKen-ney K, Sutton G, Fitzhugh W, Fields C, Gocayne JD, Scott J, Shirley R, Liu LI, Glodek A, Kelley JM, Weidman JF, Phillips CA, Spriggs T, Hed-blom E, Cotton MD, Utterback TR, Hanna MC, Nguyn DT, Saudek DM, Brandon RC, Fine LD, Frichtman JL, Fuhrmann JL, Geoghagen NSM, Gnehm CL, McDonald LA, Small KV, Fraser CM, Smith HO, Venter JC: Whole-genome random sequencing and assembly
of Haemophilus influenzae Rd. Science 1995,
269(5223):496-512.
15. Karlin S, Mrazek J, Campbell AM: Codon usages in different gene
classes of the Escherichia coli genome. Mol Microbiol 1998, 29(6):1341-1355.
16. Harrison PM, Carriero N, Liu Y, Gerstein M: A "polyORFomic"
analysis of prokaryote genomes using disabled-homology fil-tering reveals conserved but undiscovered short ORFs. J Mol
Biol 2003, 333(5):885-892.
17. Altschul SF, Madden TL, Schaffer AA, Zhang J, Zhang Z, Miller W, Lip-man DJ: Gapped BLAST and PSI-BLAST: a new generation of
protein database search programs. Nucleic Acids Res 1997, 25(17):3389-3402.
Additional File 1
This Excel file contains the tabulated sensitivities, specificities, and posi-tive predicposi-tive values for classification of open reading frames as genes or not genes, compared to existing annotations.
Click here for file
[http://www.biomedcentral.com/content/supplementary/1471-2105-7-31-S1.xls]
Additional File 2
Source code archive for a C++ program to find high-stringency COGs given a set of bidirectional best-hit pairs. In gzip-compressed tar format.
Click here for file
[http://www.biomedcentral.com/content/supplementary/1471-2105-7-31-S2.tgz]
Additional File 3
Source code archive for a Java program to browse the database of COGs discussed in this manuscript. In gzip-compressed tar format.
Click here for file
[http://www.biomedcentral.com/content/supplementary/1471-2105-7-31-S3.tgz]
Publish with BioMed Central and every scientist can read your work free of charge "BioMed Central will be the most significant development for disseminating the results of biomedical researc h in our lifetime."
Sir Paul Nurse, Cancer Research UK
Your research papers will be:
available free of charge to the entire biomedical community peer reviewed and published immediately upon acceptance cited in PubMed and archived on PubMed Central yours — you keep the copyright
Submit your manuscript here:
http://www.biomedcentral.com/info/publishing_adv.asp
BioMedcentral
18. Pachter L, Alexandersson M, Cawley S: Applications of
general-ized pair hidden Markov models to alignment and gene find-ing problems. J Comput Biol 2002, 9(2):389-399.
19. Brent MR, Guigo R: Recent advances in gene structure
predic-tion. Curr Opin Struct Biol 2004, 14(3):264-272.
20. Ochman H: Distinguishing the ORFs from the ELFs: short
bac-terial genes and the annotation of genomes. Trends Genet
2002, 18(7):335-337.
21. Tatusov RL, Koonin EV, Lipman DJ: A genomic perspective on
protein families. Science 1997, 278(5338):631-637.
22. Thomas JW, Touchman JW, Blakesley RW, Bouffard GG, Beckstrom-Sternberg SM, Margulies EH, Blanchette M, Siepel AC, Thomas PJ, McDowell JC, Maskeri B, Hansen NF, Schwartz MS, Weber RJ, Kent WJ, Karolchik D, Bruen TC, Bevan R, Cutler DJ, Schwartz S, Elnitski L, Idol JR, Prasad AB, Lee-Lin SQ, Maduro VV, Summers TJ, Portnoy ME, Dietrich NL, Akhter N, Ayele K, Benjamin B, Cariaga K, Brinkley CP, Brooks SY, Granite S, Guan X, Gupta J, Haghighi P, Ho SL, Huang MC, Karlins E, Laric PL, Legaspi R, Lim MJ, Maduro QL, Masiello CA, Mastrian SD, McCloskey JC, Pearson R, Stantripop S, Tiongson EE, Tran JT, Tsurgeon C, Vogt JL, Walker MA, Wetherby KD, Wiggins LS, Young AC, Zhang LH, Osoegawa K, Zhu B, Zhao B, Shu CL, De Jong PJ, Lawrence CE, Smit AF, Chakravarti A, Haussler D, Green P, Miller W, Green ED: Comparative analyses of multi-species
sequences from targeted genomic regions. Nature 2003, 424(6950):788-793.
23. Montague MG, Hutchison CA: Gene content phylogeny of
her-pesviruses. Proc Natl Acad Sci U S A 2000, 97(10):5334-5339.
24. BSGC: Berkeley Structural Genomics Center. [http:// www.strgen.org ].
25. GenomeReviews: Genome Reviews. [http://www.ebi.ac.uk/Geno meReviews ].
26. Margulies M, Egholm M, Altman WE, Attiya S, Bader JS, Bemben LA, Berka J, Braverman MS, Chen YJ, Chen Z, Dewell SB, Du L, Fierro JM, Gomes XV, Godwin BC, He W, Helgesen S, Ho CH, Irzyk GP, Jando SC, Alenquer ML, Jarvie TP, Jirage KB, Kim JB, Knight JR, Lanza JR, Leamon JH, Lefkowitz SM, Lei M, Li J, Lohman KL, Lu H, Makhijani VB, McDade KE, McKenna MP, Myers EW, Nickerson E, Nobile JR, Plant R, Puc BP, Ronan MT, Roth GT, Sarkis GJ, Simons JF, Simpson JW, Srinivasan M, Tartaro KR, Tomasz A, Vogt KA, Volkmer GA, Wang SH, Wang Y, Weiner MP, Yu P, Begley RF, Rothberg JM: Genome
sequencing in microfabricated high-density picolitre reac-tors. Nature 2005, 437(7057):376-380.
27. Besemer J, Lomsadze A, Borodovsky M: GeneMarkS: a
self-train-ing method for prediction of gene starts in microbial genomes. Implications for finding sequence motifs in regula-tory regions. Nucleic Acids Res 2001, 29(12):2607-2618.
28. Siew N, Fischer D: Analysis of singleton ORFans in fully
sequenced microbial genomes. Proteins 2003, 53(2):241-251.
29. Liu Y, Harrison PM, Kunin V, Gerstein M: Comprehensive analysis
of pseudogenes in prokaryotes: widespread gene decay and failure of putative horizontally transferred genes. Genome Biol
2004, 5(9):R64.
30. Lerat E, Ochman H: Recognizing the pseudogenes in bacterial
genomes. Nucleic Acids Res 2005, 33(10):3125-3132.
31. GOLD: GOLD: Genomes OnLine Database. [http:// www.genomesonline.org ].
32. Weiner J, Zimmerman CU, Gohlmann HW, Herrmann R:
Tran-scription profiles of the bacterium Mycoplasma pneumoniae grown at different temperatures. Nucleic Acids Res 2003, 31(21):6306-6320.
33. Tatusov RL, Natale DA, Garkavtsev IV, Tatusova TA, Shankavaram UT, Rao BS, Kiryutin B, Galperin MY, Fedorova ND, Koonin EV: The
COG database: new developments in phylogenetic classifica-tion of proteins from complete genomes. Nucleic Acids Res
2001, 29(1):22-28.
34. Tatusov RL, Fedorova ND, Jackson JD, Jacobs AR, Kiryutin B, Koonin EV, Krylov DM, Mazumder R, Mekhedov SL, Nikolskaya AN, Rao BS, Smirnov S, Sverdlov AV, Vasudevan S, Wolf YI, Yin JJ, Natale DA: The
COG database: an updated version includes eukaryotes.
BMC Bioinformatics 2003, 4(1):41.
35. von Mering C, Huynen M, Jaeggi D, Schmidt S, Bork P, Snel B:
STRING: a database of predicted functional associations between proteins. Nucleic Acids Res 2003, 31(1):258-261.
36. OBDA: OBDA Main Page. [http://obda.open-bio.org ]. 37. Biojava: BioJava. [http://biojava.org ].
38. Chenna R, Sugawara H, Koike T, Lopez R, Gibson TJ, Higgins DG, Thompson JD: Multiple sequence alignment with the Clustal