ISSN Online: 2160-0503 ISSN Print: 2160-049X
DOI: 10.4236/wjm.2017.79021 Sep. 25, 2017 255 World Journal of Mechanics
Computational Analysis of the Metal
Free-Surface Instability, Fragmentation,
and Ejecta under Shock
Jingsong Bai1,2, Tao Wang1*, Jiaxin Xiao1, Bing Wang1, Han Chen1, Lei Du1, Xinzhu Li1,2, Qiang Wu1,2
1Institute of Fluids Physics, China Academy of Engineering Physics, Mianyang, China
2National Key Laboratory of Shock Wave and Detonation Physics (LSD), Institute of Fluid Physics, China Academy of
Engineering Physics, Mianyang, China
Abstract
We conducted numerical simulations of the related processes of interface in-stability, tensile fragmentation, and jetting resulting from four kinds of typical macro defect perturbations (chevron, sine wave, rectangle, and square) on a Cu free surface under a reflected shock wave when Cu impacts a solid wall at a speed of 2.5 km/s and found that, for the chevron and sine wave cases, the ejecta velocities of the head are 6.28 and 5.88 km/s, respectively. Some parts of the inner material are in a tensile state without any fragmentation, which is observed only in the main body of the material owing to the tension effect. Furthermore, for the other two initial perturbations (rectangle and square), the highest ejecta velocities may even reach 9.14 and 9.59 km/s, respectively. Fragmentation caused by multilayer spallation can be observed on a large scale in the Cu main body, and there are granules in the front area of the ejec-ta but the degree to which fragmenejec-tation occurs is much less in the Cu main body and there is a notable high-speed, low-density granule area in the ejecta head. Finally, we present a detailed analysis of the spatial distribution of the granules, ejecta mass, pressure, temperature, and grid convergence.
Keywords
Interface Instability, Particle Ejecta, High-Speed Collision, Spallation
1. Introduction
Metal interface instability occurs as a reaction to the effect of a shock wave or acceleration or to a shear load on the perturbed interface, and may afterward How to cite this paper: Bai, J.S., Wang, T.,
Xiao, J.X., Wang, B., Chen, H., Du, L., Li, X.Z. and Wu, Q. (2017) Computational Analysis of the Metal Free-Surface Instability, Fragmenta-tion, and Ejecta under Shock. World Journal of Mechanics, 7, 255-270.
https://doi.org/10.4236/wjm.2017.79021
Received: July 14, 2017 Accepted: September 12, 2017 Published: September 25, 2017
Copyright © 2017 by authors and Scientific Research Publishing Inc. This work is licensed under the Creative Commons Attribution International License (CC BY 4.0).
DOI: 10.4236/wjm.2017.79021 256 World Journal of Mechanics lead to fragmentation and mixing. This phenomenon, common in explosions and shock processes under extreme conditions (high temperature and high pressure), is jointly controlled by three scale factors, i.e., 1) the thermodynamics and the geometric boundary (macroscopic scale), 2) the initial perturbation of the metal interface (mesoscopic scale), and 3) material properties (microscopic- mesoscopic scale). Metal interface instability is a typical multiscale, multiphysi-cal, strongly coupled, nonequilibrium, and complex flow phenomena.
DOI: 10.4236/wjm.2017.79021 257 World Journal of Mechanics metal melting, plasma from a laser-driven polymer layers acts on the CH-based epoxy samples across the vacuum gap. In 2014, Smalyuk, Casey, and Clark et al.
[10] firstly observed the hydrodynamic instability growth in indirectly driven implosions at the National Ignition Facility; their results are in good agreement with theoretical and simulation studies. Their work is the first step in experi-mentally studying hydrodynamic instability in a converging configuration. American and Russian researchers [11] [12] [13] conducted explosive and mag-netic driving experiments to research material constitutive behavior by using perturbation growth and then developed a new material constitutive model to predict the results of experiments under high pressure and high strain rate. In the 1990s, using a high-speed camera, Chen, Zeng, and Wang et al. [14] per-formed experimental research on the interface instability of a alloy/water system in a cylindrical implosion configuration that was numerically simulated based on the hydrodynamics by Lin, Xia, and Zhang [15]. Recently, Wang, Bai, and Cao et al. [16] have conducted experiments and numerical simulations of an aluminum flyer driven by an explosion and observed the sine perturbation growth at early time.
The theoretical study of the metal RT instability is limited by the material models used and also the lack of comparison with related experiments. Particu-larly, at the turbulent mixing stage, it is difficult to predict the development of the interface instability. Despite some progress made in experimental studies, understanding of metal instability in detail is still hindered by diagnostic tech-niques. Therefore, because the problems in algorithm precision, the constitutive model, and the equation of state (EOS) are still too tough to solve, simulation work stands out as especially worthwhile. Some effective software and codes, such as ABQUS, Lagrange codes FCI2, MAGEE, TOODY II [17], and Euler codes ALE3D and CHAP [18] and the two-dimensional (2D) Euler MHD pro-gram, have been designed and improved just for this purpose. By combining si-mulation and experiment, the evolution pattern of the metal interface instability is presented with time. The instability growth obtained indicates that the materi-al strength and load history and the perturbation wavelength and amplitude have a vital influence on the RT instability. Specifically, the material strength re-strains the growth and development of the interface instability, and only when the initial amplitude reaches or exceeds a specific value does the instability de-velop.
Under shock loading, macro defects perturbations on metal free surface may lead to ejecta and fragmentation. We numerically studied the growth of the in-stability on the metal interface with four kinds of typical macro defect (chevron, sine wave, rectangle, and square) perturbations and the dynamic characteristics of ejecta.
2. Numerical Methods
DOI: 10.4236/wjm.2017.79021 258 World Journal of Mechanics and turbulence) [19] [20] [21] by taking into consideration explosive detonation and the elastic-plastic behavior of the material. An Euler finite volume algorithm and code describing detonations and shocks dynamics with three-order accuracy has been developed using the two-step Euler algorithm with three-order accura-cy. More specifically, the Lagrange and remap algorithms are applied to solve the mass, momentum, and energy conservation equations. In a single Lagrange step, the integration of the Lagrange control equation at one time step is obtained, the deformation of the material leads to deformation of the initial grid, and there is no material flow between the grids, whereas, in a single remapping step, the ve-locity and energy, deviation stress, and other state parameters in the Lagrange deforming grid are remapped back to the initial grid. The governing equations used are given as follows:
d d ,
d d d d ,
d d d d ,
i i
V S
j j ij i i j i
V S S S
j j i ij j j j
V S S S
V u n S
t
u V Pn S s n S u u n S
t
E V u Pn S u s u S u En S
t ρ ρ ρ ρ ρ ρ ∂ = − ∂ ∂ = − + − ∂ ∂ = − + − ∂
∫
∫
∫
∫
∫
∫
∫
∫
∫
∫
(1)where V is the control volume, uj is the velocity, S is the surface area of control volume, n is the external normal line, sij is the deviatoric stress tensor, P is the
static pressure, and E is the total energy per unit mass.
First, in our numerical simulation, a dimension splitting method is used to split Equation (1) into three one-dimensional problems, which are then solved using the piecewise parabolic method (PPM) method to perform the interpola-tion and reconstrucinterpola-tion of the physical quantity in each grid. Owing to the lack of automatic monotonicity of PPM, there would be numerical oscillation at the discontinuity point, which leads to a decrease in the accuracy of the disconti-nuous solution. To restrict the numerical oscillation, we introduce a flow re-strictor. In adopting this method, a monotonic limiter is utilized so that the cal-culation of δQj is limited monotonically, as shown in the following:
( )
(
)
( )
(
)(
)
(
)(
)
1 1 1 1
1 1
min , 2 , 2 sgn , 0,
0, 0,
n n n n n n n n
j j j j j j j j j j
j mono
n n n n
j j j j
Q Q Q Q Q Q Q Q Q Q
Q
Q Q Q Q
δ δ
δ − + + −
+ −
− − − − >
=
− − ≤
(2)
to keep 1 2
n j
Q+ between Qnj and 1
n j
Q+ , where the Q are conservation
quanti-ties.
In a Lagrange step, the material strength model, artificial viscosity, and explo-sive detonation model are needed for calculation and, therefore, the Jones-Wilkins -Lee (JWL) equation of state is used for the explosive detonation and the Mie-Gruneisen equation of state is applied for the strength material. As for the strength model, we utilize the Steinberg-Guinan constitutive model.
DOI: 10.4236/wjm.2017.79021 259 World Journal of Mechanics of separating variables. Additionally, because the flow stress in the Steinberg- Guinan constitutive model relies on pressure, the material constitutive equation and the state equation are coupled, indicating stress hardening of the metal un-der a high pressure. The shear modulus and flow stress in the Steinberg-Guinan constitutive model can be expressed as
(
)
1 3(
)
0
0 0
0 0
1 1
, 1 G G 300 ,
G P T G P T
G P η G T
−
∂ ∂
= + + −
∂ ∂
(3)
(
)
1 3(
)
SG 0 1 1 300 ,
n
Y B A P T
σ = + ε + η− −α −
(4)
where Y0 signifies the yield strength in the initial state, G0 is the shear modulus in the initial state, P and T are the pressure and temperature,
(
∂ ∂G P)
0 and(
∂ ∂G T)
0 represent, respectively, the partial derivatives of shear modulus to the pressure and temperature in the initial state, A and α correspond to(
∂ ∂G P)
0 G0 and(
∂ ∂G T)
0 G0 , B and n are material strain hardening pa-rameters, ε is the strain, and η ρ ρ= 0 is the material compression ratio.The form taken by the Steinberg-Guinan constitutive model is irrelevant to the strain rate, yet the requirement upon the strain rate is that it should be >105 s−1. The reason for this restriction is that the effect of metal softening counteracts that of metal hardening, so this model can be used to describe multimaterial flow stress under high pressure, which is also the mostly used constitutive model un-der high pressure.
3. Validation of the Simulation Code
Through simulation of Barnes’s three experiments [1] [3] on an 1100-0 Al flat plate accelerated by a detonation product, we confirmed the simulating capability of the high-fidelity detonation and shock dynamics calculation program. In these experiments, the initial perturbations of the Al flat plate were 1) initial wave-length 5.08 cm and initial amplitude 0.02 cm, 2) initial wavewave-length 2.54 cm and initial amplitude 0.01 cm, and 3) initial wavelength 4.8 cm and initial amplitude 0.01 cm. They utilized a P80 detonation plane-wave lens to trigger a shock initia-tion on a 3.81-cm-thick PBX-9404, after which the detonainitia-tion products form an isentropic load for the Al plate through a vacuum gap 2.54 cm long. The para-meters of the PBX-9404 JWL EOS used in the simulation are given in Table 1. The 1100-0 Al Mie-Gruneisen EOS and Steinberg-Guinan constitutive model parameters are listed in Table 2 and Table 3.
DOI: 10.4236/wjm.2017.79021 260 World Journal of Mechanics
Table 1. PBX-9404 JWL EOS parameters.
0
ρ (g/cm3) A (Mbar) B (Mbar) 1
R R2 ω E0 (Mbar) Dcj (km/s)
[image:6.595.207.540.154.189.2]1.84 8.524 0.1802 4.6 1.3 0.38 0.102 8.8
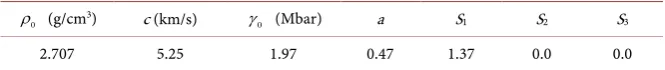
Table 2. 1100-0 Al Mie-Gruneisen EOS parameters.
0
ρ (g/cm3) c (km/s) 0
γ (Mbar) a S1 S2 S3
[image:6.595.208.540.220.518.2]2.707 5.25 1.97 0.47 1.37 0.0 0.0
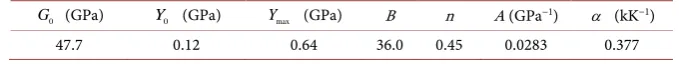
Table 3. 1100-0 Al Steinberg-Guinan constitutive model parameters.
0
G (GPa) Y0 (GPa) Ymax (GPa) B n A (GPa−1) α (kK−1)
27.1 0.04 0.48 400.0 0.27 0.0652 0.616
Figure 1. Experimental and numerical simulation amplitudes when the initial amplitude is 0.02 cm and the wavelength is 5.08 cm.
illu-DOI: 10.4236/wjm.2017.79021 261 World Journal of Mechanics strate the applicability of the constitutive model.
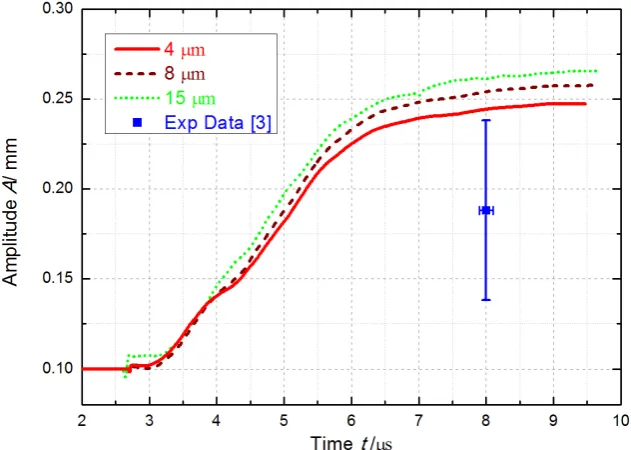
For the other two experiments, we conducted the simulation based on the ini-tial yield strength Y0 = 0.075 GPa of 1100-0 Al calibrated by using our program. In the simulation of the experiment (with wavelength 2.54 cm and amplitude 0.01 cm), three kinds of grid resolution were adopted: ∆x = ∆y = 4, 8, and 15 μm.
In Figure 2, simulation results are seen to agree well with experimental results
[image:7.595.226.521.203.422.2]and show grid convergence. The simulation results in Figure 3 (with wavelength 4.8 cm and amplitude 0.01 cm) indicate the obvious convergence trend.
Figure 2. Experimental and numerical simulation amplitudes when the initial amplitude is 0.01 cm and the wavelength is 2.54 cm.
[image:7.595.216.532.468.693.2]DOI: 10.4236/wjm.2017.79021 262 World Journal of Mechanics In summary, when the experimental conditions are P≈10 GPa and
5 1
10 s
ε≤ − , our calculation is in accordance with the experiment, and the grid
convergence is also in the same trend.
4. Results and Discussion
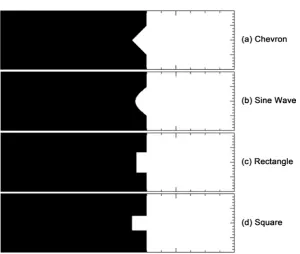
Figure 4 shows the four kinds of typical macro defect perturbations (chevron,
sine wave, rectangle, and square) on a Cu metal free surface under the reflected shock wave produced from copper impacting the left solid wall at a high speed of 2.5 km/s. When the reflected shock waves reach the free surface, the reflected rarefaction wave in the material leads to the acceleration of the interface par-ticles, as well as to tensile and unloading effects. At the same time, various tensile failures in the material are also under complex and interacting influences of the solid wall’s reflected shock wave and rarefaction wave. Owing to the different in-itial perturbations on the interface, ∇ ×∇ ≠p ρ 0 results in the interface
insta-bility, fragmentation, and jetting. Numerical simulations are used to analyze quantitatively the difference in interface instability for four typical macro defects and to study the various distributing features of fragmentation and ejecta inside the material and around the interface. In our simulations, the Cu EOS and con-stitutive model parameters are given in Table 4 and Table 5.
Configuration of the calculation modes are shown in Figure 4; the computa-tional domain is [0 cm, 8 cm] × [−1 cm, 1 cm], the length of Cu is 5 cm, and the boundary conditions on the left, top, and bottom edges are all the solid walls. The positions of the four defects (chevron, sine wave, rectangle, and square) are located at the center of the free surface, with the same area of 0.25 cm2, and the Cu mass of defect unit thickness is 2.1 g. For the chevron, the defect shape is an isosceles right-angled triangle with a 1-cm-long bottom edge. The sine wave am-plitude and wavelength are 0.3927 and 2 cm, respectively. Additionally, the length and width of the rectangle are 0.7071 and 0.35355 cm, and the length of the square is 0.5 cm.
To verify grid convergence, we take the chevron model as an example and se-lect two different sizes (25 and 12.5 µm). Figure 5(a) and Figure 5(b) demon-strate the grid convergence of the velocity history of the interface vertex and the velocity distribution on the symmetrical axis at t = 13.5 µs. For the coarse and fine grids, the peak velocities are 6.32 and 6.28 km/s, the starting times of the vertex are 5.845 and 5.854 µs, and the relative errors satisfying the convergence
Table 4. Cu Mie-Gruneisen EOS parameters.
0
ρ (g/cm3) c (km/s) 0
γ (Mbar) a S1 S2 S3
[image:8.595.202.542.693.728.2]8.93 3.94 1.99 0.47 1.489 0.0 0.0
Table 5. Cu Steinberg-Guinan constitutive model parameters.
0
G (GPa) Y0 (GPa) Ymax (GPa) B n A (GPa−1) α (kK−1)
DOI: 10.4236/wjm.2017.79021 263 World Journal of Mechanics
Figure 4. Four typical initial macro defects (chevron, sine wave, rectangle, and square) on the Cu free surface.
(a) (b)
Figure 5. (a) Vertex velocity history of the chevron interface; (b) velocity distribution on the asymmetrical axis at t = 13.5 µs. condition are 0.64% and 0.15%, respectively. In Figure 5(b), it is obvious that the velocity distributions in the calculation area mostly satisfy the convergence condition, whereas the calculations of the quantity in the fragmentation area on the 4 to 5 cm horizontal axis display significant differences.
[image:9.595.74.539.357.543.2]DOI: 10.4236/wjm.2017.79021 264 World Journal of Mechanics
Figure 6. (Left) velocity distribution on the symmetrical axis of the chevron interface and (Right) density contour for a domain of [3 cm, 8 cm] × [−1 cm, 1 cm] at t = 13.5 µs.
large fragments is almost the same in the two different grids, and that of the smallest fragment even reaches one grid size, so the size of the smallest fragment is linked to the computational grid. The right panel of Figure 6, in contrast, shows the allelic distributions of the density in the coarse and fine grids at t = 13.5 µs, so the ejecta mass can be calculated (with the length of the horizontal axis exceeding 5.4 cm). Specifically, the ejecta masses are 0.799 and 0.737 g, re-spectively, and the difference is about 8.41%, suggesting that the ejecta mass is also closely linked to the computational grid.
The above findings reveal that the numerical calculations of the fragmentation are related to the size of the calculation grid. To eliminate the influence of the grid’s mesh, we chose the same grid size, 12.5 µm in length, in the four models. Thus, the Euler mesh encompasses 12,800,000 points in the whole computation-al domain [0 cm, 10 cm] × [−1 cm, 1 cm].
To compare the various characteristics of the interface instability, fragmenta-tion, and ejecta under the influence of the four typical defects, Figure 7 shows the material distribution at two moments (t = 10.5 and 13.5 µs), where the che-vron ejecta shape is a nonuniform pole with a sharp-pointed nose. For the sine wave, the ejecta is also a nonuniform pole but with a mushroom head. The common characteristic in the former conditions is that hardly any distinct par-ticle jet can be found. For the rectangle and square defects, the shared characte-ristic is that high-speed particles concentrate on the symmetrical axis of the ejecta head while they differ in that the rectangle has a conical hole shape in the front and the square is shaped like a large-size arc.
Table 6 lists the ejecta mass of the four defects when t = 10.5 and 13.5 µs. At
DOI: 10.4236/wjm.2017.79021 265 World Journal of Mechanics
[image:11.595.209.540.61.317.2]Figure 7. Calculated configurations of free surface instability, fragmentation, and the ejecta for the four defects at t = 10.5 and 13.5 µs: (a) chevron; (b) sine wave; (c) rectangle; and (d) square. The domain is [3 cm, 8 cm] × [−1 cm, 1 cm].
Table 6. Jet mass under the four defects at 10.5 and 13.5 µs.
Time (µs) Ejecta mass (g)
Chevron Sine wave Rectangle Square
10.5 0.533 0.581 0.662 0.586
13.5 0.737 0.803 0.848 0.712
0.803, 0.848, and 0.712 g, respectively. In summary, although all the ejecta masses increase with time, it is obvious that the law of ejecta mass and growth varies according to the kind of typical macro defect perturbation. The left panel
of Figure 7 illustrates that the distributions of the fragmentation area near the
interface located on both sides of the ejecta are basically the same, both being caused by the unloading of the free surface. Nevertheless, the interactions of the stretch formed from the meeting of the unloading wave in the material and the reflected wave from the solid wall leads to a totally different fragmentation area at t = 13.5 µs. For the chevron and sine wave, the fractured zones behind the metal main body are much larger than those from the other defects, which are less obvious.
For further analyze of the velocity and spatial distributions of the jet particles,
Figure 8 and Figure 9 show the velocity distribution and density distribution
[image:11.595.208.540.391.456.2]DOI: 10.4236/wjm.2017.79021 266 World Journal of Mechanics (a) (b)
[image:12.595.56.541.65.473.2](c) (d)
Figure 8. Velocity distributions on the asymmetrical axis for the four defects at t = 13.5 µs: (a) chevron; (b) sine wave; (c) rectan-gle; and (d) square.
DOI: 10.4236/wjm.2017.79021 267 World Journal of Mechanics (a) (b)
[image:13.595.59.542.60.454.2](c) (d)
Figure 9. Density distributions around the ejecta head on the asymmetrical axis in the four cases at t = 13.5 µs: (a) chevron; (b) sine wave; (c) rectangle; and (d) square.
and 8.16 - 8.27 cm. For the square, the particle distribution domains are 7.61 - 8.30, 8.92 - 9.19, 9.33 - 9.44, and 9.59 - 9.82 cm, so the conclusion may be drawn that the square undergoes more serious fragmentation than the rectangle. On a macro level, both ejecta heads of the square and rectangle are in a high-speed, low-density area in the particle state. At the same time, the fragmentations and the distribution are closely connected with the initial defect shape. To further understand the particles’ thermodynamic state, Figure 10 shows the pressure and temperature distributions of the particles around the ejecta head. From Figure 10 we see that the pressure of the particles under the rectangle and square condi-tions is almost zero. The particle temperature has reached 1350 - 1700 K, and at some points it even climbs to Cu’s melting temperature (~1400 K).
5. Conclusions
DOI: 10.4236/wjm.2017.79021 268 World Journal of Mechanics (a) (b)
Figure 10. Pressure (a) and temperature (b) distributions around the ejecta head on the asymmetry axis at t = 13.5 µs.
mainly focuses on the interface instability, fragmentation, and jetting under a re-flected shock wave. Through numerical simulation, we quantitatively compared the different defects and concluded that the interface instability, fragmentation, and ejecta all originate from the initial interface defect and are also associated closely with the shape of the defect. According to the above findings, in the che-vron and sine wave cases, the ejecta mass velocities of the head are 6.28 and 5.88 km/s, respectively. Some parts of the inner material are found in a tensile state without any fragmentation, which appears only in the main body of the metal owing to the tension effect. Additionally, for the other two initial perturbations (rectangle and square), the highest ejecta mass velocities are 9.14 and 9.59 km/s, respectively. Fragmentation appears in the large range of shaped pole owing to the multilayer spallation. There is a granule area with high-speed and low-density in the ejecta head. However, the degree of fragmentation is much lower in the main body of Cu. Overall, the jet masses under the four defect conditions vary greatly. Moreover, their time-dependent eject mass follow different law.
DOI: 10.4236/wjm.2017.79021 269 World Journal of Mechanics
Acknowledgements
The authors would like to thank the supported by “Science Challenge Project” (No. TZ2016001), the National Natural Science Foundation of China (Nos. 11372294 and 11532012), and the Foundation of National Key Laboratory of Shock Wave and Detonation Physics (No. 9140C670301150C67290).
References
[1] Barnes, J.F., Blewett, P.J., McQueen, R.G., Meyer, K.A. and Venable, D. (1974) Tay-lor Instability in Solids. Journal of Applied Physics, 45, 727-732.
https://doi.org/10.1063/1.1663310
[2] Drucker, D.C. (1980) Taylor Instability of the Surface of an Elastic-Plastic Plate.
Mechanics Today, 5, 37-47. https://doi.org/10.1016/B978-0-08-024249-1.50013-3
[3] Barnes, J.F., Janney, D.H. and London, R.K., et al. (1980) Further Experimentation on Taylor Instability in Solids. Journal of Applied Physics, 51, 4678-4679.
https://doi.org/10.1063/1.328339
[4] Lindquist, M.J., Cavallo, R.M., Lorenz, K.T., et al. (2006) Aluminum Rayleigh Tay-lor Strength Measurements and Calculations. Paper Presented at the Tenth Interna-tional Workshop on the Physics of Compressible Turbulent Mixing, Paris, France. [5] Weber, S.V., Kalantar, D.H., Colvin, J.D., et al. (1999) Nova Experiments
Ex-amining Rayleigh-Taylor Instability in Materials with Strength (Report No. UCRL-JC-132739). 7th International Workshop on the Physics of Compressible Turbulent Mixing Russian Federal Nuclear Center-Institute of Experimental
Physics, St. Petersburg, 6 October 1999.
[6] Edwards, J., Lorenz, K.T., Remington, B.A., et al. (2004) Laser-Driven Plasma Loader for Shockless Compression and Acceleration of Samples in the Solid State.
Physical Review Letters, 92, Article ID: 075002.
https://doi.org/10.1103/PhysRevLett.92.075002
[7] Lorenz, K.T., Edwards, M.J., Glendinning, S.G., et al. (2005) Accessing Ultra-high-Pressure, Quasi-Isentropic States of Matter. Physics of Plasmas, 12, Article ID: 056309. https://doi.org/10.1063/1.1873812
[8] Lorenz, K.T., Edwards, M.J., Jankowski, A.F., et al. (2006) High Pressure, Quasi Isentropic Compression Experiments on the Omega Laser. High Energy Density
Physics, 2, 113-125. https://doi.org/10.1016/j.hedp.2006.08.001
[9] Park, H.-S., Remington, B.A., Becker R.C., et al. (2010) Strong Stabilization of the Rayleigh-Taylor Instability by Material Strength at Megabar Pressures. Physics of
Plasmas, 17, Article ID: 056314. https://doi.org/10.1063/1.3363170
[10] Smalyuk, V.A., Casey, D.T., Clark, D.S., et al. (2014) First Measurements of Hydro- Dynamic Instability Growth in Indirectly Driven Implosions at Ignition-Relevant Conditions on the National Ignition Facility. Physical Review Letters, 112, Article ID: 185003.
[11] Aprelkov, O.N., Ignatova, O.N., Igonin, V.V., et al. (2007) Twinning and Dynamic Strength of Copper during High Rate Strain. AIP Conference Proceedings, 955, 619-622.
[12] Atchison, W.L., Zocher, M.A. and Kaul, A.M. (2008) Studies of Material Constitu-tive Behavior Using Perturbation Growth in Explosive and Magnetically Driven Liner Systems. Russian Journal of Physical Chemistry B, 2, 387-401.
DOI: 10.4236/wjm.2017.79021 270 World Journal of Mechanics [13] Igonin, V.V., Ignatova, O.N., Lebedev, A.I., et al. (2009) Influence of Dynamic
Properties on Perturbation Growth in Tantalum. AIP Conference Proceedings, 1195, 1085-1088.https://doi.org/10.1063/1.3294990
[14] Chen, H.Y., Zeng, J.R., Wang, S.J., et al. (1997) Experimental Study of Interface In-stability in Cylindrical Convergent Geometry. Detonation and Shock Waves, 1, 1-4. [15] Lin, Q.W., Xia, X.G. and Zhang, G.R. (1997) Theoretical Calculation of Interface
Instability under Cylindrical Convergent Shock Wave. Detonation and Shock
Waves, 4, 33-36.
[16] Wang, T., Bai, J.S., Cao, R.Y., et al. (2017) Experimental and Numerical Investiga-tions of Perturbation Growth in Aluminium Flyer Driven by Explosion. Manuscript Submitted for Publication.
[17] Meyer, K.A. and Blewett, P.J. (1971) Some Preliminary Numerical Studies of Taylor instability which Include Effects of Material Strength. Report No. LA-4754-MS UC-34.
[18] He, C.J., Zhou, H.B. and Hang, Y.H. (2009) Numerical Analysis of Metal Interface Instability of Aluminum Driven by Detonation. Science in China Series G: Physics,
Mechanics & Astronomy, 39, 1170-1173.
[19] Bai, J.S., Liu, J.H., Wang, T., et al. (2010) Investigation of the Richtmyer-Meshkov Instability with Double Perturbation Interface in Nonuniform Flows. Physical
Re-view E, 81, Article ID: 056302.https://doi.org/10.1103/PhysRevE.81.056302
[20] Bai, J.S., Zou, L.Y., Wang, T., et al. (2010) Experimental and Numerical Study of the Shock-Accelerated Elliptic Heavy Gas Cylinders. Physical Review E, 82, Article ID: 056318.https://doi.org/10.1103/PhysRevE.82.056318
[21] Bai, J.S., Wang, B., Wang, T., et al. (2012) Numerical Simulation of the Rich-tmyer-Meshkov Instability in Initially Nonuniform Flows and Mixing with Re-shock. Physical Review E, 86, Article ID: 066319.
https://doi.org/10.1103/PhysRevE.86.066319
[22] Steinberg, D.J., Cochran, S.G. and Guinan, M.W. (1980) A Constitutive Model for Metals for Applicable at High-Strain Rate. Journal of Applied Physics, 51, 1498-1504.https://doi.org/10.1063/1.327799
Submit or recommend next manuscript to SCIRP and we will provide best service for you:
Accepting pre-submission inquiries through Email, Facebook, LinkedIn, Twitter, etc. A wide selection of journals (inclusive of 9 subjects, more than 200 journals)
Providing 24-hour high-quality service User-friendly online submission system Fair and swift peer-review system
Efficient typesetting and proofreading procedure
Display of the result of downloads and visits, as well as the number of cited articles Maximum dissemination of your research work
Submit your manuscript at: http://papersubmission.scirp.org/