http://dx.doi.org/10.4236/jbise.2012.512A101 Published Online December 2012 (http://www.SciRP.org/journal/jbise/)
Framework for development of three-dimensional digital
atlas of human anatomy
Deisy Brigid De Zorzi Dalke1, Neysa Aparecida Tinoco Regattieri1, Leyza Elmeri Baldo Dorini2, Lucas Ortolan2, Pedro Alberto Borba2, Marilia Abrahão Amaral2
1
Department of Physics, Federal University of Technology of Paraná (UTFPR), Curitiba, Brazil
2
Department of Informatic, Federal University of Technology of Paraná (UTFPR), Curitiba, Brazil Email: [email protected]
Received 15 October 2012; revised 20 November 2012; accepted 29 November 2012
ABSTRACT
Objectives: The overall aim is to propose a general framework to build any kind of interactive digital atlas. It can be used either as pedagogical support to study human anatomy or as a tool to aid health pro- fessionals improving the quality of the human re-sources formation. Methods: To illustrate the use of the proposed methodology was build an atlas of in- tracranial human anatomy. We used 3D surface ren- dering techniques to create a brain atlas that would allow us to correlate bi-dimensional MRI images with 3D brain structures. Results: The system was coded in Java and distributed under GNU/GLP license, ma- king it available to use and/or to expand and serve as an educational tool allow medical students to use it to evaluate the special relationships among structures. Conclusions: The characteristics of the obtained Atlas are essential in the Brazilian public health context, where professionals in several different geographical locations (submitted to distinct informatics infra-structure) need to be trained.
Keywords:Brain Atlas; Magnetic Resonance Imaging
(MRI); 3D Visualization
1. INTRODUCTION
Usually, it is a critical process to train new professionals in human anatomy. In this context, due to the lack of cadavers or even to the wear of synthetic anatomical parts, textual and/or visual information about the human body structures are searched in anatomy atlas, which can have specific information about organs and systems or about the whole body.
The most widely used atlases in the medical area are printed, such as the Sobotta [1], which have illustrations of the anatomical structures, and the Yokochi [2], that presents different photographies of cadavers. However,
in order to visualize and understand the structures in different angles, it is usually necessary to leaf through the pages several times. This is not convenient and can be time consuming or even confusing.
There are also other limitations that can influence the learning process, including the lack of regularity when exploring specific information and the inflexible presen- tation that does not take into account the fact that each person has a different speed of learning [3]. Variations on the color, size and luminosity affect the visualization, making it hard to show the shapes and anatomical rela- tions with the same characteristics present in dissections, for example. In photographic atlases, despite of the grea- ter precision of the images, are necessary several of them to show all the structures of an organ [3]. Also, some- times it is not trivial to understand the relationships be- tween different views of a same structure.
The increasing of the computational power of the mo- dern personal computers and the arising of sophisticated graphical tools stimulate the development of digital atla- ses. Besides lower cost and greater portability, these at- lases provide a large number of interactive visual res- ources to the user. Thus, students and professionals of different areas have increasingly used them.
The development of programs that create models of anatomical structures, as well as simulations under nor- mal and pathological conditions, allows the visualization on two and three dimensions, including animations of the organ’s functionalities [4]. This results on a more intui- tive interface, allowing the application of resources such as the visualization of different layers of the structure under study. In general, these atlases do not present ste- reoscopy resources, typically embed in commercial sys- tems.
tools related to digital atlases. However, approaches dis- tributed free of charge or open source programming codes are not common.
In this sense, the main contribution of this work is related to the idealization and implementation of a me- thodology to develop interactive digital atlases of human anatomy.
Here, we present a conceptual description of the pro- posed approach. To illustrate its use, we create a digital atlas of the intracranial human anatomy (due to the great importance of the study of this region). This prototype was developed in Java and is a public available open source implementation.
2. MATERIALS AND METHODS
2.1. Atlas Construction
Due to the advantages when compared to the traditional printed atlases, several digital atlases have been proposed, including commercially distributed Homem Virtual [5], ADAM Interactive Anatomy [6], Anatomy.tv [7] and Human Anatomy Online [8] Digital Anatomist Infor- mation System [9], Visible Human Project [10]. Several groups have been working to generate digital 3D atlas data sets of the human brain for very different appli- cations. For example, Hoehne and coworkers [11], Pom- mert et al. [12], Tiede et al. [13] in Hamburg, Germany, have pioneered the development of a brain atlas for tea- ching neuroanatomy [14].
After an analysis of the existent digital atlas and of the most common needs of potential userswe conclude that the essential characteristics are: visualization of the whole anatomical structure, selection of an interest region, pre- sentation of textual information about the selected region and three dimensional visualization.
2.2. MR Imaging
The MR images were acquired on a 1,5-tesla Philips Achieva (Philips Medical Systems, Best, The Nether- lands). Scans were performed with a 4 mm slice thick- ness, no slice gap, 38 slices, covering the entire brain, a 230 × 230 mm field-of-view and a 256 × 256 scan matrix, in T1-weight due to the high accuracy of this method that provide excellent anatomical details. The patient was part of a normal control group, and had authorized the public distribution of your brain images.
2.3. Image Preprocessing
Using Osirix software the gray levels of the images are modified to improve its contrast, thus facilitating the diagnosis and was made the conversion of the DICOM format to JPEG to facilitate the segmentation process.
2.4. Manual Segmentation
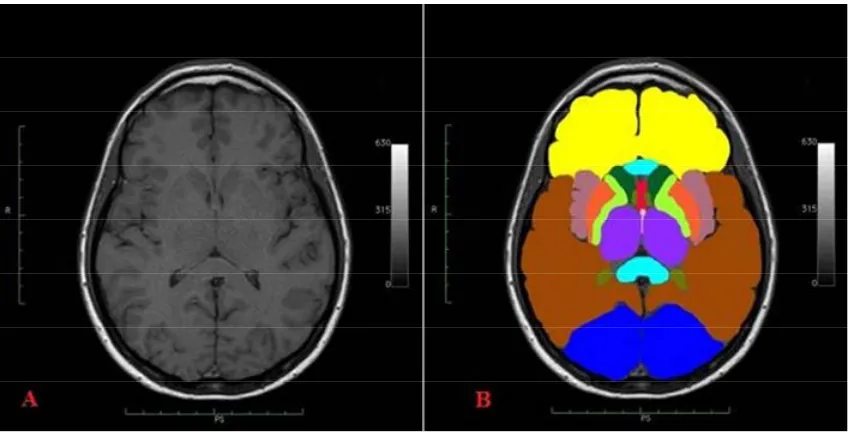
For each slice, the interest structures are painted with a solid color. These segmented images result in pixel val- ues that are unique for each identified structure [15]. These images will not be visible in the system; it is only used to identify the region selected with the mouse (based on the coordinates of the click. Figure 1 illustrates an example, but note that the user will only see Figure 1(A).
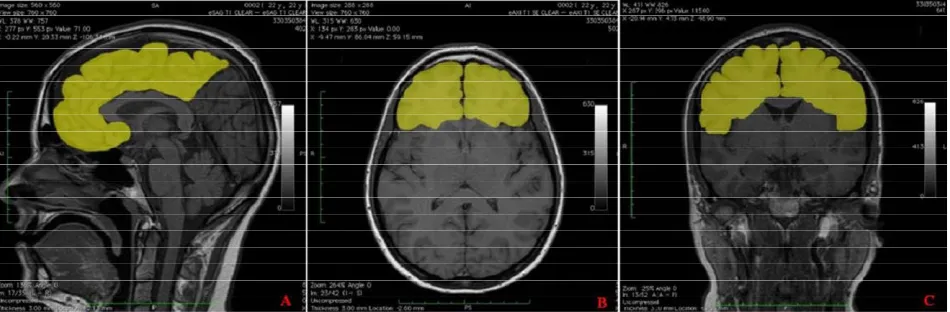
[image:2.595.86.510.504.720.2]When the user selects the interest structure, the system shows the sagittal, axial and coronal views with the inter- est region emphasized. Thus, it is necessary that each single structure be colored with transparent colors, show- ing the structure without obscuring the parenchyma (Fig- ure 2).
Figure 2. Segmentation of each anatomical structure in sagittal (A) Axial (B) and Coronal (C) MR images.
2.5. 3D-Brain
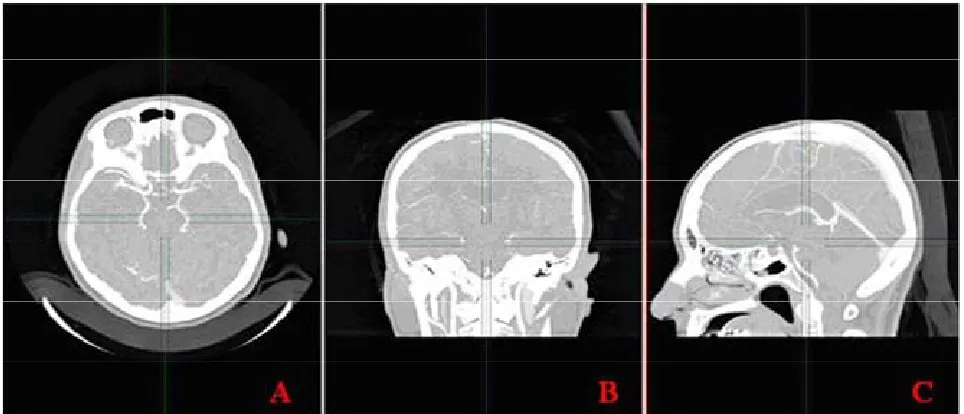
To create the three-dimensional model were used CTA images due to facility to identify the edges of the brain taking in account the vascular supply. Images were ob- tained from computed tomography with 64-channel multi- detector (Toshiba Aquilion), with thicknesses between 0.5 and 0.6 mm (Figure 3).
The procedures was made in OsiriX software and basically consist in build a three-dimensional model in Maximal Intensity Projection (MIP) and then remove skin and the bone making the brain becomes the structure with higher pixel value (Figure 4).
After this treatment was made another rebuilding in Surface rendering and the obtained file was exported like an object file (OBJ) (Figure 5). The OBJ was enhanced and segmented in Mesh Lab software. Each brain struc- ture receives the same pixel values that had in the bi- dimensional image and then was incorporated into the atlas (Figure 6).
2.6. Visualization of Three-Dimensional Models
The OBJ file exported from OsiriX has to be imported into the framework. This is accomplished using Java 3D, a complementary technology to Java, and also object- oriented and platform independent.
The procedure for loading an OBJ file for this project is rather simple: the file has to be parsed, centralized, divided into different meshes according to the color of its faces and rendered on the screen, where the user will be able to interact with it.
The parsing of the file is a process accomplished by a loader, which is a piece of code designed to read each part of the OBJ file and copy the data into the framework while sorting information regarding vertices, colors and faces.
Once this has been done, the three-dimensional model is translated so that its center coincides with the origin of the three-dimensional space. This is important because
viewing functionalities such as rotation and zooming occur regarding the origin of the space.
Next, there is the segmentation of the model based on its colors. Despite the fact that the brain has color- bounded regions, the polygon mesh is still a single structure. For purposes of interaction, it is desirable that the mesh be separated in accordance to the colored re- gions. To accomplish this, each face of the model has its color evaluated and then placed in the appropriate color group. The final result is a model with segmented me- shes reflecting the color grouping of its faces.
In accordance to the purpose of the framework, the three-dimensional model is capable of automatically changing its selected region to show the area being stud- ied. That is, emphasizing a structure in one of the two- dimensional images makes all other regions of the three- dimensional model acquire a transparency effect, thus, highlighting the selected structure.
3. RESULTS
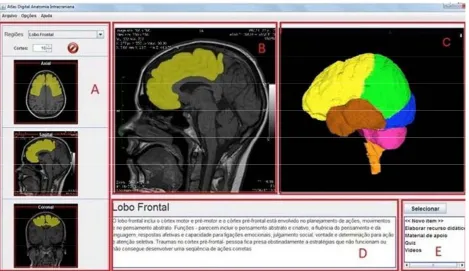
Layout of the Proposed Framework
The A contains a set of two-dimensional images, where the user can make the correlation between the sagittal, axial and coronal regions and choose a specific slice and structure with the mouse; B shows the image selected with the emphasized structure; C illustrates a three di- mensional model of the whole structure where the inter- est part is emphasized; D presents textual information about the interest structure previously selected. E con- sists of a set of applications that allows the user more interactivity, such as print material, watch related videos and answer questions relating to certain structures (Fig- ure 7).
Figure 3. Axial (A) Coronal (B) and sagittal (C) CTA images.
Figure 4. Remove the skin and bone for take just the brain.
Figure 5. Surface rendering.
images and text and construct its own atlas.
Since the code will be public available, we hope to encourage the exchange of knowledge, since it will be possible either to extended an existent atlas or to change details of the framework (to fit specific needs of an application), for example allow medical students to use it
Figure 6. Three-dimensional segmented brain.
to evaluate the spatial relationships among structures that can be better appreciated in 3D space where structures can be readily grouped and the student is able to view
[image:4.595.317.529.499.661.2] [image:4.595.62.282.502.638.2]Figure 7. Layout of the proposed framework.
4. DISCUSSION
The main contribution of this work is related to the idea- lization and implementation of a methodology for the development of interactive digital atlases of human ana- tomy. Besides a conceptual description, this methodol- ogy is presented as a framework, represented as a source code that can be used to support the development of ap- plications related to digital atlases.
In such a way, it is expected a positive impact on the human resources formation, conducing to a more dyna- mic learning process than that performed through textual elements. To illustrate this methodology, we developed a prototype of a digital atlas of the intracranial human anatomy. However, it is important to emphasize that it can be applied in several other contexts.
Since the implementation is computationally efficient, all the resources can be used in conventional computers without performance problems. This characteristics, com- bined with the fact that it is free to use and use public domain tools, enables a greater number of people can ac- cess the system for use and/or expansion.
REFERENCES
[1] Putz,R. and Pabst, R. (2006) Sobotta: Atlas of human an- atomy. Guanabara Koogan, Rio de Janeiro.
[2] Yokochi, C., Rohen, J.W. and Lutjen-Drecoll, E. (2002) Color atlas of anatomy: A photographic study of the hu-man body. 5th Edition, Lippincott Williams & Wilkins,
Philadelphia.
[3] Tardif, M. and Raymond, D. (2000). Saberes, tempo e aprendizagem do trabalho no magistério. Educacão & So-
ciedade, 73, 209-244.
[4] Cunha, I.L.L., Monteiro, B.S., Moraes, R.M. and Ma- chado, L.S. (2006) AnatomI 3D: Um atlas digital baseado em realidade virtual para ensino de medicina. Proceed-
ings of Symposium on Virtual Reality (SVR’2006),Belém,
3-14.
[5] Chao, L.W. and Bohm, G.M. (2003) Homem virtual. http://www.projetohomemvirtual.com.br
[6] Techno Softwares (2004) A.D.A.M. Interactive Atlas. CD-ROM.
[7] Primal Pictures (2001) Anatomy.tv. http://www.anatomy.tv/default.aspx [8] Innerbody (2003) Human anatomy.
http://www.innerbody.com/htm/body.html.
[9] SIG (1999) The digital anatomist information system, University of Washington, Structural Informatics Group. http://www.sig.biostr.washington.edu/projects/da/
[10] Kriete, A., Berger, L.C., Stallkamp, J., Wapler, M. et al. (1999) An interactive, functional Atlas of Human Anat- omy: Principles for modelling and simulation. In: Simula- tion and Visualization, SCS-Verlag, Magdeburg, 215-224.
[11] Höhne, K.H., et al. (1992) A 3D anatomical atlas based on a volume model. IEEE Computer Graphics and Ap- plications, 12, 72-78.
[13] Tiede, U., Bomans, M., Hohne, K.H., et al. (1993) A computerized three-dimensional atlas of the human skull and brain. American Journal of Neuroradiology, 14, 551- 559
[14] Kikinis, R., Shenton, M.E., Iosifescu D.V., et al. (1996) A digital brain atlas for surgical planning, model driven segmentation, and teaching. IEEE Transactions on
Visu-alization and Computer Graphics, 2, 232-241.
doi:10.1109/2945.537306