Munich Personal RePEc Archive
How peaceful is the harmony of source
and sink?
Friedrich, Thomas
Humboldt-Universität zu Berlin
30 October 2019
How peaceful is the harmony of source and sink?
T. Friedrich
The transfer space of a source and a sink is divided into 4 areas by two internal limits. These limits are benefit minus cost equals zero (b-c=0) in source and in sink. In area I source is cost dominated (bso-cso<0) and sink
is benefit dominated (bsi-csi>0) and thus I consider this to be in principle a
peaceful and harmonic area as a transfer is a win-win situation. In this investigation I observe very small transfers in area I and their changing distance to the limits b-c=0. When a series of consecutive small transfers in area I approaches the limit by decreasing substrate concentration in source and increasing substrate concentration in sink, the gain in superadditivity will become gradually smaller although the transfer size is constant. A master interested in constant superadditive net profit and unaware of the non-linear nature of the transfer space will interpret this as resistance of source and/or sink. He may use a counter force to increase again the output of superadditive net profit. Therefore, force and deception may appear already in the peaceful area of the transfer space with a basically peaceful master. A similar scenario develops with repeated transfers at a single concentration pair far away from the limits b-c=0 in a quickly regenerating ensemble where the concentrations in source and sink remain constant. Here, the limits b-c=0 either in source or in sink are set to change and approach the concentration where the transfer happens. The result is also a decrease in superadditivity which will again be felt only by the master interested in superadditive net profit. In symmetric ensembles area II and III are still superadditive next to area I. Real force and counterforce are necessary there. But this will not be felt as a sharp change as the transition and habituation begins already in area I.
Introduction
According to the details of the transfer space and some of its features the reader is referred to my older work (1, 2). The transfer space is a three-dimensional model to understand the impact of substrate transfers on the efficiency of an ensemble of a source and a sink. The coordinates of the three-dimensional space are substrate concentration of source, substrate concentration of sink and net profit of both. Source and sink are viewed as a unity and the balance sheet is create over the ensemble of both. The transfer within an ensemble is controlled by the law of conservation of mass. The substrate has simultaneously a benefit (b) and a cost (c) aspect for source and sink but not necessarily to the same degree and always depending on the already present substrate concentration. As b follows a saturating function and c follows a linear function there is an interception where b-c=0 in source and b-c=0 in sink. This divides the transfer space into 4 areas. In area I source is cost dominated and sink is in benefit dominated. Therefore, it is expected that a transfer is performed peacefully and honest as it is to the advantage of both sides. In perfect harmony source gets rid of a big cost for the price of a small loss in benefit and sink gains a big benefit for the price of a small gain in cost.
In the past I investigated how my model behaves when a single transfer is used to reach e.g. b-c=0 or what happens when source and sink are forced or deceived to go beyond that rational limit to a different new limit in a single step.
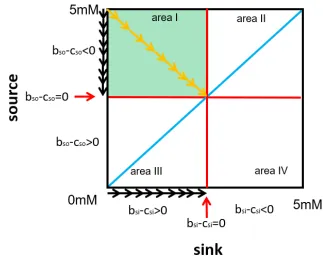
[image:4.595.132.455.283.543.2]Now I want to examine what happens when many very small transfers approach the limit b-c=0 (figure 1).
Figure 1
Figure 1
Here a movement of consecutive small transfers (0.001mM) through the concentration plane (0-5mM) of the transfer space is observed. We look top down at a transfer space. The dimension net profit of the ensemble points towards the observer. The green area is the peaceful area I where source is cost dominated (bso-cso<0) and the sink is benefit
dominated (bsi-csi>0). The substrate concentrations in source and sink range from 0mM
to 5mM. The example is a symmetric ensemble where area I is also completely superadditive. Km (0.5mM), Vmax (5µmol/min), cost factor (3/5 c/mM), benefit factor (1b*min/µmol) and all other features are identical in source and sink; only the substrate concentrations may differ.
Consecutive transfers approach the limit b-c=0 in source and sink simultaneously at the centre (bso-cso=bsi-csi=0). The substrate concentration in source is decreasing and
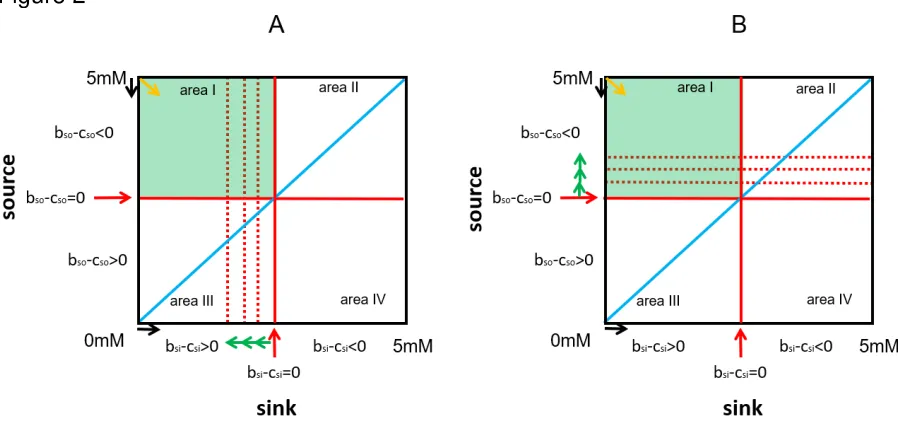
A second possibility (figure 2) to consider is a single stationary, repeated transfer in a fast regenerating ensemble with a moving limit b-c=0 by changing cf (cost factor) or Km or Vmax (to change bf is not considered as I make use of the benefit factor when complexity changes (2, 5). The values of cf, Km and Vmax are calculated to give 2448 equidistant steps where b-c=0. The limit b-c=0 starts at 2.5mM in source and sink and stays either at 2.5mM in source and moves to 0.002mM in sink (figure 2A) or moves to 4.998mM in source and stays at 2.5mM in sink (figure 2B).
Figure 2
Figure 2
The movement of the limit b-c=0 in source and in sink through the concentration plane of the transfer space is observed. The limit b-c=0 moves as the curvature of the space changes - or vice versa.
A single, small, stationary, and repeated transfer in a fast regenerating ensemble (no change of concentration) is observed (orange and black arrows). The transfer starts at 5mM in source and 0mM in sink. The transfer ends at 4.999mM in source and 0.001mM in sink in every cycle (step). Again, the system obeys the law of conservation of mass. In A the repeated transfer is stepwise (2448 steps) approached by the limit bsi-csi=0
between area II and area I (green arrows).
In B the repeated transfer is stepwise (2448 steps) approached by the limit bso-cso=0
between area III and area I (green arrows).
As the ensembles become increasingly asymmetric, besides superadditivity also subadditivity will appear in area I.
In my older work force and deception are used by source, sink or a master to move a party beyond the limit b-c=0 into area II, III, and IV. Here, I investigate whether force and deception are completely absent from area I in a conditionally violent master who - in area I - should basically only act as an honest broker.
Two subtypes of masters will be observed. The quantity type lives on transfer fees; he keeps the step size constant (orange curves). He does not care about the result. He may observe the resulting superadditive net profit but he is living on transfer fees which are independent from superadditivity. His aim is to keep the transfer fees constant. He is a conditionally violent master (3, 4) who is an honest broker in area I bringing source and sink together.
The quality type measures the superadditive net profit and he is living on this result. His aim is to keep the superadditive output at least constant. This master is basically also a conditionally violent master who is an honest broker in area I. But he will judge the performance of a transfer of substrate within the ensemble he controls according to the resulting superadditive net profit. In case this results changes, he will become active. The first transfer step within area I will serve this master as a bench mark with which he will compare all following results in superadditive net profit of his symmetric ensemble.
substrate concentration; b and c are always of the same dimension (kJ, or $ or €).
b = V * bf (V=([S]/([S]+Km) * Vmax)
V is the reaction velocity (catalytic activity) in µmol/min, Vmax is the maximal reaction velocity (5µmol/min); Km, Michaelis-Menten constant in mM (0.5mM); [S] substrate concentration in mM (0 to 5mM); bf, benefit factor = 1bf; the benefit factor is usually 1b*min/µmol and he is also a complexity factor (2). It is the duration of a benefit per amount of the substrate. The benefit factor serves to introduce the unit b as a placeholder for kilojoule or $ or €.
c = [S] * cf
The substrate concentration [S] is 0 to 5mM. The cost factor cf (c/mM) gives the cost of the substrate (c=5/3). The cost factor is used to introduce the unit c as a placeholder for kilojoule or $ or €.
In some calculations the values given above are constant in some other calculations these values are only the starting point and then they are systematically changed to move the limits b-c=0 of source and sink. The dimension of the superadditive net profit (np) is the difference in net profit of the active minus the inactive ensemble. As the net profit comes from the difference of benefit and cost his dimension is kilojoule or $ or € as b and c are placeholders. In previous papers total superadditivity was calculated as a volume (np*mM2). This was the total available
Results
Repeated transfers in a not regenerating system:
I observe a changing position in a transfer space with a constant curvature of the transfer space (“movement in the space”). In a not regenerating system the substrate stock in source and sink will change. When source gives substrate to sink, the substrate amount in source will decrease and increase in sink by the same amount. As volumes in source and sink and all other conditions are equal in my considerations the concentration in source will decrease and increase in sink by the same amount. The total amount of substrate within the ensemble stays constant according to the law of conservation of mass.
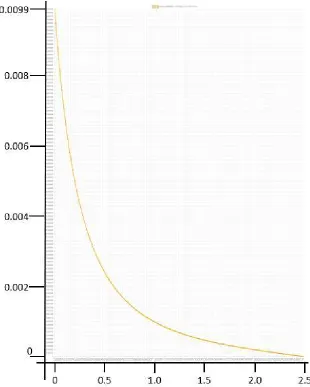
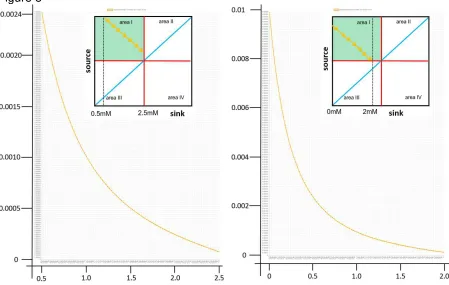
In figure 3 we observe the superadditive net profit when consecutive small transfers (1µM each) from source (start at 5mM) to sink (start at 0mM, x-axis) approach the mixing concentration of 2.5mM in source and sink. This is a special case as the consecutive transfers approach the intersection of the limit b-c=0 in sink and the limit b-c=0 in source at 2.5mM; a unique point (figure 1, intersection of the red lines). The ensemble of figure 3 and figure 4 is symmetric (identical volumes, identical enzymes and conditions in source and sink). When the small steps approach the limit b-c=0 in source and sink, the point where bsi-csi and bso-cso simultaneously are zero,
the superadditive net profit becomes smaller and smaller (figure 3, orange curve). This dramatic decrease in superadditive net profit may be observed by the quantity type of a master but will not be a problem to him as he lives on constant transfer fees. The transfer size stays constant.
reason for the step size could also be a restriction of the connection between source and sink but here the connection has no features. Here, the first step is a starting condition and as such becomes simply the benchmark for the system with respect to step size and result.
Figure 3
Figure 3
The size of superadditivity (y-axis, max. 0.00989734np) as function of 2500 equally sized (0.001mM), consecutive steps approaching b-c=0 in source and sink at 2.5mM (x-axis, mM substrate in sink). Source starts at 5mM and sink at 0mM substrate.
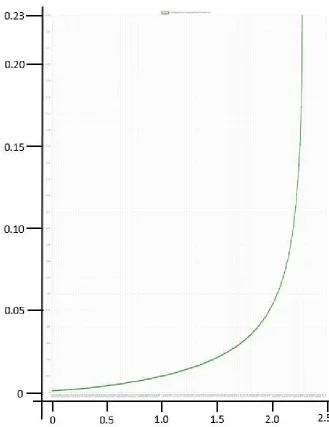
quality type, unaware of the non-linear nature of the transfer space and bound to the benchmark, may interpret this as unwillingness of the ensemble or as the action of a counterforce. However, it is only an apparent force due to a curved space. His countermeasure could be to increase the step size in a proportion so that the resulting superadditivity stays constant (figure 4).
Figure 4
Figure 4
In the beginning the increase in step size is very small and the necessary pressure by force or deception on source to give more and sink to take more will be comparable small. However, approaching the limits b-c=0 in source and sink the increase in step size is considerable. The last step with a size of 0.23mM is a factor of 230 times larger than the reference step. This last step does not reach the mixing concentration (2.5mM) and the transfer ends premature. The quality type of master will stop in area I while the quantity type will go to the mixing concentration and beyond into area IV where subadditivity waits (not shown).
The view from the far side: the increased step size to keep the initial superadditivity constant could be interpreted by the ensemble (source and sink) as impatience and coercion. Source and sink give and take at free will as they are still in area I, a peaceful and harmonic area of the transfer space – so why press and urge?
Both, the ensemble and the quality type master will have the impression that a force is acting. Either an apparent force seems to decrease superadditive net profit or real force and deception - in area I basically no force/deception is necessary - increase step-size. In physics an apparent force appears when a non-inertial frame of reference is used.
Now I want to observe a more general case where the consecutive transfers approach either the limit bsi-csi=0 or the limit bso-cso=0. The two
transfer paths will run parallel to the diagonal orange path in figure 1 and approach the border to area II or to area III.
the path and give the start and end concentration in sink. The substrate is again transferred in steps of 0.001mM and is 2mM (2000 steps) in total.
Figure 5
Figure 5
The size of superadditivity (y-axis, first step left 0.0024148428403742983np; first step
right 0.009880019916158833np) as function of equally sized (1µM), consecutive steps
approaching b-c=0 in source or sink (red lines). The x-axis is mM substrate in sink. Left: Source starts at 5mM and sink at 0.5mM substrate. Transfer ends when source is at 3mM and sink is at 2.5mM. The last step shown is still superadditive.
Right: Source starts at 4.5mM and sink at 0mM substrate. Transfer ends when source is at 2.5mM and sink is at 2.0mM. The last step shown is still superadditive.
path which is going to end at the border to area III (figure 5 right). The transfer space has a strong internal asymmetry – even in symmetric ensembles.
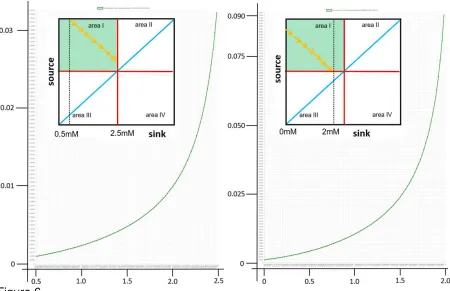
[image:13.595.74.524.354.645.2]In figure 6 we look at two masters of the quality type at the two starting conditions of figure 5. Their aim is a constant superadditivity. Therefore, they increase the step size. Again, the masters are unaware of the nonlinear nature of the transfer space. They attribute the decreasing superadditivity to friction or counter force. Therefore, they are using force or deception to increase the step size.
Figure 6
Figure 6
The step size (mM transfer, y-axis) as a function of the substrate concentration in sink (x-axis). The reference superadditivity (left: 0.0024148428403742983np; right:
0.009880019916158833np) of the first transfer (0.001mM) is kept constant. As there
The step size to reach the border b-c=0 between area I and area II is increasing by a factor of over 30 and the step size to reach the border b-c=0 between area I and area III is increasing by a factor of over 90.
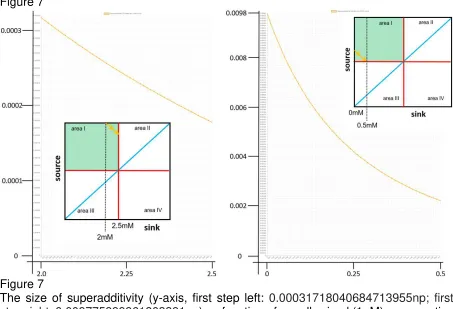
[image:14.595.71.524.342.651.2]Now I want to investigate the development of superadditivity and step size when the starting concentration in source or sink is near the limit b-c=0 but still within area I, far away from the orange, diagonal path of figure 1. In figure 7 we look at the development of superadditivity when 500 steps of 1µM are sufficient to reach the limit b-c=0 in sink (figure 7 left, border to area II) or the limit b-c=0 in source (figure 7 right, border to area III).
Figure 7
Figure 7
The size of superadditivity (y-axis, first step left: 0.00031718040684713955np; first
step right: 0.009775899961803391np) as function of equally sized (1µM), consecutive
steps approaching b-c=0 in source or sink (red lines). The x-axis is mM substrate in sink. The path of transfer is here much shorter, 500 steps in contrast to 2500 and 2000 in the previous figures.
Left: Source starts at 5mM and sink at 2mM substrate. Sink stops to take at 2.5mM. The last step shown is still superadditive.
Right: Source starts at 3mM and sink at 0mM substrate. Transfer ends when source is at 2.5mM and sink is at 0.5mM. The last step shown is still superadditive.
We observe still a considerable decrease in superadditivity along the short path in the peaceful area I. And, again, the effect for the path leading to the border between area I and area III is much stronger.
[image:15.595.72.522.252.569.2]The master interested in superadditive net profit has to increase the step size again to keep the superadditivity constant (Figure 8).
Figure 8
Figure 8
The step size (mM transfer, y-axis) as a function of the substrate concentration in sink (x-axis). The reference superadditivity (left: 0.00031718040684713955np; right:
0.009775899961803391np) of the first transfer (0.001mM) is kept constant. As there
is superadditivity beyond area I, the steps do not end premature unlike figure 4.
Repeated transfers in a fast regenerating system:
Now I observe a constant transfer-position within the transfer space while the curvature of the transfer space changes (“the space moves”). The starting points are comparable to figure 3 and 4. Benefit, cost and superadditivity are calculated as above.
However, this time the “first step” is repeated over and over again in a cycle. In every cycle (2498 cycles in total) 0.001mM substrate is transferred from source (5mM) to sink (0mM). Source immediately replenishes 0.001mM before the next cycle and starts again with 5mM. Sink immediately consumes 0.001mM substrate and discharges the product before the next cycle and starts again at 0mM substrate. The connection between source and sink does not show any time delay or viscosity.
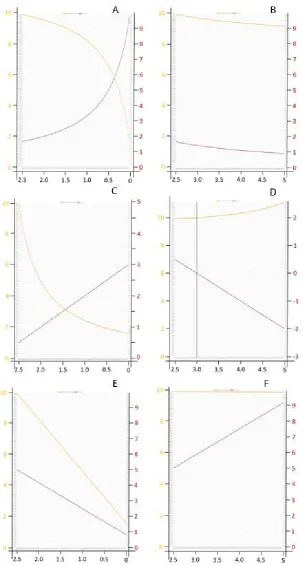
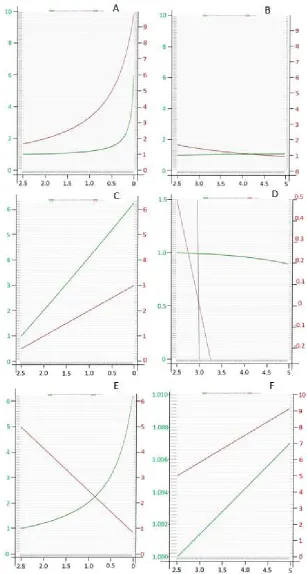
In every cycle the cost factor cf (figure 9A, B) or Km value (figure 9C, D) or Vmax value (figure 9E, F) will change a little bit so that the limit b-c=0 in sink or in source will slowly (2498 equal steps) approach the transfer concentration (figure 2A, limit shifts to the “left”; figure 2B limit shifts “upwards”). The quotation marks are used to indicate that we are basically looking top down onto the transfer space. The cycles end when either b-c=0 in sink is at 0.002mM or when b-b-c=0 in source will be at 4.998mM.
Figure 9
Figure 9
2498 cycle-steps shift the limit b-c=0 in sink from 2.5mM to 0.002mM (A, C, E) or in source from 2.5mM to 4.998mM (B, D, F) on the x-axis. The reference superadditivity of the first cycle at a step size of 0.001mM is 0.00989734np (A to F), left y-axis, orange curves (*10-3np). The red curves are the increasing (A) or decreasing (B) cost factor or
In every of the six case cases we start with the same symmetric ensemble which then becomes increasingly asymmetric. With one exception (decreasing Km in source) superadditivity will decrease. An increasing cost factor or an increasing Km value or a decreasing Vmax in sink have very profound effects on the superadditive net profit (9A, C, E) in comparison to a decreasing cost factor or a decreasing Km value or an increasing Vmax in source (9B, D, F). The transfer space has a strong internal asymmetry even in symmetric ensembles. Area II is cost dominated for both parties and the linear equation dominates. Area III is benefit dominated for both parties and the non-linear equation dominates. Small steps here result in large effects. When b-c=0 moves from 2.5mM to 0.002mM (9A, C, E) area I and III are compressed. When b-c=0 moves from 2.5mM to 4.998mM (9B, D, F) area I and II are compressed. The ensemble is very sensitive in the non-linear dominated area and insensitive in the linear dominated area.
A remarkable behaviour is observed with Km in source. (figure 9D). Only here superadditivity is increasing. The surprizing opposite result of a changing Km in source in comparison to cost and Vmax has already been observed and discussed (2; there figure 6 and explanation page 15). A decreasing Km like an increasing Vmax shift the interception with the linear cost to the right. This, however is only relevant at higher concentrations. A negative Km is not relevant to biochemistry.
Figure 10
Figure 10
2498 cycle-steps shift the limit b-c=0 in sink from 2.5mM to 0.002mM (A, C, E) or in source from 2.5mM to 4.998mM (B, D, F) on the x-axis. The reference superadditivity of the first cycle is 0. 00989734np and is kept constant by increasing the transfer size of 0.001mM (A to F), left y-axis (*10-3mM) and green curves. The red curves are the
When the limit b-c=0 is approaching the transfer concentration in source or sink, the master interested in superadditivity is going to increase his step size. This may be in a linear or exponential fashion with different steepness and dynamic. Again, the effect on the sink side is much stronger and more sensitive. Only in source with a changing Km we observe a decrease in step size to keep the superadditivity constant.
Figure 11
Figure 11
2500 cycle-steps shift the limit b-c=0 in sink from 2.5mM to 0mM (A, C, E) or in source from 2.5mM to 5mM (B, D, F); x-axis. The reference superadditivity of the first cycle at a step size of 0.001mM is 0.0004683985839037952np(A to F), orange curves, left y-axis (*10-3np). The red curves are the increasing (A) or decreasing (B) cost factor or
Figure 12
Figure 12
2500 cycle-steps shift the limit b-c=0 in sink from 2.5mM to 0mM (A, C, E) or in source from 2.5mM to 5mM (B, D, F); x-axis. The reference superadditivity of the first cycle (0.0004683985839037952np) is kept constant by increasing the initial transfer size of 0.001mM. Left y-axis and green curves A to F (*10-3mM). The red curves are the
Discussion
The transfer space is a model of a unidirectional substrate transfer from a first compartment (source) to a second compartment (sink) and the balance of both compartments viewed as a unity (ensemble). The compartments are filled with enzymes, buffer and substrate. But the model is valid also for other productive entities connected by transfers. The connection between the two compartments has no features and limitations. My past observations dealt with one step transfers to borders and limits. It became clear that there are steps which are performed at free will and to the advantage of both compartments and as a result deliver superadditivity in symmetric ensembles. Other steps must be enforced. They may deliver super- or subadditivity. Four areas were identified. In area I transfers were based on free will and the absence of force or deception. The transfers there were not always superadditive (asymmetric ensembles) but always rational for source or sink (get rid of cost dominated substrate, take benefit dominated substrate) and at free will without force or deception. This interpretation is now challenged.
Beyond the limit b-c=0 in source and sink, outside of area I, a master must use force and deception to make a source give a benefit dominated substrate or make a sink take a cost dominated substrate. Does force really start outside of area I? – and what is force?
In Newtonian physics force (f=m*a) is defined as the rate of change of a momentum (p). A momentum is the product of a mass and a velocity (p=m*v). As the mass stays constant, a force is active when the velocity or direction of the mass changes; the mass accelerates or deaccelerates (dv/dt=a) or changes direction. A velocity is the rate of change of a position as a function of time (∆x/∆t). Velocity is a vector quantity. The substrate has a mass m and is moved from source to sink at a velocity v under control of the law of conservation of mass. The connection between source and sink has no properties in my model. In case we assume a unitary velocity of 1(m/sec), the momentum of the substrate then is m*√2 (kg*m/sec). In this investigation I observe at first the superadditivity (np; colour code orange) and then the step size of substrate in mM (colour code green) to keep the initial superadditivity constant.
give the impression of the action of a force. Deception is a derivative of a physical force, a force exerted by intentionally wrong information.
Figure 13
Figure 13
Due to the non-linear nature of the transfer space (left, green curve for the active ensemble, red curve for the inactive ensemble in area I) equally sized, consecutive small steps (black arrows) will have reduced superadditivity (green arrows in np). The reduced (red arrow) superadditivity could be interpreted as an indicator for the action of a force on the momentum (orange arrows). However, there is no force acting on the momentum (right). Neither when substrate flows from A towards B nor when money flows from Btowards A. This illustration also helps to understand the effect when space changes curvature in situ.
Repeated transfers in a not regenerating system:
The two subtypes of masters strive for different aims. The quantity type wants at least constant transfers so that he can live on constant transfer fees; the quality type wants at least a constant superadditive net profit to live on. They both do not want less of their aims. They start with the first step and bring a cost dominated source and a benefit dominated sink together. That is what a good and honest broker does in area I. The result will be a certain amount of transfer fees and a certain amount of superadditive net profit. That feels good - the masters repeat their action. The next transfer step of identical size yields to the quantity type the same amount of transfer fees again but results in a reduced amount of superadditive net profit to the quality type. If both measure their income over time the quantity type will perceive a constant amount of transfer fees while the quality type finds a progressive reduction of superadditive net profit over time/step (figures 3, 5, 7).
If the quality type of a master considers the transferred amount of substrate as mass and he observes that the velocity of superadditivity production is decreasing he must conclude that the momentum is decreasing. The only reason for this observation can be the action of a force. However, this is an apparent (fictitious, pseudo, inertial) force as the transfer space is a non-linear, curved space and this master tries to go straight lines in expecting a constant amount of superadditivity. Therefore, to at least keep the output of superadditive net profit constant, he must increase the step size of the transfer (figure 4, 6, 8).
system becomes already in area I used to the action of force under the rule of the quality type of a master. In area I one side will always have the feeling that a force is active. Either the master detects a pseudo force or source and sink observe an urge to give more of what would be given anyway. The ensemble and the master become used to force.
[image:27.595.74.522.297.578.2]The quantity type of a master, in contrast, will start to use force and deception only at the limit b-c=0 outside of area I (red limit) and if he cares he can argue that there is still superadditivity (Figure 14).
Figure 14
Figure 14
The limit b-c=0, the starting point where force and counterforce are really necessary in area II, III, and IV, is no longer recognisable as a sharp border under the rule of the master interested in superadditivity. Now the blue line of mixing will appear to the quality type as a real border in symmetric ensembles. In vicinity to this line the superadditive net profit vanishes while step size dramatically increases (figure 15).
Figure 15
Figure 15
The step size (mM transfer, y-axis) as a function of the substrate concentration in sink (x-axis). The reference superadditivity (left: 0.00031718040684713955np; right: 0.009775899961803391np) of the first transfer (0.001mM) is kept constant. As superadditivity is present beyond area I the increasing steps do not stop at the red line. They approach the blue line of mixing (equal concentration in source and sink). The green line ends when the next larger step can´t produce constant superadditivity. The reason is that beyond the blue line subadditivity begins (blue circle, inset).
area I to force in area II or area III will be quite small and a change will be hard to detect. The change will be creeping and insidious for all parties; master, source and sink. The quality type of a master is lured into area II and area III. However, he will not enter area IV. This is reserved for the quantity type. The quality type does not even touch the limit of mixing and stops one incomplete step before. The approach to the blue line of mixing by the quality type needs much larger steps than the transgression of the limit b-c=0 and therefore a stronger force or deception. This became already obvious in the special case of figure 3 and 4.
There, the quantity type would go on immediately further into the completely subadditive area IV when he is at the point b-c=0 in source and sink (not shown) while the quality type of a master prematurely stopped in area I (figure 4). In that example the point b-c=0 for source and sink at 2.5mM is also on the line of mixing.
The interesting point is that a master of the quality type using force already in area I stands in strong, negative contrast to the master of the quantity type in the eyes of source and sink. As the quantity type is interested in transfer only to receive constant transfer fees he will not intervene at all in area I. He will appear as a nice guy in contrast to the urging quality type, who seems to be no longer of the conditional but of the unconditional violent and deceptive type.
However, the quality type with his early start of using force in area I is going to stop the transfer somewhere in area II or area III, maybe even in area I and taking care of the ensemble this way.
Repeated transfers in a fast regenerating system:
In all observed cases we have a symmetric ensemble as starting condition and observe an increasing asymmetry. The central question in this paper was whether there is force already in the peaceful area I. Figures 11, 12 and figures 14, 15 go beyond this question as the observations include area II and area III outside of area I. After a certain amount of cycles, the border b-c=0 in source or sink will pass the transfer concentration at 3.5mM in source or 1.5mM in sink under asymmetric conditions. When an increasing cost (figure 12A) moves the limit b-c=0 from 2.5mM to 0mM in sink, sink will experience a strong increase of the step size while still in area I. This increase might be felt by sink as an unreasonable demand.
Some additional thoughts:
The connection between source and sink is considered to have no properties. However, master, source and sink could also follow the interpretation that this connection shows frictional forces and has limitations. This idea is not investigated.
This investigation dealt with area I where giving a cost dominated substrate and taking a benefit dominated substrate is intentionally; no force or deception is necessary. My interpretation is that the decrease in superadditivity is interpreted by the master interested in superadditivity as the result of a force. His increase in step size then is felt or interpreted by source and sink as a force, too.
starting condition would have to be interpreted as the presence of a hindering force or a limitation which now steadily ceases to be applied as step size becomes larger and larger. On the other side, the master of the quantity type could be interpreted as a hindering instance, not allowing to faster reach b-c=0. This could be now interpreted by source and sink also as a force. My reversed view followed by my interpretation now may appear captious. But again, source and sink have the impression that a force is active in area I. The hindering force slowly decreases in the case of the quality type and comes back as a demanding force when b-c=0 is crossed into area II and III. In the case of the quantity type the hindering force is always present till the limit b-c=0 is reached. Then this hindering force is superseded by a demanding force. Again, source and sink are used to the action of a force in area I. However, I consider this interpretation as less prevalent and limited to a few special cases. In my opinion inertia plays a central role not only in physics but also in behaviour. Any change of even unfavourable conditions is usually not greeted happily - Incerta pro spe non munera certa relinque.
Literature
1. Friedrich T and Köpper W (2013) Schumpeter´s Gale - Mixing and compartmentalization in Economics and Biology.
MPRA_paper_45405
2. Friedrich T (2018) Evolution towards higher net profit in a
population of ensembles of ensembles leads to division of labour. MPRA_paper_85517
3. Friedrich T (2015) The limits of wise exploitation in dependent and independent symmetric ensembles. MPRA_paper_68250
4. Friedrich T (2016) Aquila non captat muscas: Homo Economicus between exploration and exploitation. MPRA_paper_75601
5. Friedrich T (2019) Transfers by force and deception lead to stability in an evolutionary process when controlled by net profit but not by turnover. MPRA_paper_92724