Proceedings of the 56th Annual Meeting of the Association for Computational Linguistics (Short Papers), pages 694–699
694
Examining Temporality in Document Classification
Xiaolei Huang and Michael J. Paul Information Science
University of Colorado Boulder, CO 80309, USA
{xiaolei.huang,mpaul}@colorado.edu
Abstract
Many corpora span broad periods of time. Language processing models trained dur-ing one time period may not work well in future time periods, and the best model may depend on specific times of year (e.g., people might describe hotels differ-ently in reviews during the winter ver-sus the summer). This study investigates how document classifiers trained on docu-ments from certain time intervals perform on documents from other time intervals, considering both seasonal intervals (inter-vals that repeat across years, e.g., winter) and non-seasonal intervals (e.g., specific years). We show experimentally that clas-sification performance varies over time, and that performance can be improved by using a standard domain adaptation ap-proach to adjust for changes in time.
1 Introduction
Language, and therefore data derived from
lan-guage, changes over time (Ullmann,1962). Word
senses can shift over long periods of time
(Wilkins, 1993; Wijaya and Yeniterzi, 2011;
Hamilton et al., 2016), and written language can
change rapidly in online platforms (Eisenstein
et al.,2014;Goel et al.,2016). However, little is
known about how shifts in text over time affect the performance of language processing systems.
This paper focuses on a standard text process-ing task, document classification, to provide in-sight into how classification performance varies with time. We consider both long-term variations in text over time and seasonal variations which change throughout a year but repeat across years. Our empirical study considers corpora
contain-ing formal text spanncontain-ing decades as well as user-generated content spanning only a few years.
After describing the datasets and experiment design, this paper has two main sections, respec-tively addressing the following research questions:
1. In what ways does document classification depend on the timestamps of the documents?
2. Can document classifiers be adapted to per-form better in time-varying corpora?
To address question 1, we train and test on data from different time periods, to understand how performance varies with time. To address ques-tion 2, we apply a domain adaptaques-tion approach, treating time intervals as domains. We show that in most cases this approach can lead to improve-ments in classification performance, even on fu-ture time intervals.
1.1 Related Work
Time is implicitly embedded in the classification process: classifiers are often built to be applied to future data that doesn’t yet exist, and performance on held-out data is measured to estimate perfor-mance on future data whose distribution may have changed. Methods exist to adjust for changes in
the data distribution (covariate shift) (Shimodaira,
2000;Bickel et al.,2009), but time is not typically
incorporated into such methods explicitly.
One line of work that explicitly studies the rela-tionship between time and the distribution of data is work on classifying the time period in which
a document was written (document dating)
(Kan-habua and Nørv˚ag, 2008; Chambers, 2012;
Kot-sakos et al.,2014). However, this task is directed
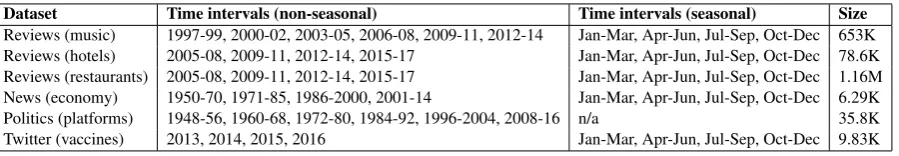
Dataset Time intervals (non-seasonal) Time intervals (seasonal) Size Reviews (music) 1997-99, 2000-02, 2003-05, 2006-08, 2009-11, 2012-14 Jan-Mar, Apr-Jun, Jul-Sep, Oct-Dec 653K Reviews (hotels) 2005-08, 2009-11, 2012-14, 2015-17 Jan-Mar, Apr-Jun, Jul-Sep, Oct-Dec 78.6K Reviews (restaurants) 2005-08, 2009-11, 2012-14, 2015-17 Jan-Mar, Apr-Jun, Jul-Sep, Oct-Dec 1.16M News (economy) 1950-70, 1971-85, 1986-2000, 2001-14 Jan-Mar, Apr-Jun, Jul-Sep, Oct-Dec 6.29K Politics (platforms) 1948-56, 1960-68, 1972-80, 1984-92, 1996-2004, 2008-16 n/a 35.8K Twitter (vaccines) 2013, 2014, 2015, 2016 Jan-Mar, Apr-Jun, Jul-Sep, Oct-Dec 9.83K
Table 1: Descriptions of corpora spanning multiple time intervals. Size is the number of documents.
2 Datasets and Experimental Setup
Our study experiments with six corpora:
• Reviews: Three corpora containing reviews la-beled with sentiment: music reviews from
Ama-zon (He and McAuley,2016), and hotel reviews
and restaurant reviews from Yelp.1 We
dis-carded reviews that had fewer than 10 tokens or a helpfulness/usefulness score of zero. The reviews with neutral scores were removed.
• Politics: Sentences from the American party platforms of Republicans and Democrats from
1948 to 2016, available every four years.2
• News:Newspaper articles from 1950-2014, la-beled with whether the article is relevant to the
US economy.3
• Twitter: Tweets labeled with whether they in-dicate that the user received an influenza
vacci-nation (i.e., a flu shot) (Huang et al.,2017).
Our experiments require documents to be
grouped into time intervals. Table1shows the
in-tervals for each corpus. Documents that fall out-side of these time intervals were removed. We grouped documents into two types of intervals:
• Seasonal: Time intervals within a year (e.g., January through March) that may be repeated across years.
• Non-seasonal:Time intervals that do not repeat (e.g., 1997-1999).
For each dataset, we performed binary
clas-sification, implemented in sklearn (Pedregosa
et al.,2011). We built logistic regression
classi-fiers with TF-IDF weightedn-gram features (n∈
{1,2,3}), removing features that appeared in less
than 2 documents. Except when otherwise speci-fied, we held out a random 10% of documents as
1
https://www.yelp.com/dataset
2
https://www.comparativeagendas.net/ datasets_codebooks
3https://www.crowdflower.com/
data-for-everyone/
validation data for each dataset. We used
Elas-tic Net (combined`1 and`2) regularization (Zou
and Hastie, 2005), and tuned the regularization
parameters to maximize performance on the val-idation data. We evaluated the performance using weighted F1 scores.
3 How Does Classification Performance Vary with Time?
We first conduct an analysis of how classifier per-formance depends on the time intervals in which it is trained and applied. For each corpus, we train the classifier on each time interval and test on each time interval. We downsampled the training data within each time interval to match the number of documents in the smallest interval, so that differ-ences in performance are not due to the size of the training data.
In all experiments, we train a classifier on a par-tition of 80% of the documents in the time inter-val, and repeat this five times on different parti-tions, averaging the five F1 scores to produce the final estimate. When training and testing on the same interval, we test on the held-out 20% of doc-uments in that interval (standard cross-validation). When testing on different time intervals, we test on all documents, since they are all held-out from the training interval; however, we still train on five subsets of 80% of documents, so that the training data is identical across all experiments.
Finally, to understand why performance varies, we also qualitatively examined how the dis-tribution of content changes across time
inter-vals. To measure the distribution of content,
we trained a topic model with 20 topics using
Jan-Mar Apr-JunTrainJul-Sep Oct-Dec Jan-Mar Apr-Jun Jul-Sep Oct-Dec Test
0.948 0.912 0.913 0.910
0.916 0.949 0.914 0.909
0.916 0.912 0.952 0.910
0.916 0.914 0.918 0.945
Reviews data - music
Jan-Mar Apr-JunTrainJul-Sep Oct-Dec
Jan-Mar Apr-Jun Jul-Sep Oct-Dec
Test
0.865 0.862 0.862 0.861
0.863 0.862 0.861 0.858
0.862 0.859 0.866 0.861
0.863 0.863 0.863 0.858
Reviews data - hotels
Jan-Mar Apr-JunTrainJul-Sep Oct-Dec
Jan-Mar Apr-Jun Jul-Sep Oct-Dec
Test
0.898 0.806 0.750 0.769
0.795 0.876 0.745 0.787
0.794 0.795 0.900 0.767
0.791 0.790 0.731 0.891
News data - economy
Jan-Mar Apr-JunTrainJul-Sep Oct-Dec
Jan-Mar Apr-Jun Jul-Sep Oct-Dec
Test
0.896 0.894 0.891 0.856
0.808 0.940 0.853 0.829
0.836 0.904 0.917 0.845
0.849 0.891 0.884 0.902
Twitter data - vaccine
2006-08 2009-11Train2012-14 2015-17
2006-08 2009-11 2012-14 2015-17
Test
0.823 0.828 0.825 0.859
0.799 0.843 0.830 0.858
0.800 0.819 0.833 0.869
0.790 0.813 0.835 0.880
Reviews data - hotels
2006-08 2009-11 2012-14 2015-17 Train 2006-08 2009-11 2012-14 2015-17 Test
0.829 0.838 0.869 0.883
0.814 0.856 0.870 0.883
0.815 0.842 0.884 0.894
0.814 0.839 0.875 0.902
Reviews data - restaurants
1948-56 1960-68 1972-80 1984-921996-20042008-16 Train 1948-56 1960-68 1972-80 1984-92 1996-2004 2008-16 Test
0.659 0.567 0.518 0.544 0.525 0.532
0.551 0.800 0.529 0.477 0.474 0.495
0.545 0.506 0.678 0.635 0.573 0.523
0.515 0.473 0.565 0.866 0.594 0.569
0.435 0.404 0.490 0.618 0.848 0.684
0.435 0.416 0.480 0.606 0.674 0.819
Politics - US political data
1985-89 1990-94 1995-99 2000-04 2005-09 2010-14Train
1985-89 1990-94 1995-99 2000-04 2005-09 2010-14 Test
0.876 0.758 0.783 0.794 0.777 0.756
0.764 0.883 0.771 0.802 0.789 0.748
0.759 0.760 0.905 0.798 0.806 0.763
0.760 0.756 0.770 0.926 0.805 0.771
0.773 0.767 0.783 0.826 0.900 0.778
0.773 0.750 0.778 0.810 0.786 0.897
[image:3.595.75.526.61.227.2]News data - economy
Figure 1: Document classification performance when training and testing on different times of year
(top) and different years (bottom). Some corpora are omitted for space.
3.1 Seasonal Variability
The top row of Figure1shows the test scores from
training and testing on each pair of seasonal time intervals for four of the datasets. We observe very strong seasonal variations in the economic news
corpus, with a drop in F1 score on the order of10
when there is a mismatch in the season between training and testing. There is a similar, but weaker, effect on performance in the music reviews from Amazon and the vaccine tweets. There was vir-tually no difference in performance in any of the pairs in both review corpora from Yelp (restau-rants, not pictured, and hotels).
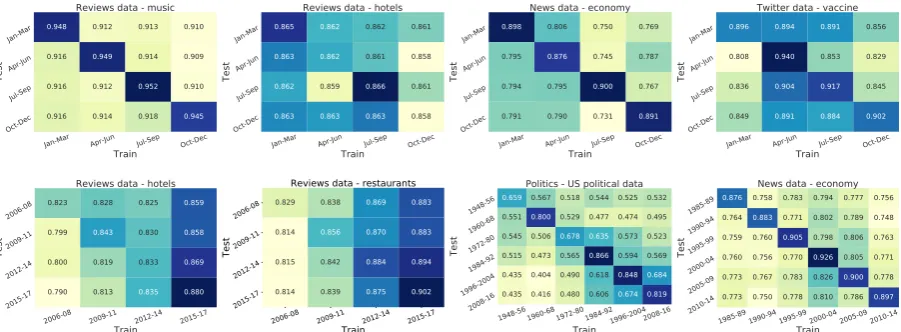
To help understand why the performance varies,
Figure2 (left) shows the distribution of topics in
each seasonal interval for two corpora: Amazon music reviews and Twitter. We observe very lit-tle variation in the topic distribution across sea-sons in the Amazon corpus, but some variation in the Twitter corpus, which may explain the large performance differences when testing on held-out seasons in the Twitter data as compared to the Amazon corpus.
For space, we do not show the descriptions of the topics, but instead only the shape of the dis-tributions to show the degree of variability. We did qualitatively examine the differences in word features across the time periods, but had diffi-culty interpreting the observations and were un-able to draw clear conclusions. Thus, characteriz-ing the ways in which content distributions vary over time, and why this affects performance, is still an open question.
3.2 Non-seasonal Variability
The bottom row of Figure1shows the test scores
from training and testing on each pair of non-seasonal time intervals. A strong pattern emerges in the political parties corpus: F1 scores can drop
by as much as 40 points when testing on
differ-ent time intervals. This is perhaps unsurprising, as this collection spans decades, and US party posi-tions have substantially changed over time. The performance declines more when testing on time intervals that are further away in time from the training interval, suggesting that changes in party platforms shift gradually over time. In contrast, while there was a performance drop when testing outside the training interval in the economic news corpus, the drop was not gradual. In the Twitter dataset (not pictured), F1 dropped by an average
of4.9points outside the training interval.
We observe an intriguing non-seasonal pattern that is consistent in both of the review corpora from Yelp, but not in the music review corpus from Amazon (not pictured), which is that the classi-fication performance fairly consistently increases over time. Since we sampled the dataset so that the time intervals have the same number of re-views, this suggests something else changed over time about the way reviews are written that makes the sentiment easier to detect.
The right side of Figure2shows the topic
Jan-Mar Apr-Jun Jul-Sep Oct-Dec
0.0 0.2 0.4 0.6 0.8 1.0
Topic Proportion
Reviews data - music
Jan-Mar Apr-Jun Jul-Sep Oct-Dec
0.0 0.2 0.4 0.6 0.8 1.0
Topic Proportion
Twitter data - vaccine
1997-992000-022003-052006-082009-112012-14
0.0 0.2 0.4 0.6 0.8 1.0
Topic Proportion
Reviews data - music
2013 2014 2015 2016
0.0 0.2 0.4 0.6 0.8 1.0
Topic Proportion
[image:4.595.81.519.60.171.2]Twitter data - vaccine
Figure 2: Topic distributions in each time of year (left) and each span of years (right). Topic models are trained independently in the seasonal vs. non-seasonal settings and are not aligned.
3.3 Discussion
Overall, it is clear that classifiers generally per-form best when applied to the same time interval they were trained. Performance diminishes when applied to different time intervals, although differ-ent corpora exhibit differ patterns in the way in which the performance diminishes. This kind of analysis can be applied to any corpus and could provide insights into characteristics of the corpus that may be helpful when designing a classifier.
4 Making Classification Robust to Temporality
We now consider how to improve classifiers when working with datasets that span different time
in-tervals. We propose to treat this as adomain
adap-tation problem. In domain adaptation, any
par-tition of data that is expected to have a differ-ent distribution of features can be treated as a
do-main (Joshi et al., 2013). Traditionally, domain
adaptation is used to adapt models to a common task across rather different sets of data, e.g., a sentiment classifier for different types of products
(Blitzer et al.,2007). Recent work has also applied
domain adaptation to adjust for potentially more subtle differences in data, such as adapting for dif-ferences in the demographics of authors (Volkova
et al.,2013;Lynn et al.,2017). We follow the same
approach, treating time intervals as domains. In our experiments, we use the feature
augmen-tation approach of Daum´e III (2007) to perform
domain adaptation. Each feature is duplicated
to have a specific version of the feature for ev-ery domain, as well as a domain-independent ver-sion of the feature. In each instance, the domain-independent feature and the domain-specific ture for that instance’s domain have the same fea-ture value, while the value is zeroed out for the domain-specific features for the other domains.
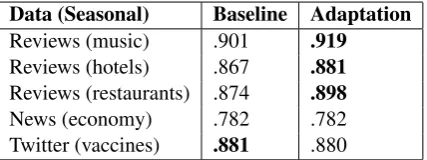
Data (Seasonal) Baseline Adaptation Reviews (music) .901 .919 Reviews (hotels) .867 .881 Reviews (restaurants) .874 .898 News (economy) .782 .782 Twitter (vaccines) .881 .880
Table 2: F1 scores when treating each seasonal
time interval as a domain and applying domain adaptation compared to using no adaptation.
This is equivalent to a model where the feature weights are domain specific but share a Gaus-sian prior across domains (Finkel and Manning, 2009). This approach is widely used due to its simplicity, and derivatives of this approach have been used in similar work (e.g., (Lynn et al.,
2017)). Following Finkel and Manning (2009),
we separately adjust the regularization strength for the domain-independent feature weights and the domain-specific feature weights.
4.1 Seasonal Adaptation
We first examine classification performance on the datasets when grouping the seasonal time in-tervals (January-March, April-June, July-August, September-December) as domains and applying the feature augmentation approach for domain adaptation. As a baseline comparison, we apply the same classifier, but without domain adaptation.
Results are shown in Table2. We see that
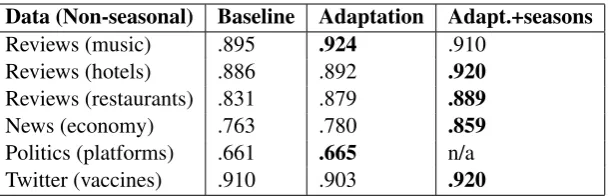
[image:4.595.311.525.227.307.2]Data (Non-seasonal) Baseline Adaptation Adapt.+seasons
Reviews (music) .895 .924 .910
Reviews (hotels) .886 .892 .920
Reviews (restaurants) .831 .879 .889
News (economy) .763 .780 .859
Politics (platforms) .661 .665 n/a
[image:5.595.149.455.61.159.2]Twitter (vaccines) .910 .903 .920
Table 3: F1 scores when testing on the final time interval after training on all previous intervals.
4.2 Non-seasonal Adaptation
We now consider the non-seasonal time intervals (spans of years). In particular, we consider the sce-nario when one wants to apply a classifier trained
on older data tofuturedata. This requires a
mod-ification to the domain adaptation approach, be-cause future data includes domains that did not ex-ist in the training data, and thus we cannot learn domain-specific feature weights. To solve this, we train in the usual way, but when testing on future data, we only include the domain-independent fea-tures. The intuition is that the domain-independent parameters should be applicable to all domains, and so using only these features should lead to bet-ter generalizability to new domains. We test this hypothesis by training the classifiers on all but the last time interval, and testing on the final interval. For hyperparameter tuning, we used the final time interval of the training data (i.e., the penultimate interval) as the validation set. The intuition is that the penultimate interval is the closest to the test data and thus is expected to be most similar to it.
Results are shown in the first three columns of
Table3. We see that this approach leads to a small
performance boost in all cases except the Twitter dataset. This means that this simple feature aug-mentation approach has the potential to make clas-sifiers more robust to future changes in data.
How to apply the feature augmentation tech-nique to unseen domains is not well understood. By removing the domain-specific features, as we did here, the prediction model has changed, and so its behavior may be hard to predict. Nonethe-less, this appears to be a successful approach.
4.2.1 Adding Seasonal Features
We also experimented with including the seasonal features when performing non-seasonal
adapta-tion. In this setting, we train the models with
two domain-specific features in addition to the domain-independent features: one for the season,
and one for the non-seasonal interval. As above, we remove the non-seasonal features at test time; however, we retain the season-specific features in addition to the domain-independent features, as they can be reused in future years.
The results of this approach are shown in the
last column of Table 3. We find that combining
seasonal and non-seasonal features together leads to an additional performance gain in most cases.
5 Conclusion
Our experiments suggest that time can substan-tially affect the performance of document classi-fication, and practitioners should be cognizant of this variable when developing classifiers. A sim-ple analysis comparing pairs of time intervals can provide insights into how performance varies with time, which could be a good practice to do when initially working with a corpus. Our experiments also suggest that simple domain adaptation
tech-niques can help account for this variation.4
We make two practical recommendations fol-lowing the insights from this work. First, evalua-tion will be most accurate if the test data is as sim-ilar as possible to whatever future data the classi-fier will be applied to, and one way to achieve this is to select test data from the chronological end of the corpus, rather than randomly sampling data without regard to time. Second, we observed that performance on future data tends to increase when hyperparameter tuning is conducted on later data; thus, we also recommend sampling validation data from the chronological end of the corpus.
Acknowledgements
The authors thank the anonymous reviews for their insightful comments and suggestions. This work was supported in part by the National Science Foundation under award number IIS-1657338.
4Our code is available at: https://github.com/
References
Steffen Bickel, Michael Brckner, and Tobias Scheffer. 2009. Discriminative learning under covariate shift.
Journal of Machine Learning Research, 10:2137– 2155.
John Blitzer, Mark Dredze, and Fernando Pereira.
2007. Biographies, bollywood, boom-boxes and
blenders: Domain adaptation for sentiment classi-fication. InAssociation for Computational Linguis-tics (ACL), pages 440–447.
Nathanael Chambers. 2012. Labeling documents with
timestamps: Learning from their time expressions. In Proceedings of the 50th Annual Meeting of the Association for Computational Linguistics (ACL), pages 98–106.
Hal Daum´e III. 2007. Frustratingly easy domain adap-tation. InAssociation for Computational Linguistics (ACL).
Jacob Eisenstein, Brendan O’Connor, Noah A. Smith, and Eric P. Xing. 2014. Diffusion of lexical change in social media.PLoS ONE, 9.
Jenny R. Finkel and Christopher D. Manning. 2009.
Hierarchical Bayesian domain adaptation. InNorth
American Chapter of the Association for Computa-tional Linguistics (ACL).
Rahul Goel, Sandeep Soni, Naman Goyal, John Pa-parrizos, Hanna Wallach, Fernando Diaz, and Ja-cob Eisenstein. 2016. The social dynamics of
lan-guage change in online networks. In The
Interna-tional Conference on Social Informatics (SocInfo).
William L. Hamilton, Jure Leskovec, and Dan Juraf-sky. 2016. Diachronic word embeddings reveal sta-tistical laws of semantic change. InAssociation for Computational Linguistics (ACL).
Ruining He and Julian McAuley. 2016. Ups and
downs: Modeling the visual evolution of fashion trends with one-class collaborative filtering. In Pro-ceedings of the 25th International Conference on World Wide Web (WWW), pages 507–517. Interna-tional World Wide Web Conferences Steering Com-mittee.
Xiaolei Huang, Michael C Smith, Michael J Paul, Dmytro Ryzhkov, Sandra C Quinn, David A Bro-niatowski, and Mark Dredze. 2017. Examining pat-terns of influenza vaccination in social media. In
Proceedings of the AAAI Joint Workshop on Health Intelligence (W3PHIAI), San Francisco, CA, USA, pages 4–5.
Mahesh Joshi, Mark Dredze, William W. Cohen, and Carolyn P. Rose. 2013. What’s in a domain?
multi-domain learning for multi-attribute data. In North
American Chapter of the Association for Compu-tational Linguistics (NAACL) (short paper), pages 685–690.
N. Kanhabua and K. Nørv˚ag. 2008. Improving tem-poral language models for determining time of
non-timestamped documents. InEuropean Conference
on Digital Libraries (ECDL).
Dimitrios Kotsakos, Theodoros Lappas, Dimitrios Kotzias, Dimitrios Gunopulos, Nattiya Kanhabua,
and Kjetil Nørv˚ag. 2014. A burstiness-aware
ap-proach for document dating. InProceedings of the 37th International ACM SIGIR Conference on Re-search & Development in Information Retrieval
(SI-GIR), pages 1003–1006.
Veronica E. Lynn, Youngseo Son, Vivek Kulkarni, Ni-ranjan Balasubramanian, and H. Andrew Schwartz.
2017. Human centered NLP with user-factor
adap-tation. InEmpirical Methods in Natural Language Processing (EMNLP), pages 1146–1155.
Fabian Pedregosa, Ga¨el Varoquaux, Alexandre Gram-fort, Vincent Michel, Bertrand Thirion, Olivier Grisel, Mathieu Blondel, Peter Prettenhofer, Ron Weiss, Vincent Dubourg, et al. 2011. Scikit-learn:
Machine learning in Python. The Journal of
Ma-chine Learning Research, 12:2825–2830.
Radim ˇReh˚uˇrek and Petr Sojka. 2010. Software Frame-work for Topic Modelling with Large Corpora. In
Proceedings of the LREC 2010 Workshop on New Challenges for NLP Frameworks, pages 45–50,
Val-letta, Malta. ELRA. http://is.muni.cz/
publication/884893/en.
Hidetoshi Shimodaira. 2000. Improving predictive
in-ference under covariate shift by weighting the log-likelihood function. Journal of Statistical Planning and Inference, 90(2):227 – 244.
Stephen Ullmann. 1962.Semantics: an introduction to
the science of meaning. Basil Blackwell, Oxford.
Svitlana Volkova, Theresa Wilson, and David
Yarowsky. 2013. Exploring demographic language
variations to improve multilingual sentiment anal-ysis in social media. In Empirical Methods in Natural Language Processing (EMNLP), pages 1815–1827.
Derry Tanti Wijaya and Reyyan Yeniterzi. 2011.
Un-derstanding semantic change of words over cen-turies. In Proceedings of the 2011 International Workshop on DETecting and Exploiting Cultural di-versiTy on the Social Web.
D.P. Wilkins. 1993.From Part to Person: Natural Ten-dencies of Semantic Change and the Search for Cog-nates. Cognitive Anthropology Research Group at the Max Planck Institute for Psycholinguistics.