Munich Personal RePEc Archive
Quantitative and Qualitative Approaches
in Managing Human Resource
Development in Enterprises
Buzko, Iryna and Dyachenko, Yuriy and Ovcharenko, Ievgen
and Klius, Yuliia
Volodymyr Dahl East Ukrainian National University
2018
Online at
https://mpra.ub.uni-muenchen.de/90111/
Copyright © 2018 Authors. This is an open access article distributed under theCreative Commons Attribution License, which permits unrestricted use, distribution, and reproduction in any medium, provided the original work is properly cited.
Quantitative and Qualitative Approaches in Managing Human
Resource Development in Enterprises
Iryna Buzko1, Yuriy Dyachenko1*, Ievgen Ovcharenko1, Yuliia Klius1
1
Volodymyr Dahl East Ukrainian National University, Severodonetsk, Ukraine *Corresponding author E-mail:y.dyachenko@i.ua
Abstract
The paper proposes comparing the existing and the required level of competence of the employee as a tool for determining the qualitative and quantitative parameters of personnel training. To implement this comparison, in accordance with official requirements, the human capital required for the performance of official duties as an employee's quality, which acquires value in the process of attracting to indus-trial relations, is calculated. Qualitative and quantitative parameters of personnel training are determined on the basis of calculation of the difference between necessary and existing competence taking into account financial possibilities of the enterprise. According to the re-sults of calculating the available human capital, which a certain employee owns, and comparing it with the necessary one, the content (according to the type of insufficient capital) and the amount (by difference between the existing and the required level) of training, which should bring the available human capital of the employee in accordance with the required one. Formation of the content of the training is based on the definition of individual assets of human capital, which depend on the requirements for the competence of the employee and can be changed through training.
Keywords:human resource development, personnel training, human capital, enterprise management.
1. Introduction
Acceleration of globalization processes at the end of the 20th cen-tury has become a catalyst for the emergence of a new type of economic environment – a knowledge-based economy, and the country's ability to create knowledge (primarily scientific), its dissemination and effective use for the development of production and society, within such an economy are becoming the main growth factors along with traditional sources – investments and labor resources, significantly increasing the efficiency of their use [24]. Education is a basic industry for the transition to an innova-tive model of economic development, for the development of a knowledge-based economy and the problem of improving the workforce today is not limited to the training of employees in certain professions, and modern economy and flexible labor mar-ket require a new quality of education and professional training [24].
2.
Modern methods of determining the
effectiveness of personnel training
The basis for managing personnel development lies in determining its effectiveness. According to the theory of human capital, the cost of professional training is considered an investment in human capital by organizations and should bring a return in the form of increasing the enterprise efficiency [3]. Determining the costs of training and its effectiveness is necessary to compile and justify the training budget as a component of the enterprise budget. For compiling you need to determine when, how much and what re-sources you need for training implementation. To protect the train-ing budget, it is necessary to determine the costs and incomes, that is, the quantitative analysis of effectiveness. Also, determining the costs of training and its effectiveness is necessary in order to se-lect and further improve the types and methods of training. The most common methods for determining the effectiveness of personnel development system are benchmarking methods, key
performance indicators and a balanced scorecard system. These methods provide a number of key performance indicators ( KPI) which characterize the personnel development system, they are calculated and analyzed in one of two ways: comparison with similar indicators in other units or enterprises, which is a bench-marking method, or the analysis of the dynamics of indicators for the unit or enterprise as a whole, which are the methods of key indicators of effectiveness and a balanced scorecard system. The advantage of the method of key performance indicators is visibility and quantitative nature of indicators, which allow for a detailed analysis of the dynamics of indicators. The disadvantage is the impossibility of a completely objective comparison due to the influence of external factors and rather significant financial and time costs for the development of methodology [2] and, par-ticularly, for calculation of indicators.
Training costs are divided into three types: direct, indirect and implicit costs [26]. Direct costs for personnel training include the remuneration of training and support personnel; costs for prepara-tion and distribuprepara-tion in printed or electronic form of informaprepara-tional and methodical materials in the form of textbooks, training aids, auxiliary materials, as well as software; training fee if it takes place outside the enterprise. Indirect costs for personnel training include the costs of purchasing or renting premises and equipment, which includes information and communication one; costs related to business trips. Implicit costs consist of wages (during training period) of those who are training, production loss due to absentee-ism of those who are training in the workplace [26], as well as losses due to the impossibility of alternative use of training facili-ties and technical training aids.
2 International Journal of Engineering & Technology
Along with direct, there are indirect or transaction costs for per-sonnel development. Economic science owes the notion of trans-action or non-production costs to new institutional theory. Trans-action costs in broad sense are considered as interTrans-action costs in the economic system and are associated with the uncertainty of market agents’ behavior and the economic situation as a whole in the process of contracting and contract enforcement. The theory of transaction costs was proposed to refine the economic models of the neoclassical theory of the firm. According to neoclassical theo-ry of the firm, the functioning of the economic mechanism occurs without costs of using economic mechanisms, in the real economy there exist such costs for contracts servicing and they are called transaction costs.
Consider the transaction costs associated with training.
In the process of training transaction costs associated with, in particular, the complexity of objective personnel assessment , possible inaccuracies in such an assessment, the difficulty of con-trolling the training effectiveness and significantly affect the effec-tiveness of personnel training.
Transaction costs related to training can be divided into two cate-gories: related to personnel involvement: recruitment; transfer from one workplace to another and related to the use of human capital: personnel disposition; use of personnel; development of personnel; control of the level of personnel competence.
Particularly, in the process of investing in human capital, the fol-lowing transaction costs can be distinguished:
– search, collection and evaluation of information about: the avail-able human capital of the company’s personnel; the proposed human capital during recruitment; the human capital needed for production, taking into account the strategy of enterprise devel-opment and forecasts of market conditions and macroeconomic indicators;
– making decisions on increasing human capital through personnel development or recruiting personnel from outside;
– controlling the increase of human capital during personnel de-velopment and involving acquisition of personnel.
In detail, it is possible to list the following transaction costs aris-ing in connection with personnel trainaris-ing:
– costs for estimating the volume of human capital required for an enterprise, taking into account the strategy of enterprise develop-ment and forecasts of market conditions and macroeconomic indi-cators;
– costs for estimating the volume of human capital available at the enterprise to compare it with the required volume of human capital; – costs for collecting information to make decisions about re-cruitment , development or efficient displacement of personnel in case a certain number of personnel of a certain qualification is required;
– costs for making decisions on recruiting or development of per-sonnel in conditions of uncertainty.
– costs for controlling the process and the results of personnel development and the calculation of training efficiency.
We offer the ways to reduce transaction costs by investing in so-cial capital.
The use of social capital can reduce the loss from objective uncer-tainty associated with incomplete information and unpredictability of market environment in case of the possibility of obtaining the necessary information with a better quality. Reducing losses from subjective uncertainty caused by possible opportunistic actions of partners is possible due to generally accepted rules of conduct: unwritten norms and trust relationship. Thus, the use of social capital can be assumed as a means of reducing transaction costs.
3.
The role to social capital in
improv-ing the effectiveness of trainimprov-ing
An important way of reducing transaction costs is to ensure the effectiveness of personnel training through the creation of condi-tions for interaction and cooperation of employees in the process
of personnel training, which helps reduce the losses caused by objective uncertainty associated with incomplete information and unpredictability of market environment. Reducing losses from subjective uncertainty caused by possible opportunistic actions of partners is possible by stimulating investment in social capital, ensuring the maintenance of generally accepted rules of conduct: unwritten norms and trust relationship. Let us analyze social capi-tal as an indicator of the effectiveness of employee interaction. [65].
The division of capital into physical, human and social associated with identification of productive qualities of means of production , productive qualities of man and productive qualities of interper-sonal relations, created as a result of investment and bring income, which is generated in the process of production. If the human capi-tal of an enterprise is the sum of knowledge, skills and abilities of employees, then social capital characterizes the productive value of the relationship between employees. The foundation of social capital is trust, which is defined as “expected reciprocity” and gives confidence that efforts aimed at helping others will be rec-ognized and paid off [15]. The presence of trust between econom-ic actors allows them to reduce operating and transaction costs for their activity. Social capital as an attribute of social connection of individuals is defined and studied, in particular, by using econom-ic principles of rational behavior in social systems analysis. Summarizing the considered definitions of social capital and the opinions of scientists in this regard, it is possible to conclude that the economic network, which consists of certain individuals– so-cial, or of enterprises– economic, is characterized, in particular, by a certain amount of social capital, which is defined as the amount of costs for creation and maintenance of economic network and investment in exteriorized network human capital. In its turn, the direct costs for the network consist of time and material costs for creation and maintenance of network. The time spent on creating and maintaining a network is the economic equivalent of time spent on creating and maintaining a network. That is, social capital can be calculated according to the following formula:
SC = Cn+ HCn= T·ct+ Cnm+ HCn, (1)
where Cn– costs for creating and maintaining an economic
net-work; HCn– investments in exteriorized network human capital;
T – time spent on creating and maintaining a network; ct– time
cost; Cnm– material costs for creating and maintaining a network.
The alternative costs associated with functioning of network in-clude the loss of income due to impossibility of opportunistic be-havior.
Income from social capital is determined by the following compo-nents:
– reduction of transaction costs as a result of reduction of the probability of opportunistic actions of the network participants in comparison with the participants of economic relations which are not part of the network; the increase in the probability of a suc-cessful completion of the planned actions as a result of increased predictability of relations between actors due to network norms of conduct. Investing in social capital is a protection against uncer-tainty in market relations and a way of reducing transaction costs; – return on exteriorized network human capital in the form of increase of income from economic activity due to :greater aware-ness; access to exteriorized network human capital; increase of effectiveness of collective action.
between children and parents (a combination of certain elements, such as the presence of both parents, the number of brothers and sisters and the expectations of parents about the education of their child).
When investing in social capital, it is important to analyze the mutual influence of education, social capital and transaction costs. If we consider the role of social capital in education, particularly higher and professional, then, apart from the transfer of knowledge, rules, methods, education is a process of teaching moral norms, thanks to which professional standards are placed above own interests of a professional. Such education cultivates certain norms that become an important source of social capital [7]. In the field of education, the main mechanisms of social relations are social cohesion and sociability.
At work employees learn from each other in the workplace. This process is stimulated in a collective work, where new team mem-bers learn in the workplace under the guidance of more experi-enced employees. Another form of by-effect of learning is the joint development and rapid transfer of new technologies through collective learning, for example, through business networks [21]. In both ways: an increase in the average level of human capital and the transfer of new technologies, – social cohesion and socia-bility stimulate the growth of incomes and thereby increase the overall productivity of production factors [14]. Information trans-fer is also facilitated under conditions of confidence that helps to overcome transaction costs in the transfer process and if the partic-ipants come from countries with a high level of trust, they tend to have more learning opportunities because they are parties to large and rich information flows [5, p. 31]. According to Putnam [22], informal education in groups and organizations improves the qual-ity of life and develops social ties, relationships of trust and toler-ance, consequently increasing social capital. On the other hand, as J. Coleman has shown in his study, there is a reciprocal interaction: social capital affects learning success: those who study in a sup-portive social environment have a greater probability of gradua-tion [4]. That is, it is the high level of social capital that reduces transaction costs and contributes to the successful learning and growth of human capital.
Important is the study of the influence of emergence and spread of information and communication technologies on the creation of social capital. In our opinion, the availability of these funds leads to a reduction in transaction costs and the growth of social capital. It also seems useful to conduct an analysis of the influence of information and communication technologies on the profitability of social capital. Social networks, the creation of which is greatly facilitated with the emergence of widespread access to the Internet, can lead to the accumulation of a significant amount of social capital, which can be used for training and accumulation of human capital.
One of the first to draw attention to the economic value of network relations was American sociologist Mark Granovetter [8], noting that economic behavior “is included in the network of interperson-al relations” . Granovetter noted that the success of job search depends on their interpersonal relations: individuals with a large number of informal (weak) ties find work easier than those who have only regular (strong) ties [9]. Perhaps this approach can be fruitful when considering access to information resources in a wider context, particularly in the training process. According to American sociologists Paul DiMaggio and Walter Powell, for individuals with a wide range of weak ties, on-the-job training process is simplified [6]. Acquisition and use of knowledge to a large extend depend on the density and quality of external, not related to official duties, professional relationships within the firm and with specialists from other firms [25, 23]. Training is largely taking place in the process of inheriting best practices transmitted through social networks, allowing saving transaction costs associ-ated with information search [6]. According to many researchers, networks simplify the training process for both individuals and organizations.
Public policy in stimulating social capital growth should be cau-tious about measures that encourage multiculturalism and pro-grams that weaken the level of social responsibility and solidarity, and must ensure public security and stability of property rights, that is reducing transaction costs for economic agents [7]. Consider the dynamics of the accumulation of social capital. In the second half of the twentieth century, Putnam shows a trend to-wards a decline in social capital [22]. Consider the possible rea-sons for this. Historically, in the twentieth century the following social and economic trends can be noted:
– development of processes that reduce uncertainty and loss from it by reducing transaction costs for economic agents and transfer-ring them to public institutions [27];
– distribution of information and communication technologies and technical means of receiving, distributing and processing infor-mation: telephone, Internet, personal computers, mobile commu-nication.
These aspects, reducing uncertainty, reduce losses from the latter, leading to a reduction in the need for social capital, which neutral-izes uncertainty. The security provided to the actor at the institu-tional level reduces the need for investment in social capital, which provided security before, so informal social structures of protection against uncertainty are replaced by formal institutional ones.
In addition, the decline of social capital can be explained by the substitution effect of increasing wages and, consequently, of un-derinvestment in social capital. As Becker has shown, an increase of wages, due to the substitution effect, leads to a reduction in time for non-production activities [1], which can include invest-ment in social capital: people prefer to spend more time at work, increasing their income instead of establishing and maintaining social contacts outside of it. However, this conclusion does not refer to social capital, which is directly linked to production activi-ty, and the investment to which may increase with the increase of wages. One of the ways of measuring social capital is Fukuyama’s proposal to evaluate the value of product made by a given social group [7].
4. Methods of determining the effectiveness of
training.
Consider the ways to determine the effectiveness of training. The basic model for determining the effectiveness of training is the Kirkpatrick model [10-13].
At the first level, the assessment is determined by the reaction of the participants and customers of the program, which is according to D. Kirkpatrick, “assessment of consumer satisfaction” through a survey of participants and customers of the program. Conducted immediately after graduation or employee’s return from training. May include questions on the assessment of the following aspects [26]: awareness of participants about the future training, time, place and training facilities, the benefit of training, technical train-ing aids, teachtrain-ing, the ability to apply the gained knowledge and skills at work.
At the second level, the acquired knowledge, changes in the set-tings, the improvement of knowledge and skills of the participants are determined. Such assessment is carried out before and imme-diately after training through testing of knowledge, skills and abilities: tests, exams, cases and at the assessment center.
4 International Journal of Engineering & Technology
At the fourth level, the influence of training on the functioning of the enterprise is assessed by measuring the quantitative but not financial influence of training on the functioning of enterprise, for example, productivity growth, quality growth, reduction of rejec-tion rate, reducrejec-tion of the number of accidents, etc. The assess-ment is carried out 6-12 month after the end of training. For this purpose the following is being recorded [19, 26]: dynamics of profit indicators, dynamics of stability of enterprise position in the market, changes in intellectual capital, image and reputation im-provement, growth of labor productivity, increase of sales volume , quality improvement, reduction of rejection rate, calculation of “return of expectations” (ROE). For a quantitative non-financial assessment of training effectiveness, the indicator ROE of return expectations is used, that is, the expected change in certain indica-tors after training. Absolute “return expectations” ROE is calcu-lated using the following formula:
1 2 p
p
ROE , (2)
where p1– indicator before conducting the training; p2– indicator
after conducting the training.
Relative “return of expectations” ROE is calculated as follows:
1 p p 100 100 p p p ROE 2 2 1 1
2 . (3)
The analysis of the results of the first-level assessment of Kirkpat-rick, that is, response to training, enables [26] to find and elimi-nate the causes of employee dissatisfaction with training;
Analysis of learning outcomes at the first-third levels (training) allows to:
- assess the quality of education; - assess the provider of training services;
- have the opportunity to improve the training process in the future; - control the discipline and integrity of those who train.
Calculation of ROI enables to give an overall assessment of the effectiveness of training and the validity of its content, scope, and time.
The development of the Kirkpatrick model is the Phillips model, that is, the calculation of return of investment ROI.
In the 70's and 80's, John F. Phillips , HR Manager, developed a fifth , additional to four-level model of Kirkpatrick, level – “return on investment” (ROI) [20]. By the Phillips formula, ROI is calcu-lated as: 1 V P 100 100 V V P
ROI , (4)
where P – income from training programs; V – the cost of training programs.
The cost of training programs should include both transformation-al, i.e. direct costs, and indirect –transaction, that is:
n 1 i i vV , (5)
where vi– individual direct and indirect cost of training .
According to the ROI method, the following steps are taken to determine the training effectiveness:
– information is collected for the evaluation of the first four levels of the Kirkpatrick model;
– the effects of training are isolated from other factors affecting the outcome;
– the influence of training is confirmed or not confirmed qualita-tively;
– if the influence of training is confirmed , then the training out-comes are transferred into financial indicators: the so-called “hard” indicators: product received, quality, working time, costs; and the so-called “soft” indicators: psychological climate, rela-tionships in the team, initiative and habits;
– the amount of training costs is calculated; – ROI is calculated according to (4).
Non-financial quantitative performance indicators K1, K2,…,Kj,…,
Kk: terms of performing operations, relative value of personnel
errors, etc. can also be used for financial evaluation of the effec-tiveness of training programs. Indicate the changes in the relevant quantitative performance indicators asK1,K2,…,Kj,…,Kk.
To convert quantitative performance indicators into financial indi-cators we use the specific conversion coefficients: f1, f2,…, fj,…,
fk. Under these conditions, the income from training programs
k 1 j j j f KP . (6)
In this case, the return on investment:
1 v f K 100 100 v V f K ROI n 1 i i k 1 j j j n 1 i i k 1 j j j . (7)When calculating ROI we face the following difficulties: the amount of income depends on many factors, to exclude the impact of which under real enterprise conditions is impossible; income from the project is sometimes of a hidden nature and is shown over a long period of time, so the calculation period should be quite long; it is difficult to convert the results into monetary in-come.
A qualitative or quantitative assessment of training enables [10-13] to explain the contribution of personnel and its structures to the achievement of the goals and objectives of the enterprise and to obtain information for decision-making on the continuation, modi-fication of the form and content, or the completion of training programs. As benefits of training can be considered [19]:
– direct benefits: reduction of direct costs, increase of personnel productivity, reduction of time costs, product quality improvement; – indirect benefits: production improvement ( shortening of time for information on interruptions, reducing absenteeism, reducing the number of safety violations ), stimulating personnel creativity , improving the quality of manpower ( reducing personnel turnover, complaints, dissatisfaction, increasing opportunities for career development ) ;
– implicit benefits: improvement of the emotional component of personnel work, increased initiative and leadership qualities, im-provement of basic communication skills .
The higher the cost of the training program, the higher is the level according to which they are evaluated. The following approaches can be used to reduce the evaluations costs [20]: imbedding evalu-ation in the training process, using special software [16] and ex-amples for calculating quantitative indicators [17]. Evaluation can be implemented at different levels: from the individual compo-nents of the training course to the company’s training projects for a certain period of time (usually a year).
Increasing the effectiveness of training is possible by increasing the efficiency of training in the form of income from training pro-grams, in particular through reducing transaction costs in produc-tion activities and reducing the costs of training in the form of transformation costs– the cost of training and transaction costs in the training process. Accordingly, in order to increase the training outcomes, it is necessary to train knowledge, skills and abilities that will reduce the transaction costs of production and training and to train the most important for production knowledge, skills and abilities.
Reducing the cost of training is possible because of minimizing the cost of training organization when choosing an organizational form of training and reducing transaction costs in the training process. Consider the calculation of the effectiveness of training, in particular, the influence of personnel training on the profit of the enterprise. In the event that the company loses its funds due to the insufficient educational and professional level of employees, personnel training with the cost of Ctris organized to improve the
R =P – Ctr. (8)
Effectiveness of training:
ROI = (P / Ctr)·100. (9)
5.
Practical determination of the
effec-tiveness of training of industrial
en-terprises personnel
[image:6.595.306.555.58.207.2]The most difficult task is to determine the effectiveness of training due to the segregation of costs for it and the complex feedback, due to the improvement of production results of the trained per-sonnel. The period during which the training outcomes affect the performance of the enterprise depends on many external, in rela-tion to enterprise, factors. Considering the fact that the identifica-tion of financial capacity for personnel training and the implemen-tation of training take some time, changes in the financial position of the enterprise have a certain delay on the indicators that charac-terize the personnel training. In order to determine the impact of enterprise performance indicators on the indicators characterizing personnel training, an analysis has been carried out of the relation-ship between the performance indicators of machine-building and metallurgical enterprises, such as LLC Severodonetsk Plant of Chemical non-standardized Equipment (LLC "SZHNО", Table 1), PJSC Krasnyi Luch Mashine-building Plant (Table 2), PJSC Stakhanov Ferroalloy Plant (JSC "SZF", Table 3) and indicators characterizing personnel training.
Table 1:Financial results of activity, the size of the wage fund and the share of employees who completed the training at LLC “SZHNО” in
2007-2013
Indicator 2007 2008 2009 2010 2011 2012 2013 Number of
employees, people
231 274 272 272 273 314 321
Wage fund,
thsd. hrn. 4254.0 5849.6 2718.2 5044.5 6078.6 7109.6 6849.8 Wage fund
per person, thousand hrn.
per person
18.42 21.35 9.99 18.55 22.27 22.64 21.34
Net income,
thsd. hrn. 25740 49752 46250 47233 76628 70137 96649 Profit, thsd.
hrn. -959 6022 1823 -6825 5711 7036 10766 Profit per
person, thsd. hrn. per
person
-4.15 21.98 6.70 -25.09 20.92 22.41 33.54
Number of employees who com-pleted ad-vanced
pro-fessional training, people
49 46 36 25 43 42 21
The share of employees
who com-pleted pro-fessional training, %
21.2 16.8 13.2 9.2 15.8 13.4 6.5
Change in wage fund, thsd.hrn per
year
37.5 -53.5 85.6 20.5 17.0 -3.7
Change in wage fund per person, thsd.hrn. per
15.9 -53.2 85.6 20.1 1.7 -5.8
person per year Change of net income. thsd.hrn. per
year
93.3 -7.0 2.1 62.2 -8.5 37.8
Change of profit, thsd.hrn. per
year
727.9 -69.7 -474.4 183.7 23.2 53.0
Change of profit per
person, thsd.hrn. per
person per year
629.4 -69.5 -474.4 183.4 7.1 49.7
[image:6.595.311.554.297.677.2]The conducted analysis made it possible to determine the influ-ence of particularly financial results on the scope of personnel training (Tables 4, 5).
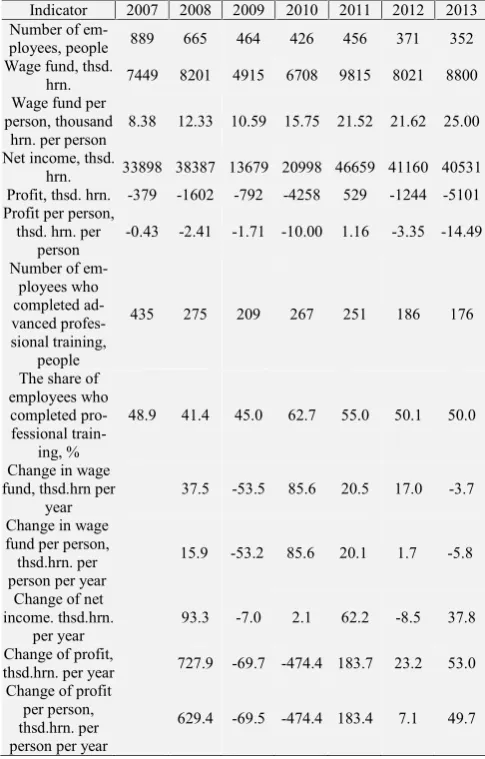
Table 2:Financial results of activity, the size of the wage fund and the share of employees, who completed the training at PJSC Kransyi Luch
Machine-building Plant in 2007-2013
Indicator 2007 2008 2009 2010 2011 2012 2013 Number of
em-ployees, people 889 665 464 426 456 371 352 Wage fund, thsd.
hrn. 7449 8201 4915 6708 9815 8021 8800 Wage fund per
person, thousand hrn. per person
8.38 12.33 10.59 15.75 21.52 21.62 25.00
Net income, thsd.
hrn. 33898 38387 13679 20998 46659 41160 40531 Profit, thsd. hrn. -379 -1602 -792 -4258 529 -1244 -5101 Profit per person,
thsd. hrn. per person
-0.43 -2.41 -1.71 -10.00 1.16 -3.35 -14.49
Number of em-ployees who completed ad-vanced profes-sional training,
people
435 275 209 267 251 186 176
The share of employees who completed pro-fessional
train-ing, %
48.9 41.4 45.0 62.7 55.0 50.1 50.0
Change in wage fund, thsd.hrn per
year
37.5 -53.5 85.6 20.5 17.0 -3.7
Change in wage fund per person, thsd.hrn. per person per year
15.9 -53.2 85.6 20.1 1.7 -5.8
Change of net income. thsd.hrn.
per year
93.3 -7.0 2.1 62.2 -8.5 37.8
Change of profit,
thsd.hrn. per year 727.9 -69.7 -474.4 183.7 23.2 53.0 Change of profit
per person, thsd.hrn. per person per year
629.4 -69.5 -474.4 183.4 7.1 49.7
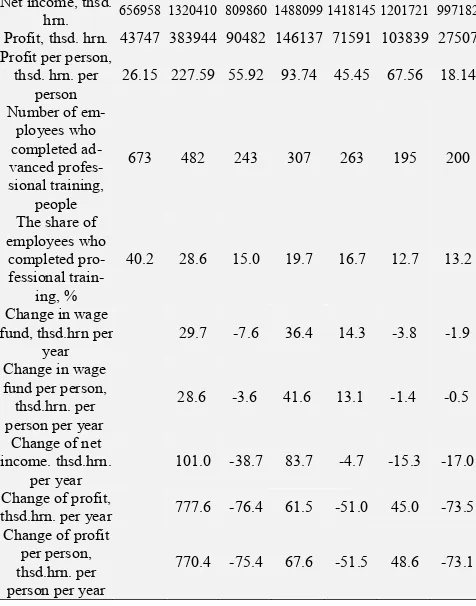
Table 3:Financial results of activity, the size of the wage fund and the share of employees, who completed the training at PJSC Stakhanov
Fer-roalloy Plant in 2007-2013
Indicator 2007 2008 2009 2010 2011 2012 2013 Number of
em-ployees, people 1673 1687 1618 1559 1575 1537 1516 Wage fund, thsd.
hrn. 37149 48167 44529 60755 69413 66792 65518 Wage fund per
[image:6.595.56.298.414.790.2]6 International Journal of Engineering & Technology
hrn. per person Net income, thsd.
hrn. 656958 1320410 809860 1488099 1418145 1201721 997182 Profit, thsd. hrn. 43747 383944 90482 146137 71591 103839 27507 Profit per person,
thsd. hrn. per person
26.15 227.59 55.92 93.74 45.45 67.56 18.14
Number of em-ployees who completed ad-vanced profes-sional training,
people
673 482 243 307 263 195 200
The share of employees who completed pro-fessional
train-ing, %
40.2 28.6 15.0 19.7 16.7 12.7 13.2
Change in wage fund, thsd.hrn per
year
29.7 -7.6 36.4 14.3 -3.8 -1.9
Change in wage fund per person, thsd.hrn. per person per year
28.6 -3.6 41.6 13.1 -1.4 -0.5
Change of net income. thsd.hrn.
per year
101.0 -38.7 83.7 -4.7 -15.3 -17.0
Change of profit,
thsd.hrn. per year 777.6 -76.4 61.5 -51.0 45.0 -73.5 Change of profit
per person, thsd.hrn. per person per year
[image:7.595.57.295.72.375.2]770.4 -75.4 67.6 -51.5 48.6 -73.1
Table 4:Analysis of the relationship of financial results of enterprises, the wage fund and the share of employees who were trained at the enterprise
in 2007-2013
Financial results of enterprise activity
Pierson’s linear correlation coefficient of de-pendence of the share of employees who com-pleted the training on financial results of enter-prise activity in the current/ previous year
LLC Severodonetsk Plant of
Chemi-cal non-standardized
Equipment
PJSC Krasnyi Luch
Machine-building Plant
PJSC Stakhanov Ferroalloy Plant
1. Wage fund 0.00/0.41 0.12/0.64 0.76/0.85 2. Wage fund per person 0.27/0.06 0.34/0.09 0.78/0.82 3. Net income 0.76/0.74 0.07/0.71 0.37/0.84 4. Profit 0.43/0.75 0.32/0.24 0.24/0.35 5. Profit per person 0.25/0.71 0.33/0.31 0.22/0.38
Discovered that the main factor affecting the amount of training at the enterprise is net income of the enterprise for the previous year (Table 4), and the dynamics of indicators, which characterize the personnel training is mostly determined by the change in wages fund of the enterprise for the previous year (Table 5). On the basis of this analysis it can be argued that decision-making on financing training is carried out taking into account net income of the enter-prise for the previous year; the review of decisions on training is carried out under the influence of changes in the amount of wage fund.
Table 5:Analysis of the relationship of the dynamics of enterprise finan-cial results, wage fund and change of the share of employees who
com-pleted the training at the enterprise in 2007-2013
Dynamics of enterprise financial results
Pierson’s linear correlation coefficient of de-pendence of the share of employees who com-pleted the training on the dynamics of financial results of enterprise activity in the current/
previ-ous year LLC
Severodonetsk
PJSC Krasnyi Luch
Machine-PJSC Stakhanov Ferroalloy Plant
Plant of Chemi-cal non-standardized
Equipment
building Plant
1. Dynamics of wage
fund 0.09/0.73 0.13/0.84 0.55/0.79
2. Dynamics of wave
fund per person 0.11/0.82 0.13/0.71 0.59/0.70 3. Dynamics of net
in-come 0.34/0.10 0.04/0.82 0.41/0.79
4. Dynamics of profit 0.20/0.57 0.33/0.41 0.18/0.74 5. Dynamics of profit
per person 0.24/0.60 0.25/0.36 0.18/0.74
6. Conclusion
Thus, a retrospective link of relationship between organization and financing of training and its influence on the indicators of the enterprise activity was received. This information is important for the correction of the training process, but on its basis, it is difficult to carry out a forecast of the effectiveness of training. Therefore, there is a need to develop such a forecast in order to establish a certain link between training and its results in the form of certain rules and regularities.
References
[1] Becker GS (1965), A Theory of the Allocation of Time.The Eco-nomic Journal75, 493-517.
[2] Buzko I & Dyachenko Y (2012), Formation of methodological grounds for staff development. Actual Problems of Economics
129(3), 8-12.
[3] Buzko I, Dyachenko Y &Nemashkalo O. (2011), Evaluation of human capital as a tool for management of human resource devel-opment.Actual Problems of Economics, 116(2), 117-123.
[4] Coleman S (1999), Social Capital in the Creation of Human Capital.
Social Capital: A Multifaceted Perspective, Washington, DC: World Bank, pp. 13-39.
[5] Cooke P & Morgan K.The associational economy: firms, regions, and innovation, Oxford: Oxford University Press, (2000).
[6] DiMaggio PJ & Powell WW (1983), The iron cage revisited: Insti-tutional isomorphism and collective rationality in organizational fields.American Sociological Review48(2), 147-160.
[7] Fukuyama F.The Great Disruption: Human Nature and the Recon-stitution of Social Order, New York: Free Press, (1999).
[8] Granovetter MS (1985) Economic Action and Social Structure: The Problem of Embeddedness.American Journal of Sociology91, 481-510.
[9] Granovetter MSGetting a Job: A Study of Contacts and Career, Cambridge, MA: Harvard University Press, (1974).
[10] Kirkpatrick DL (1959), Techniques for evaluating training pro-grams. Journal of the American Society for Training Directors
13(11), 3-9.
[11] Kirkpatrick DL (1959), Techniques for evaluating training pro-grams: Part 2 – Learning. Journal of the American Society for Training Directors13(12), 21-26.
[12] Kirkpatrick DL (1960), Techniques for evaluating training pro-grams: Part 3 – Behavior. Journal of the American Society for Training Directors14(1), 13-18.
[13] Kirkpatrick DL (1960), Techniques for evaluating training pro-grams: Part 4 – Results.Journal of the American Society for Train-ing Directors14(2), 28-32.
[14] Knorringa P & van Staveren ISocial Capital for Industrial Devel-opment: Operationalizing the Concept, Vienna: United Nations In-dustrial Development Organization, (2006).
[15] Milner BZKnowledge Management, Moscow, INFRA-M, (2003). [16] Nenkov N, Dyachenko Y, Dimitrov G & Koeva K (2016) Artificial
Intelligence Technologies for Personnel Learning Management Systems.2016 IEEE 8th International Conference on Intelligent Systems. Proceedings, Sofia, Bulgaria, 189-194.
[image:7.595.55.299.420.561.2]Learning.European Journal of Sustainable Development6(4), 353-360.
[18] Nenkov N, Sushchenko O & Dyachenko Y (2017), Role of chief information officer within the system of human resource develop-ment in service organizations (tourism). Economic Annals-XXI
165(5-6), 97-103.
[19] Pechenkin A (2005), Evaluation of the effectiveness of e-learning projects.2nd Moscow International Exhibition and Conference on e-Learning eLearnExpo Moscow 2005, available online: http://www.bits-expo.ru/files/2005/conf_materials/Pechenkin.pps, last visit: 01.01.2010.
[20] Phillips JJ Handbook of Training Evaluation and Measurement Methods, Houston, Texas: Gulf Publishing Company, (1983). [21] Porter M (2000), Location, competition and economic
develop-ment; local clusters in a global economy.Economic development quarterly14(1), 15-34.
[22] Putnam RDBowling Alone: The Collapse and Revival of American Community. New York: Simon & Schuster, (2000).
[23] Schrader S (1992), Informal Technology Transfer between Firms: Cooperation Through Information Trading. Research Policy20, 153-170.
[24] The Millennium Development Goals, United Nations, (2000),
available online:
http://www.un.org/en/mdg/summit2010/pdf/List+of+MDGs+Englis h.pdf, last visit: 15.06.2018.
[25] Von Hippel ESources of Innovation,N.Y.: Oxford University Press, (1988).
[26] Vorotynceva T & Nedelin EWe are building the personnel training system. A Practical Guide for Training Professionals, SPb, Rech’ (2008).