Munich Personal RePEc Archive
The Dynamics of Comparative
Advantage in the ASEAN Region
Setyastuti, Rini and Adiningsih, Sri and Widodo, Tri
Faculty Economics and Business, Universitas Gadjah Mada
6 May 2018
The Dynamics of Comparative Advantage in the ASEAN Region
By: Rini Setyastuti
Doctoral Program, Faculty Economics and Business, Universitas Gadjah Mada
Sri Adiningsih
Faculty Economics and Business, Universitas Gadjah Mada
Tri Widodo
The Dynamics of Comparative Advantage in the ASEAN Region
Abstract
The performance of a country’s in international trade changes depending on its dynamic comparative advantage. The country with a rapid catching-up process has generally also shown a rapid structural transformation. This article addressed to answer two questions. How does the shift in comparative advantage or specialization in the ASEAN region? What is the exact position of countries in the Flying Geese model? We use data on exports and imports by commodities and by exporting countries taken from UN-COMTRADE. The classification of commodities follows 3-digit SITC Revision 2, consisting of 239 groups of products (SITC). The products mapping is constructed by using the RSCA (Revealed Symmetric Comparative Advantage) as the indicator of comparative advantage and TBI (Trade Balance Index) as the indicator of export import activities. The analytical tool, “products mapping” is used to examine the flying gees pattern. The results show that ASEAN featured product in 1990 was dominated by SITC 0 product (food and live animals), after twenty five years by 2015 SITC 7 (machinery and transportation) products are relatively more dominant in ASEAN export products. In 1990-2015 period, it is shown that the average magnitude of RSCA in ASEAN countries has decreased followed by an increase in the standard deviation value. It indicates that the occurance of product specialization that has a high comparative advantage and a decline in products that have low comparative advantages. Using a significance level 5%, it appears that ASEAN countries as a whole are experiencing significant dynamic changes in comparative advantage. From the pattern of Flying Gees, it can be said that the process of “catch up” in ASEAN member countries is not running as expected because the country that leads in the composition of flying gees only consists of certain countries only, namely Singapore, Malaysia, Indonesia, Thailand and Philippines.
Key words: Comparative Advantage, RSCA, TBI, Flying Geese, ASEAN
1. Introduction
would contribute to economic growth (Okabe and Urata, 2013). AFTA began with six ASEAN members, namely Brunei, Indonesia, Malaysia, the Philippines, Singapore and Thailand, and then it was joined by Vietnam in 1995, Lao PDR and Myanmar in 1997, and Cambodia in 1999. Today, AFTA has 10 members.
The AFTA would be realized by applying the Common Effective Preferential Tariff (CEPT) Scheme to eliminate tariffs of intra-AFTA trade, which have been in effect since January 1993. Under the agreement, the AFTA members set the target years for tariff elimination to be completed. By 2010, more than 99% of the tariff lines in the CEPT inclusion list had been eliminated in the six original AFTA members, while around 95-99% of the tariff lines had been brought down to the 0-5 percentage tariff range for the new members. Moreover, it is agreed effective tariff, preferential to the ASEAN, to be applied to goods originating from the ASEAN member countries (at least 40% of its contents originates from members of the ASEAN).
ASEAN member countries are moving towards achieving the ASEAN Economic Community (AEC) with the time line set at 2015. The AEC Blueprint (2008) serves the road map of the AEC project’s integrated ASEAN economic region, that was built on four pillars of integration: (i) a single market and production base, (ii) a competitive economic region, (iii) equitable economic development, and (iv) integration with the global economy. ASEAN Economic Integration, that signed with free mobility of five key elements, i.e., goods , services, investment, capital and skilled labour. The integration generates a hope that ASEAN would be a the third biggest market area in the world. This hope could achieve with determination of priority in 12 sectors, i.e.: (1) Woodbased products, (2) Automotives, (3) Rubber based products, (4)
Textile and apparels, (5) Agro based products, (6) Fisheries, (7) Electronics, (8) e-ASEAN, (9)
Healthcare, (10)Air travel, (11)Tourism, and (12)Logistics Services.
Competitiveness is one of important indicators to see how much benefits that ASEAN countries get. The most profitable country is the country with the highest competitiveness. Based on the Global Competitiveness Report 2016-2017 compiled by the World Economic Forum stated that the Indonesian economy is ranked 41st in the global economic competitiveness. The ranking is still below other ASEAN countries such as Singapore ranked 2nd, Malaysia ranked 25th, and Thailand ranked 34th. Indonesia's economic competitiveness in that period is still higher than the Philippines (57), Vietnam (60), Laos (93) and Cambodia (89). The following table shows the top 10 countries and ASEAN countries.
Table 1. about here
The table above shows that the majority of ASEAN countries are downgraded from 2015-2016 to 2015-2016-2017, only Cambodia has increased (Myanmar is not surveyed). If this condition persist, the potential disadvantage with the presence of an MEA may occur. Thus a right effort is needed to accelerate competitiveness. One of the ways is by mapping product specialization that must be stimulated in order to improve competitiveness. The aim of this paper is to answer two questions. How does the shift in comparative advantage or specialization in the ASEAN region and what is the exact position of countries in the Flying Geese model?
2. Methodology
Data
(3-digit codes) for Groups, level 4 (4 (3-digit codes) for subgroups and level 5 (code 5 (3-digits) for items (UN, 2004).
Based on the United Nations Conference on Trade and Development (UNCTAD) and the World Trade Organization (WTO) and the 3-digit SITC classification, a Dutch research organization Empirical Trade Statistics (ETA) grouped the 3-digit SITC into 6 groups:
A. Product group A: primary product (83 sectors).
B. Product group B: intensive products using natural resources (21 sectors) C. Product group C: Intensive product using unskilled labor (26 sectors) D. Product group D: technology-intensive products (62 sectors)
E. Product group E: intensive products using human capital (43 sectors) F. Sectors not classified according to intensity (5 sectors)
Analysis of Comparative Advantage
To know the comparative advantage of export products, the Revealed Comparative Advantage (RCA) index is commonly applied in the empirical analysis. The RCA index has been introduced by Balassa (1965). This index measures the relative representation of a country's export in one product / industry compared to the average representation of that industry in total world trade. This research uses product definition based on 3-digit Standard International Trade Classification (SITC) product grouping system. The data used are export and import data of each country and world product, taken from UN-Comtrade. The RCA index is defined as:
ij in
rj rn
ij
x
/
x
/
x
/
x
RCA
can not be compared on both sides of 1, Therefore, the index is made to be symmetric index. This new index is called Revealed Symmetric Comparative Advantage (RSCA), formulated as (Laursen, 1998):
RCA
1
/
RCA
1
RSCA
ij
ij
ij
The RSCAij index is between -1 and +1 (-1≤RSCAij≤1). RSCA below 0 means that country i has comparative disadvantage in product j, otherwise RSCA above 0 implies that country i has comparative advantage in good j.
The Dynamic of Comparative Advantage
To describe the dynamics of comparative advantage can be used descriptive statistical calculations as performed by Laursen (1998), Widodo (2010) by calculating the RCA distribution associated with the dynamics of comparative advantage. Some of these descriptive statistical calculations include calculation of arithmetic mean, standard deviation and skewness. The first calculation of arithmetic mean is shown by the following formula:
uliri h
uli ri
Where:
uliriis the average RSCA for country j in year t
i is the specification of exported products (STIC) j is a country (ASEAN)
t is time of observation (2000,2005,2010 or 2015)
n is the number of product (in STIC 3 digits there are 237 products)
Second, the standard deviation calculation is a measure of statistical data dispersion. It measures how the value of data set spreading out from mean. The greater the standard deviation value indicates that the more data whose value is far from the average. If the data is close to the average magnitude, then the standard deviation value will move close to zero. The standard deviation value of the RSCA variable can be formulated as follows.
ui 㤮 uliri
where
ui 㤮 uliriis the deviation standard of RSCA for country j (ASEAN) in year t
n is the number of observation (in STIC 3 digits there are 237 products)
Third, the shape of the RSCA distribution can be seen by calculating the size of its skewness. In a positive skewed distribution, the arithmetic mean is greater than the median value and mode. Conversely, in a negative skewed distribution, it indicates that the arithmetic mean is less than the median and mode. The formula for obtaining Skewness size is as follows.
ut uliri
㤮h uliri 㤮 h uliri
i 㤮 uliri
where
ut uliriis the skewness coefficient of variable RSCA for state j in year t
i 㤮 is the standard deviation j is ASEAN countries
t is time (2000, 2005, 2010, 2015)
To see the dynamics of comparative advantage between countries and between products can be used econometric model as used by Laursen (1998) and Widodo (2010).
uli r uli r
Where uli r and uli r are Revealed Symmetric Comparative Advantage of state i with
product j respectively for year T and 0. is the error term (error term). The amount of β coefficient indicates whether there is a change in comparative advantage or specialization pattern during the observation period. If the value of β does not differ significantly with one (β = 1) then it can be said that there is no change at all levels of its speciality.
Rank Correlation
structural change in comparative advantage, in contrast, it equal plus one (+1) if there is no structural change in comparative advantages during the period of analysis. The degree of linear association between two series of RSCA can be calculated by the Spearman's rank correlation coefficient, which is given as follows (Gujarati, 2009; Widodo, 2010).
Across periods (year):
rlihrli h t h hhi
Across countries:
rlihr i h t h hhi
where:
s,Cta,Ctb : The Spearman's rank correlation coefficient between country C's RSCA at time ta
(symbol Cta) and country C's RSCA at time tb(symbol Ctb)
s,Cta,Itb : The Spearman's rank correlation coefficient betweem country C's RSCA at time ta
(symbol Cta) and country I's RSCA at time tb(symbol Itb)
i= ulilrih ulilri for across periods (years)
i= ulilrih uli ri for across countries
ulilrih: the rank of country C's RSCA of group of products j at time ta
ulilri : the rank of country C's RSCA of group of products j at time tb
uli ri : the rank of country I's RSCA of group of products j at time tb
n is the number of observation groups of products (i.e. 237 STIC) taand tbare years
The Analysis of Catch Up process
advantage and export-import (trade balance). This analysis tool is developed by combining these two variables, namely RSCA (Revealed Symmetric Comparative Advantage) as an indicator of comparative advantage and Trade Balance Index (TBI) as an indicator of export and import activities. RSCA is calculated by the formula discussed in the previous section. TBI is used to analyze whether a country has specialized in its export (as a net exporter) or in import (as a net importer) for a particular product group (SITC). TBI can be calculated by the formula:
TBIij= (xij- mij)/ (xij+ mij)
where TBIij shows the trade balance index of country i for product group (SITC) j; xij and mij denote the exports and imports of product group j by country i. Extremely, the TBI value equals -1 indicates that the country only imports, otherwise if the TBI value equals +-1, it can be interpreted that the country only exports. If the value of TBI is between -1 and +1, it can be said that the country exports and imports. Negative values show net importers and net exporters if the value of TBI is positive.
Revealed Symmetric Comparative Advantage Index (RSCA)
RSCA>0 Group B :
Having comparative advantage but no export specialization
(net-importer) (RSCA>0 and TBI<0)
Group A:
Having comparative advantage and export specialization
(net-exporter) (RSCA>0 and TBI>0)
RSCA<0 Group D :
No comparative advantage or export specialization
(net-importer) (RSCA<0 and TBI<0)
Group C :
Having an export specialization but does not have a comparative
advantage (net-exporter) (RSCA<0 and TBI>0)
TBI<0 TBI>0
Source : Widodo, 2010
specialization but does not have a comparative advantage; And group D consists of products that have no comparative advantage or export specialization.
3. Results and Discussion
In economics theory, there is an argument that there is a relationship between the factor intensities for specific products and the location for their optimal production. Product with labor intensive techniques in their productions should normally be produced in poorer, less development countries, where labor cost is relatively low. In the other hand, products with capital intensive techniques in their production should be produced in richer, development countries where the cost of capital is relatively low. Meanwhile, the less developed countries should have comparative advantage in labor-intensive products, and the more developed countries should have comparative advantage in capital-intensive products.
The Structure of Comparative Advantage
The following table shows the comparative advantages in ASEAN member countries in 1990 and 2015. The table also shows that a change in comparative advantage, however it can not be inferred the presence of structural change.
Table 2 about here
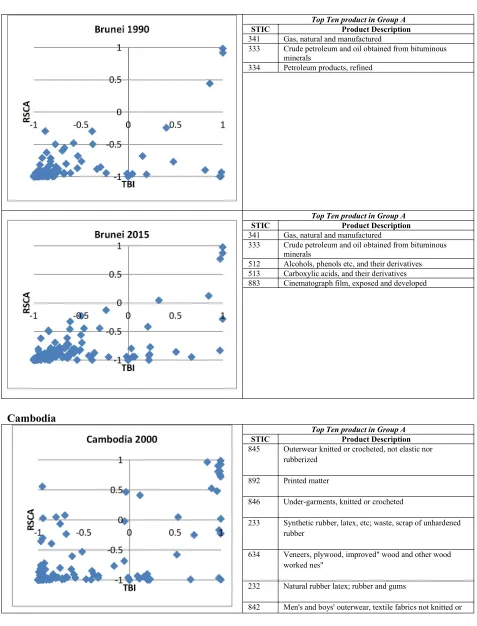
ASEAN's featured product in 1990 was dominated by SITC 0 product (food and live animals). After twenty five years of operation, by 2015 SITC 7 (machinery and transportation) products are relatively more dominant in ASEAN export products. In 1990, Brunei's exports were dominated by natural gas and crude oil products (SITC 341 and 333). By 2015 this product still dominates Brunei;s exports.
Indonesian's featured product in 1990 were vegetation oil, solid or refined crude oil (SITC 424), natural rubber latex (STIC 232), tin (STIC 687), coal (STIC 322) and products classified in STIC 0 (food and live animals), and by 2015 Indonesia can still maintain STIC 0 as the feature products and has a new featured products in STIC 2 (raw material except coal).
Philippine had the same superior products as well as Indonesia and Malaysia, that were vegetable oil, solid or refined crude (STIC 424), ore and precious metal concentrate (STIC 289), firewood and wood charcoal (STIC 425) and some products from STIC 0 (food and live animals). In 2015, there are other superior products from STIC 7 (machinery and transport equipment)
Between 1990 and 2015 Thailand remained consistent in maintaining STIC 0 (food and live animals) as it featured products. In 1990, Thailand also had another featured product named SITC 8 (miscellaneous manufactured), which in 2015 products from SITC 0 and SITC 2 still as superior products. Cambodia had a superior product in SITC 8 (miscellaneous manufactured), and in 2015, SITC 2 more dominates.
In 1990, Singapore had featured exports of natural rubber products. Petroleum products, tin and some SITC 7 products (machine and transport equipment). After twenty five years, this products still dominate. Myanmar has an excellent product as well as Brunei Darussalam, which has natural gas and crude oil as featured exports. Myanmar’s data in 1990 was not yet available. From 1990 to 2015, Vietnam succeeded in maintaining its featured products in SITC 0 (food and live animals) and SITC 8 (miscellaneous manufactured).
The Dynamic of Comparative Advantage
To see the dynamics of comparative advantage can be used descriptive statistical calculations as performed by Laursen (1998), Widodo (2010) by calculating the RSCA distribution associated with the dynamics of comparative advantage. Some of these descriptive statistical calculations include calculation of mean, standard deviation and skewness. The first calculation of arithmetic mean is shown by the following formula.
uliri h
uli ri
where : uliriis the average RSCA for state j in year t i is the specification of exported products (STIC) j is a country (ASEAN)
t is the observation time (2000,2005,2010 or 2015)
n is the number of products (in STIC 3 digits there are 233 products)
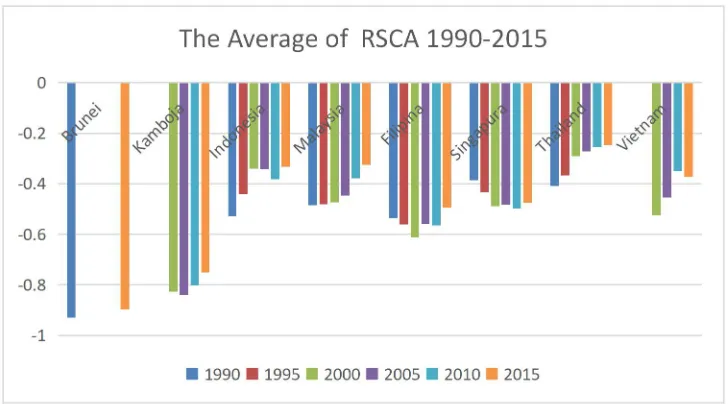
From figure 1, it is shown that the average magnitude of RSCA in ASEAN countries has decreased. This does not mean that the comparative advantage of the products of each country declines, but rather means that with decline in the average value of RSCA is possible because the product diversification in each country is growing. Second, the standard deviation calculation is a measure of statistical data dissemination. The larger the standard deviation value indicates that the more data the value is far from the average. If the data is close to the average magnitude, then the standard deviation value will move close to zero. The standard deviation value of the RSCA variable can be formulated as a follows.
ui 㤮 uliri
h uli ri uli ri
, where
ui 㤮 uliri is the standard deviation of RSCA country j (ASEAN) at time t
n is the number of observations (233, 3 digits STIC)
Figure 2 about here
In international trade a country will retain their products that have a comparative advantage, by increasing their production capacity. Thus the comparative advantage of the product will be greater, and other products of comparative advantages increase relatively lower, constant, or decreased comparative advantage. Under these conditions, the difference in the value of comparative advantage becomes increasingly enlarged, so that the data can be shown with the increasing standard deviation value.
From figure 2 it is shown that the differences in comparative advantages between products in ASEAN countries fluctuated from 1990-2015. But it is generally seen that during this period the difference in comparative advantage in ASEAN member countries is growing, judging by the increasing trend of standard deviation values. This shows that there is specialization in ASEAN member countries.
The decline in average values followed by an increase in the standard deviation value indicates that the occurance of product specialization has a high comparative advantage and a decline in products that have low comparative advantages, in addition there is the possibility of the emergence of new products that in the previous period have not entered the foreign market.
mode. Conversely, if the skewness value is negative, it indicates that the arithmetic mean is less than the median and mode. The formula for obtaining Skewness size is as follows.
ut uliri
㤮h uliri 㤮 h uliri
i 㤮 uliri
where
ut uliri is theskewnesscoefficient of RSCA importer
i 㤮 is the standard deviation j is a country (ASEAN)
t is time (2000, 2005, 2010, 2015)
The results of skewness calculation can be seen from the following table. Table 3 about here
In general from 1990 to 2015, the magnitude of skewness each ASEAN country gradually declined and showed positive results. A positive value for skewness indicates that ASEAN countries are more concentrated (specialization) on products that have low comparative advantages. Conversely, if the value of skewness shows negative, then it can be said that in the country more concentrated on products that have high comparative advantage. This suggests that the average ASEAN country is more concentrated on products that have low comparative advantage and over time, with the smaller value of skewness indicated that ASEAN countries are beginning to move towards specialization.
To see dynamic of comparative advantage between countries and between products can be used also econometric model as used by Laurseen (1998) and Widodo (2010).
uli r uli r
where uli r and uli r is Revealed Symmetric Comparative Advantage for country i with
uli r uli r
h
l uli r
The result of regression model above can be shown in the following equation. Table 4 about here
From the above equation, it is known that in the period 1990-2015 ASEAN as a whole specializes, this is shown by the coefficient of specialization for ASEAN is positive and is in the range between zero and one. The coefficients for each country can be obtained by summing the coefficient of ASEAN specialization with the coefficient of each country's dummy, as shown in the following table.
Table 5 about here
From the estimation results it is shown that the average from 1990 to 2015 all countries experienced an increase in the index of comparative advantage. From eight countries, it can be seen that Singapore and Cambodia have a relatively higher coefficient of specialization, followed by Indonesia, Malaysia and the Philippine. This indicates a specialization in the country.
Shift in The Pattern of Comparative Advantage
International trade theory suggests that country will exploit their products, which have comparative advantages, and then they become specialized on those products. The comparative advantages of those products become higher and higher, so the other products will relatively have smaller increase, constant or decrease in comparative advantage.
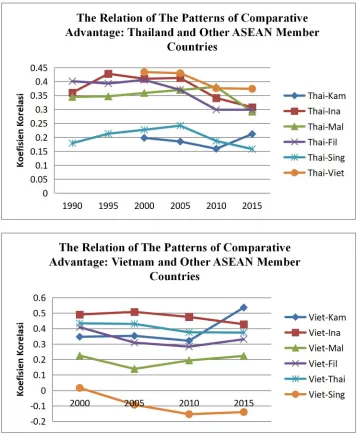
To see whether there is a structural change between comparative advantage during 1990 to 2015, we try to calculate using Spearman’s Rank Correlation to correlate between the magnitude of RSCA in two periods.
When viewed from each member country, it can that Singapore, Malaysia and Thailand relatively have a more dynamic change than other ASEAN countries. For the countries of Vietnam, Cambodia and Brunei, it can be shown that the relative changes are not so great.
Table 6 about here
The magnitude of correlation coefficient between two countries can be positive or negative. The positive coefficient and greater value indicate that the pattern of comparative advantage is increasingly the same between the two countries. This can be interpreted as the competition between the two countries is getting stronger in the export market. Conversely, the negative and smaller coefficient values indicate that there are differences in pattern in comparative advantage. This shows that between the two countries have complementary in offering its products in export market. The figure below shows the Spearman correlation coefficient trend among ASEAN countries.
Figure 3 about here
The coefficient of comparative advantage between Cambodia and other ASEAN countries such as Vietnam, Indonesia, Philippines and Thailand show a positive value, indicating a relatively similar pattern in comparative advantage or competition in the export market. The coefficient of comparative advantage between Cambodia, Malaysia and Singapore shows a declining trend, so it can be said that competition in export markets has decreased, and in the long run leads to complementarity between the two countries.
The coefficient of comparative advantage between Indonesia and another ASEAN countries is indicated by a declining trend, however the value is positive. Indonesia's correlation coefficient relations with Malaysia and Vietnam, has a relatively large value. This indicates that in the export market, Indonesia tends to compete with Malaysia and Vietnam.
The relationship between Malaysia and other ASEAN countries shows a negative trend, except Malaysia's relations with Vietnam. However, as explained above, it can be said that between Malaysia and Indonesia has a relatively high level of competition in the export market. A positive trend between Malaysia and Vietnam, it can be said that Malaysia's competition with Vietnam in export market is also getting bigger.
between the two countries. Nevertheless, the correlation coefficient between Thailand-Cambodia, Thailand-Indonesia and Thailand-Malaysia products is still relatively high. This indicates that there are certain products from the three pair of countries are still competing in the export market.
For the correlation coefficient between Thailand and Vietnam, even the value is relatively low but in 2010 to 2015 increased. This shows that Vietnamese products are starting to compete with Thai products in export markets. As explained earlier, Thailand and Vietnam share the comparative advantage of SITC 0 products (food and living animals). Of all couples only relations between Singapore and Vietnam have negative values, meaning that Singapore and Vietnam have very different products, and both countries have complementarity in offering their products in export markets.
Products Mapping
To see the catch up process among ASEAN countries, in this research will use mapping product analysis. This product mapping was developed to examine the Flying Geese pattern in which this paradigm tries to explain the phenomenon of industrial development in the pursuit of economic underdevelopment (Widodo, 2010). Trade are two important things in the Flying Geese (FG) pattern, namely comparative advantage and export-import (trade balance). thus the analysis tool is developed by combining two things, namely RSCA (Revealed Symmetric Comparative Advantage) as an indicator of comparative advantage and Trade Balance Index (TBI) as an indicator of export and import activities. RSCA is calculated by the formula discussed in the previous section. TBI is used to analysis whether a country has specialized in its export (as a net exporter) or in import (as a net importer) for a particular product group (STIC). TBI can be calculated by the formula :
TBIij= (xij- mij)/ (xij+ mij)
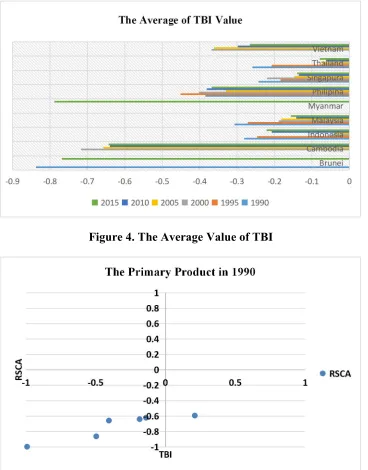
country exports and imports. Negative values indicate net importer and net exporter if the value of TBI is positive. The following is the development of TBI in ASEAN countries.
Figure 4 about here
From the picture above shows that the average value of TBI ASEAN countries ranged between -1 and +1. It can be said that ASEAN countries on average act as exporters and importers. Negative value can be interpreted that the countries are in net importer position.
Using the RSCA and TBI values, product mapping can be done. The product (STIC) can be categorized into four groups namely A, B, C and D. Group A consists of products having comparative advantages and export specialization, Group B represents a product that has comparative advantage but no export specialization; Group C represents a product that has an export specialization but does not have a comparative advantage; and group D which consist of products that have no comparative advantage nor export specialization.
Here is a product mapping in ASEAN countries. Table 7 shows the product mapping based on the comparative advantage and trade balances described above. The first column shows the image of the product mapping, and the second column shows the top ten product in group A. This product can be regarded as the best product produced in the country based on its comparative advantage and its trade balance index.
Table 7 about here
The Pattern of "Flying Geese"
The following will be discussed on the position of ASEAN countries in the Flying Geese pattern in ASEAN. In this case will be known what industry is the first, second and third rounds in the formation of Flying Geese. Where are each country's position within the Flying Geese pattern and what industries can be moved in the future based on the Flying Geese pattern. In this analysis the industry is categorized according to Empirical Trade Statistics (ETA) into 6 groups by grouping 3-digit SITC, namely:
a. Product group A: primary product (83 sectors)
b. Product group B: intensive product using natural resources (21 sectors) c. Product group C: intensive product using unskilled labor (26 sectors) d. Product group D: technology-intensive products (62 sectors)
f. Sectors not classified according to their intencity (5 sectors)
From the calculation results can be described "Product Mapping" for the industry. The image are through several stages (Widodo, 2010) namely, (1) calculate the RSCA and TBI index, (2) calculate the medias of RSCA and TBI for each classification, and (3) each industry classification, median RSCA and TBI plotted into "product mapping" for two observation periods.
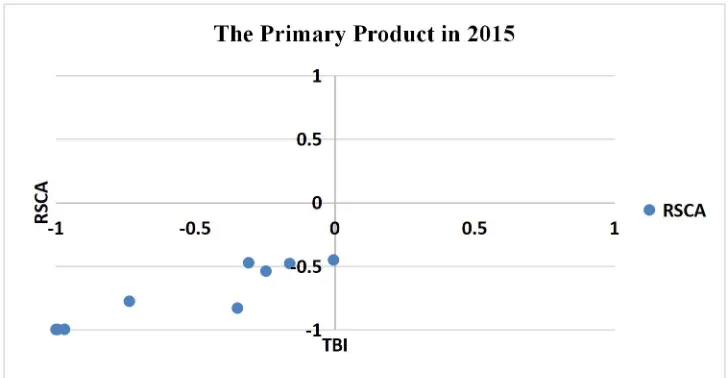
The following figure is an ASEAN Flying Gees pattern for the primary product industry. In 1990 Indonesia was a country with comparative advantage for industries producing primary products, followed by Thailand and Singapore. Indonesia products that have high comparative advantages such as natural gas and its preparations (SITC 341), latex and rubber (SITC 232)
By 2015 the condition change as this year, Thailand can replace Indonesia as the strongest producer of primary products in ASEAN. This year Malaysia can also surpass Indonesia as a lending country in the primary product industry. Malaysia managed to occupy second place after Thailand. Thai products for primary products include rubber products, rice, agricultural products such as fruit, fish and so on.
Figure 5 about here
The following figure is an ASEAN Flying Gees pattern for the intensive product industry using unskilled labor. In 1990 Thailand was a country with comparative advantage for industries that products using unskilled labor, followed by the Philippines and Malaysia. Thai products that have high comparative advantages such as apparel and textiles. In 2015 Indonesia succeeded Thailand as a producer of intensive products using the strongest unskilled labor force in ASEAN. Thailand was ranked second followed by the Philippines.
Figure 6 about here
The following figure is an ASEAN Flying Gees pattern for technology-intensive product industry. In 1990 Singapore took the lead in the excellence of producing technology-intensive products. Malaysia ranks second after Singapore. Some Singaporean products have high comparative advantages such as data processing machines and medical equipment. By 2015 the conditions remain unchanged as this year Singapore and Malaysia remain in the same position. Followed by Thailand as the third rank in producing technology-intensive products.
Figure 7 about here
up” in ASEAN member countries is not running as expected because the country that leads in the composition of flying gees only consists of certain countries only.
4. Conclusion
ASEAN featured product in 1990 was dominated by SITC 0 product (food and live animals), after twenty years of operation, by 2015 SITC 7 (machinery and transportation) products are relatively more dominant in ASEAN export products. In 1990-2015 period, it is shown that the average magnitude of RSCA in ASEAN countries has decreased. It does not mean that the comparative advantage of the products of each country declines, but rather means that with decline in the average value of RSCA is possible because the product diversification in each country is growing. The decline in average values followed by an increase in the standard deviation value indicates that the occurance of product specialization has a high comparative advantage and a decline in products that have low comparative advantages, in addition there is the possibility of the emergence of new products that in the previous period have not entered the foreign market. Using a significance level 5%, it appears that ASEAN countries as a whole are experiencing significant dynamic changes in comparative advantage. Nevertheless, all countries on average have relatively low rates of change in the pattern of comparative advantage. In several member countries, it can be shown that Singapore, Malaysia and Thailand relatively have a more dynamic change than other ASEAN countries. From the pattern of Flying Gees, it can be said that the process of “catch up” in ASEAN member countries is not running as expected because the country that leads in the composition of flying gees only consists of certain countries only, namely Singapore, Malaysia, Indonesia, Thailand and Philippines.
References
Appleyard, D. R., Alfred J. Field, J., & Cobb, S. L. (2008).International Economics. Singapore: McGraw Hill Irwin.
Aron, Janine. (2000). Growth and Institutions : A Review of the Evidence. The World Bank Research Observer, Vol. 15 No. 1 (February 2000), pp. 99-135.
Arguello, R. C. (2000). Economic Integration. An Overview of Basic Economic Theory and other Related Issues.Economia No.3 Marzo de 2000.
ASEAN Development Bank, (2014). ASEAN 2030 Toward of Borderless Economic Community.
Balassa, B. (1961).The Theory of Economic Integration. Richard D Irwin, Illinois
Bank Indonesia. (2008).Masyarakat Ekonomi ASEAN (MEA) 2015 : memperkuat Sinergi ASEAN di Tengah Kompetisi Global.Jakarta: PT Alex Media Komputindo.
Bowen, H., Hollander, A., & Marie Viaene, J. (2001). Applied International Trade Analysis.
Michigan: The University of Michigan Press.
Cipto, B. (2010). Hubungan Internasional di Asia Tenggara, Teropong terhadap Dinamika, Realitas, and Masa Depan.Yogyakarta: Pustaka Pelajar.
Crowley, P. M. (2006). Is There a logical Integration Sequence after EMU?Journal of Economic Integration 21(1) March 2006, 1-20.
Green, W. H. (2000).Econometric Analysis.New Jersey: Prentice Hall.
Gujarati, D., & Porter, D. (2009). Basic Econometrics (5 ed.). Singapore: McGraw-Hill International Edition.
Hill, C. W., Wee, C.-H., & Udayasankar, K. (2012). International Business : An Asian Perspective.Singaphore: McGraw Hill.
Kimura, F. (2013, October). Reconstructing the Concept of Single Market and Production Base for ASEAN Beyond 2015.ERIA Discussion Series.
Krugman, P. R. (1987). Is Free Trade Passe?Journal of Economic Perspectives, 131-44.
Laursen, K. (1998). Revealed Comparative Advantage and the Alternative as Measures of International Specification.DRUID Working Paper No 98-30.
Lululima, C. (2011).Dinamika Asia Tenggara Menuju 2015.Yogyakarta: Pustaka Pelajar.
Lululima, C., Anwar, D. F., Bhakti, I. N., Siregar, Y., & Inayati, R. S. (2008). Masyarakat Asia Tenggara Menuju Komunitas ASEAN 2015.Yogyakarta: Pustaka Pelajar.
Madani, D. (2001). Regional Integration and Industrial Growth Among Developing Countries : The Case of Three ASEAN Members.New York: World Bank.
Mc Carthy C. (2002). SADC Macroeconomic Convergence Workshop Convergence in SADC. Away Forward Report to The SADC Committee of Ministers of Finance and Investment, July 2002.
Mete, F. O. (2011). Analyzing The Impact of Globalization on Economic Development in Developing Economies : An Application of Error Correction Modelling (ECM) to Nigeria.Journal of Economic Integration.
Naya, S. a. (1991). ASEAN Economic Cooperation in the New International Economic Environment.ASEAN Economic Bulletin, 261-276.
Okabe, Misa & Shojiro Urata. (2013). The Impact of AFTA on Intra AFTA Trade. ERIA Discussion Paper, DP 2013-05
Okabe, Misa. (2015). Impact of free Trade Agreements on Trade in East Asia.ERIA Discussion Paper Series. ERIA-DP-2015-01
Verbeck, M. (2012). A Guide to Modern Econometrics (4 ed.). West Sussex, United Kingdom: John Wiley & Sons Ltd.
Vollrath, T. L. (1991). A Theoretical Evaluation of Alternative Trade Intensity Measures of Revealed Comparative Advantage.Weltwirtschaftliches Archiv, 265-280.
Weatherbee, D. E. (2010). International Relations in Southeast Asia (2 ed.). Singapore: ISEAS Publishing.
Widgeon, A. (2013).Trigonometric, Pantagruel and Alkalinity.Yogyakarta: UPP STIM YKPN.
Widodo, T. (2009). Dynamic Comparative Advantage in ASEAN +3. Journal of Economic
Integration , 24(3), 505-529.
Widodo, T. (2010). Market Dynamics in The EU, NAFTA, North East Asia and ASEAN : The method of Constant Market Shares (CMS) Analysis. Journal of Economic Integration , 25(3).
Williamson, O. (1985). The Economic Institutions of Capitalism : Firm, Markets, Relational Contracting(New York: The Free Press)
World Bank, (2015).World Development Indicators.World Bank.
Table 1. Competitiveness from 140 countries in the world 2016-2017
Top 10 Ranking Countries ASEAN Countries
Country Ratings Country Ratings
Switzerland 1 Malaysia 25 (previous rankings 18)
Singapore 2 Brunei Darussalam 58 (during 2013-2014 rankings 26)
United State 3 Thailand 34 (previous rankings 32)
Netherlands 4 Indonesia 41 (previous rankings 37)
German 5 Philippines 57 (previous rankings 47)
Sweden 6 Vietnam 60 (previous rankings 56)
United Kingdom 7 Lao PDR 93 (previous rankings 83)
Japan 8 Cambodia 89 (previous rankings 90)
Hong Kong 9 Myanmar 131 (data from 2015-2016)
Finland 10
Table 2.
The Comparative Advantages in ASEAN member countries in 1990 and 2015
Country Year Top twenty SITC Products
ASEAN 1990 232, 424, 687, 431, 42,245, 75, 341, 247, 37, 36, 72, 762, 334, 776, 47, 761, 248, 763
2015 232, 424, 687, 431, 776, 42, 37, 848, 683, 881, 762, 335, 898, 14, 759, 512, 752, 751, 621, 334
Brunei 1990 341, 333, 334
2015 341, 333, 512, 513, 883
Cambodia 1990 845, 892, 846, 233, 634, 232, 842, 843, 269, 851, 844, 223, 848, 971, 847, 658, 655, 248, 22, 692
2015 110, 211, 212, 14, 43, 215, 200, 210, 106, 209, 208, 213, 220, 207, 126, 58, 191, 25, 109, 214
Indonesia 1990 634, 232, 341, 75, 687, 245, 424, 36, 656, 74, 333, 71, 72, 287, 431, 635, 653, 842, 844, 851
2015 424, 232, 687, 322, 431, 245, 91, 634, 75, 267, 72, 289, 36, 287, 651, 71, 341, 251, 37, 844
Lao PDR 1990 -2015
-Malaysia 1990 424, 232, 247, 687, 431, 72, 762, 248, 776, 341, 634, 223, 75, 848, 761, 333, 621, 897, 763, 771
2015 424, 431, 678, 848, 232, 335, 683, 776, 72, 634, 91, 762,341, 247, 685, 512, 898, 621, 761, 513
Myanmar 1990
-2015 77, 74, 84,85, 222, 203, 153, 65, 154, 180, 219, 177, 156, 141, 168, 179, 137, 35, 234, 164
Philippines 1990 424, 289, 245, 931, 265, 223, 36, 37, 58, 287, 899, 57, 61, 628, 635, 773, 846, 883, 845, 634
2015 635, 245, 776, 881, 424, 265, 287, 773, 58, 771, 752, 37, 793, 759, 726, 884, 121, 57, 778, 682
Singapore 1990 232, 334, 687, 762, 752, 75, 431, 761, 763, 776, 72, 245, 335, 91, 515, 759, 764, 111, 424, 122
2015 776, 687, 898, 334, 683, 514, 881, 759, 512, 723, 714, 277, 511, 551, 122, 728, 583, 233, 515, 553
Thailand 1990 42, 232, 37, 47, 36, 61, 54, 687, 58, 897, 62, 842, 846, 667, 56, 843, 844, 831, 851, 759
2015 232, 42, 37, 14, 47, 61, 762, 592, 266, 782, 621, 751, 58, 741, 267, 111, 625, 763, 246, 98
Vietnam 1990 42, 36, 75, 245, 71, 232, 851, 74, 844, 842, 35, 57, 333, 843, 831, 687, 261, 34, 424, 663
2015 881, 246, 75, 42, 851, 232, 71, 842, 37, 844, 36, 764, 613, 845, 843, 751, 651, 34, 846, 831
Table 3. The Skewness of ASEAN Member Countries’ RSCA 1990-2015
Country 1990 1995 2000 2005 2010 2015
Brunei 6,169 - - - - 4,781
Cambodia - - 2,872 3,042 2,663 2,258
Indonesia 1,144 0,885 0,527 0,573 0,717 0,575
Lao PDR - - -
-Malaysia 1,079 1,072 1,051 0,883 0,706 0,484
Myanmar - - - 4,781
Philippines 1,165 1,458 1,325 1,118 1,128 0,911
Singaphore 0,751 0,721 0,756 0,748 0,808 0,767
Thailand 0,686 0,510 0,288 0,267 0,263 0,231
Vietnam - - 1,155 0,950 0,663 0,682
ASEAN 0,576 0,463 0,413 0,272 0,193 0,169
Table 4. The Estimation of Regression Equation Dependent Variable: RSCAij,T
Independent
Variable Coefficient standard error t-statistic Prob
Constant -0,300 0,013 -23,248 0,000
RSCAij,0 0,078 0,012 6,498 0,000
DInaRSCAij,0 0,309 0,043 7,143 0,000
DMalRSCAij,0 0,248 0,046 5,372 0,000
DFilRSCAij,0 0,302 0,042 7,158 0,000
DSingRSCAij,0 0,406 0,055 7,443 0,000
DThaiRSCAij,0 0,209 0,046 4,562 0,000
DBruRSCAij,0 -0,063 0,013 -4,876 0,000
DKamRSCAij,0 0,487 0,037 13,168 0,000
DVietRSCAij,0 0,315 0,043 7,384 0,000
Fstat : 66,838*
R2 : 0,470
Source : Author,s calculation
Table 5 The Specialization Coefficient
Source : Author,s calculation
Country Specialization
Coefficient SpecializationCoefficient
ASEAN 0,078
Indonesia h 0,387
Malaysia 0,326
Philippines 0,380
Singaphore 0,484
Thailand 0,287
Brunei 0,015
Cambodia 0,565
[image:26.612.162.529.504.667.2]Table 6 Spearman’s Rank Correlation Coefficients Across Period
Philippines Comparative Advantage
1990 1995 2000 2005 2010 2015
Comparative Advantage
1990 1 0,827 0,711 0,615 0,598 0,438 1995 0,827 1 0,800 0,680 0,672 0,490 2000 0,711 0,800 1 0,869 0,752 0,661 2005 0,615 0,680 0,869 1 0,792 0,719 2010 0,598 0,672 0,752 0,792 1 0,727 2015 0,438 0,490 0,661 0,719 0,727 1
Singaphore Comparative Advantage
1990 1995 2000 2005 2010 2015
Comparative Advantage
1990 1 0,874 0,851 0,744 0,655 0,557 1995 0,874 1 0,921 0,843 0,758 0,684 2000 0,851 0,921 1 0,909 0,825 0,747 2005 0,744 0,843 0,909 1 0,928 0,849 2010 0,655 0,758 0,825 0,928 1 0,909 2015 0,557 0,684 0,747 0,849 0,909 1
Indonesia Comparative Advantage
1990 1995 2000 2005 2010 2015
Comparative Advantage
1990 1 0,858 0,749 0,796 0,753 0,713 1995 0,858 1 0,828 0,901 0,844 0,776 2000 0,749 0,828 1 0,880 0,927 0,918 2005 0,796 0,901 0,880 1 0,900 0,800 2010 0,753 0,844 0,927 0,900 1 0,865 2015 0,713 0,776 0,918 0,800 0,865 1
Malaysia Comparative Advantage
1990 1995 2000 2005 2010 2015
Comparative Advantage
1990 1 0,880 0,801 0,711 0,660 0,569 1995 0,880 1 0,900 0,822 0,781 0,695 2000 0,801 0,900 1 0,916 0,878 0,769 2005 0,711 0,822 0,916 1 0,933 0,787 2010 0,660 0,781 0,878 0,933 1 0,854 2015 0,569 0,695 0,769 0,787 0,854 1
Thailand Comparative Advantage
1990 1995 2000 2005 2010 2015
Comparative Advantage
1990 1 0,898 0,863 0,694 0,600 0,551 1995 0,898 1 0,863 0,778 0,695 0,626 2000 0,800 0,863 1 0,898 0,779 0,724 2005 0,694 0,778 0,898 1 0,888 0,817 2010 0,600 0,695 0,779 0,888 1 0,925 2015 0,551 0,626 0,724 0,817 0,925 1
ASEAN
Comparative Advantage
1990 1995 2000 2005 2010 2015
Comparative
Advantage 2005 0,751 0,843 0,927 1 0,930 0,730 2010 0,701 0,794 0,867 0,930 1 0,774 2015 0,521 0,597 0,659 0,730 0,774 1
Vietnam
Comparative Advantage
1990 1995 2000 2005 2010 2015
Comparative Advantage
1990 1 - - - -
-1995 - 1 - - -
-2000 - - 1 0,802 0,682 0,640
2005 - - 0,802 1 0,819 0,752
2010 - - 0,682 0,819 1 0,867
2015 - - 0,640 0,752 0,867 1
Cambodia Comparative Advantage
1990 1995 2000 2005 2010 2015
Comparative Advantage
1990 1 - - - -
-1995 - 1 - - -
-2000 - - 1 0,835 0,645 0,585
2005 - - 0,835 1 0,712 0,602
2010 - - 0,645 0,712 1 0,634
2015 - - 0,585 0,602 0,634 1
Brunei
Comparative Advantage
1990 1995 2000 2005 2010 2015
Comparative Advantage
1990 1 - - - - 0,558
1995 - 1 - - -
-2000 - - 1 - -
-2005 - - - 1 -
-2010 - - - - 1
2015 0,558 - - - - 1
Table 7. "Product Mapping": Top ten Product in Group A 1990-2015
Brunei
Top Ten product in Group A
STIC Product Description
341 Gas, natural and manufactured
333 Crude petroleum and oil obtained from bituminous minerals
334 Petroleum products, refined
Top Ten product in Group A
STIC Product Description
341 Gas, natural and manufactured
333 Crude petroleum and oil obtained from bituminous minerals
512 Alcohols, phenols etc, and their derivatives 513 Carboxylic acids, and their derivatives 883 Cinematograph film, exposed and developed
Cambodia
Top Ten product in Group A
STIC Product Description
845 Outerwear knitted or crocheted, not elastic nor rubberized
892 Printed matter
846 Under-garments, knitted or crocheted
233 Synthetic rubber, latex, etc; waste, scrap of unhardened rubber
634 Veneers, plywood, improved" wood and other wood worked nes"
232 Natural rubber latex; rubber and gums
[image:29.612.78.555.95.721.2]crocheted
843 Women, girls, infants outerwear, textile, not knitted or crocheted
269 Old clothing and other old textile articles; rags
851 Footwear
Top Ten product in Group A
STIC Product Description
110 Furskins, tanned or dressed; pieces of furskin, tanned or dressed
211 Outerwear knitted or crocheted, not elastic nor rubberized
212 Under-garments, knitted or crocheted
14 Rice
43 Natural rubber latex; rubber and gums
215 Footwear
200 Cycles, scooters, motorized or not; invalid carriages
210 Under garments of textile fabrics, not knitted or crocheted
106 Starches, insulin and wheat gluten; albuminoidal substances; glues
209 Women, girls, infants outerwear, textile, not knitted or crocheted
Indonesia
Top Ten product in Group A
STIC Product Description
634 Veneers, plywood, improved" wood and other wood worked nes"
232 Natural rubber latex; rubber and gums
341 Gas, natural and manufactured
75 Spices
687 Tin
245 Fuel wood and wood charcoal
424 Other fixed vegetable oils, fluid or solid, crude, refined
etc
656 Tulle, lace, embroidery, ribbons, trimmings and other small wares
74 Tea and mate
Top Ten product in Group A
STIC Product Description
424 Other fixed vegetable oils, fluid or solid, crude, refined
232 Natural rubber latex; rubber and gums
687 Tin
322 Coal, lignite and peat
431 Animal and vegetable oils and fats, processed, and waxes
245 Fuel wood and wood charcoal
91 Margarine and shortening
634 Veneers, plywood, improved" wood and other wood worked nes"
75 Spices
267 Other man-made fibres suitable for spinning, and waste
Malaysia
Top Ten product in Group A
STIC Product Description
424 Other fixed vegetable oils, fluid or solid, crude, refined
232 Natural rubber latex; rubber and gums
247 Other wood in the rough or roughly squared
687 Tin
431 Animal and vegetable oils and fats, processed, and waxes
72 Cocoa
762 Radio-broadcast receivers
776 Thermionic, microcircuits, transistors, valves, etc
341 Gas, natural and manufactured
Top Ten product in Group A
STIC Product Description
424 Other fixed vegetable oils, fluid or solid, crude, refined
431 Animal and vegetable oils and fats, processed, and waxes
687 Tin
848 Articles of apparel, clothing accessories, non-textile, headgear
232 Natural rubber latex; rubber and gums
335 Residual petroleum products, nes and related materials
683 Nickel
776 Thermionic, microcircuits, transistors, valves, etc
72 Cocoa
634 Veneers, plywood, improved" wood and other wood worked nes"
Philippines
Top Ten product in Group A
STIC Product Description
424 Other fixed vegetable oils, fluid or solid, crude, refined
289 Ores and concentrates of precious metals, waste, scrap
245 Fuel wood and wood charcoal
931 Special transactions, commodity not classified according to class
265 Vegetable textile fibres, excluding cotton, jute, and waste
223 Seeds and oleaginous fruit, whole or broken, for other fixed oils
36 Crustaceans and molluscs, fresh, chilled, frozen, salted, etc
nes
58 Fruit, preserved, and fruits preparations
287 Ores and concentrates of base metals, nes
Top Ten product in Group A
STIC Product Description
635 Wood manufactures, nes
245 Fuel wood and wood charcoal
776 Thermionic, microcircuits, transistors, valves, etc
881 Photographic apparatus and equipment, nes
424 Other fixed vegetable oils, fluid or solid, crude, refined
265 Vegetable textile fibres, excluding cotton, jute, and waste
287 Ores and concentrates of base metals, nes
773 Equipment for distribution of electricity
58 Fruit, preserved, and fruits preparations
189 Electric power machinery, and parts thereof, nes
Singapore
Top Ten product in Group A
STIC Product Description
232 Natural rubber latex; rubber and gums
334 Petroleum products, refined
687 Tin
762 Radio-broadcast receivers
752 Automatic data processing machines and units thereof
75 Spices
431 Animal and vegetable oils and fats, processed, and waxes
761 Television receivers
Top Ten Products
STIC Product Description
776 Thermionic, microcircuits, transistors, valves, etc
687 Tin
898 Musical instruments, parts and accessories thereof
334 Petroleum products, refined
683 Nickel
514 Nitrogen-function compounds
881 Photographic apparatus and equipment, nes
759 Parts, nes of and accessories for machines of headings 751 or 752
512 Alcohols, phenols etc, and their derivatives
Thailand
Top Ten product in Group A
STIC Product Description
42 Rice
232 Natural rubber latex; rubber and gums
37 Fish, crustaceans and molluscs, prepared or preserved, nes
47 Other cereal meals and flour
36 Crustaceans and molluscs, fresh, chilled, frozen, salted, etc
61 Sugar and honey
54 Vegetables, fresh or simply preserved; roots and tubers, nes
687 Tin
58 Fruit, preserved, and fruits preparations
materials, nes
Top Ten product in Group A
STIC Product Description
232 Natural rubber latex; rubber and gums
42 Rice
37 Fish, crustaceans and molluscs, prepared or preserved, nes
14 Meat and edible meat offal, prepared, preserved, nes; fish extracts
47 Other cereal meals and flour
61 Sugar and honey
762 Radio-broadcast receivers
592 Starches, insulin and wheat gluten; albuminoidal substances; glues
266 Synthetic fibres suitable for spinning
782 Lorries and special purposes motor vehicles
Vietnam
Top Ten product in Group A
STIC Product Description
42 Rice
36 Crustaceans and molluscs, fresh, chilled, frozen, salted, etc
75 Spices
245 Fuel wood and wood charcoal
71 Coffee and coffee substitutes
232 Natural rubber latex; rubber and gums
851 Footwear
74 Tea and mate
844 Under garments of textile fabrics, not knitted or crocheted
Top Ten product in Group A
STIC Product Description
220 Photographic apparatus and equipment, nes
47 Pulpwood (including chips and wood waste)
31 Spices
14 Rice
215 Footwear
43 Natural rubber latex; rubber and gums
27 Coffee and coffee substitutes
208 Men's and boys' outerwear, textile fabrics not knitted or crocheted
12 Fish, crustaceans and molluscs, prepared or preserved, nes
Figure 1. The RSCA Arithmetic Mean in ASEAN Member Countries 1990-2015
[image:37.612.139.504.354.538.2]