J. Range Manage.
57:148 -152 March 2004
Stocking rate, precipitation, and herbage production on
sand sagebrush
-grassland
ROBERT L. GILLEN AND PHILLIP L. SIMS
Authors are Rangeland Scientists, Southern Plains Range Research Station, USDA -ARS, 2000 18th Street, Woodward, Okla. 73801.
Abstract
Knowledge of the relationship between stocking rate or grazing intensity and plant production is fundamental to the sustainable management of rangelands. The general management paradigm is that plant production declines as stocking rate increases. Our objectivewasto determine the impact of stocking rate on herba- ceous production of a sand sagebrush (Artemisia filifolia Torr.)- grassland. Stocking rates averaging 43, 57, and 85 animal -unit- days há' (AUD ha"') for year -round grazing were applied from 1941 to 1961. Herbaceous plant production was determined by sampling standing crop in temporary exclosures at the end of the growing season from 1958 to 1961, the last 4 years of the grazing study. Total herbaceous production averaged over stocking rates andyears was1,490 kg ha'. Grasses contributed 89% of the total while forbs contributed 11 %. Total production averaged 1,540, 1,470, and 1,450 kg ha' for stocking rates of 43, 57, and 85 AUD há' y "', respectively. There were no differences among stocking rates for total production or for the production of any individual grass species (P > 0.05). Forb production was also not affected by stocking rate, averaging 200, 140, and 120 kg ha "' for stocking rates of 43, 57, and 85 AUD ha-1 y' (P > 0.05). Differences in pro- duction amongyears were much greater than differences among stocking rates for all vegetation components. Little bluestem [Schizachyrium scoparium (Michx.) Nash] and sand lovegrass [Eragrostis trichodes (Nutt.) Wood] showed the greatest responses to favorable precipitation. Herbaceous production of this sand sagebrush - grassland was little affected by 20 years of differential stocking rates.
Key Words: grazing intensity, mixed prairie, biomass, composition
Knowledge of the relationships between stocking rate or graz- ing intensity and plant production is fundamental to the sustain- able management of rangelands. Stocking rate is generally con-
The authors acknowledge the contributions of D. A. Savage (deceased), E. H.
Mcllvain (retired), M. C. Shoop (retired), the Southern Plains Experimental Range technicians, and Sherry Dewald and other personnel at the Southern Plains Range Research Station for their assistance in this work. The cooperation and contribu- tion to the research of the Pecos Anderson Family, owners, Canadian River Cattle Co., Canadian, Tex., is appreciated.
All programs and services of the U. S. Department of Agriculture are offered on a nondiscriminatory basis without regard to race, color, national origin, religion, sex, age, marital status or handicap.
Names are necessary to report factually on available data, however, the USDA neither guarantees nor warrants the standard of the product, and the use of the name by USDA implies no approval of the product to the exclusion of others that may also be suitable.
Manuscript accepted 24 Jun. 03.
Resumen
El conocimiento de la relación entre la carga animal o la inten- sidad del apacentamiento con la producción de las plantas es fundamental para un manejo sustentable de los pastizales. El paradigma general de manejo es que la producción de la planta disminuye al incrementar la carga animal. Nuestro objetivo fue determinar el impacto de la carga animal en la producción her- bácea de un una comunidad de "Sand sagebrush" (Artemisia fili- folia Torr.)- pastizal. De 1941 a 1961 se aplicaron cargas animal que promediaron 43, 57, y 85 unidades- animal- día ha' (AUD ha -1) bajo un sistema de apacentamiento continuo. La produc- ción herbácea se determinó muestreando la biomasa en pie den- tro de exclusiones temporales al final de la estación de crecimien- to de los últimos 4 años del estudio de apacentamiento (de 1958 a 1961). La producción total herbácea promedio de todas las car- gas animal fue de 1,490 kg ha'. Los zacates contribuyeron con el 89% del total mientras que las hierbas aportaron el 11 %. La producción total promedio 1,540, 1,470 y 1,450 kg ha' para las cargas de 43, 57, y 85 AUD ha"' año' respectivamente. No hubo diferencia entre las cargas animal respecto a la producción total ni para la producción de las especies individuales de zacates (P >
0.05). La producción de hierbas tampoco fue afectada por la carga animal, promediando 200, 140, y 120 kg ha "' para las car-
gasanimal de 43, 57, y 85 AUD ha' año"' (P > 0.05). Las diferen- cias en producción entre años fueron mucho mayores que las diferencias entre cargas animal, esto fue igual para todos los
componentes de la vegetación. El "Little bluestem"
[Schizachyrium scoparium (Michx.) Nash] y "Sand lovegrass"
[ Eragrostis trichodes (Nutt.) Wood] mostraron la mayor respues- ta a la precipitación favorable. La producción de esta comunidad de "Sand sagebrush" (Artemisia filifolia Torr.)- pastizal fue poco afectada por los 20 años cargas animales diferenciales a las que estuvo sometida.
sidered the primary factor in grazing management of Great Plains grasslands over periods of 10 or more years. The general manage- ment paradigm is that plant production declines as stocking rate increases (Holechek et al. 1995).
A global analysis of grazing intensity and plant production found that as grazing intensity increases, aboveground net prima- ry productivity generally decreases (Milchunas and Lauenroth 1993). However, the relationship was weak and dependent on overall site productivity and evolutionary history of grazing.
Previous studies on sandy rangelands in the western Great Plains reported a decrease of 20 to 25% in annual herbaceous produc- tion over time as stocking rates were doubled (Burzlaff and Harris 1969, Sims et al. 1976). Responses of individual species
were variable with little change in 1 study (Burzlaff and Harris 1969) and clear direc- tional changes for individual species in the second study (Sims et al. 1976).
A 20 -year research project was initiated in 1941 at the Southern Plains Experimental Range to determine the impact of stocking rate on sand sagebrush grassland of the Southern Great Plains. This paper reports the response of herbaceous production to different stocking rates as measured over the final 4 years of this long -term study. Our hypothesis was that herbaceous production would decline as stocking rate increased.
Materials and Methods The Southern Plains Experimental Range (SPER) is located in northwestern Oklahoma 27 km northwest of Woodward (99° 23' W, 36° 27' N, elevation 610 -640 m). The long -term (1940 to 2000) average precipitation is 576 mm with 77% of this amount occurring during the April -to- October growing season.
The landscape is gently rolling, stabi- lized sand dunes frequently interspersed with areas of heavier textured soils with no well- defined drainage patterns. Eda loamy sands (formerly designated as Pratt;
mixed, thermic Lamellic Ustipsamments) are on lower slopes and interdune areas, and Tivoli fine sands (mixed, thermic Typic Ustipsamments) occur on upper slopes. The vegetation is dominated by sand sagebrush (Artemisia filifolia Torr.), which had an average canopy cover of 38% during the period of study. The
herbaceous understory is a mixture of tall, mid, and short warm- season grasses, and forbs. Classified as sandsage bluestem (Artemisia- Andropogon) prairie by
Kuchler (1964, 1975), this vegetation type dominates the landscape along the major rivers that flow diagonally across the Southern Plains (Berg 1994).
Experimental Treatments
A range of grazing intensity treatments was selected to determine the sustainable level of long -term forage utilization. Three stocking rates with continuous grazing were initiated in 1941 with 2 replications.
Treatment pastures ranged in size from 43 to 86 ha. For the 1941 to 1951 period, the 3 stocking rate treatments were 41, 53, and 82 animal- unit -days (AUD) ha-1 y' (Sims and Gillen 1999). Each steer was 0.67 animal unit, based on average initial weight of 213 ± 11 kg (SE) and an aver- age gain of 168 kg hd-' for the 320 -day
grazing season (13 Nov. to 29 Sep.).
During the cow -calf phase of the study, from 1952 to 1961, the stocking rates were increased slightly to 45, 60, and 87 AUD ha' y", and cattle grazed the pastures
year - round. This resulted in average stock- ing rates over the entire period of study of 43, 57, and 85 AUD ha-1 y'. The middle stocking rate was set so that approximate- ly 2/3 of the annual herbage production would be utilized by the end of the dor- mant season, about April 20 (Shoop and Mcllvain 1971). This resulted in a 25 -mm stubble on the shortgrasses and a 75- to 100 -mm stubble on the tall grasses by late winter.
Herbage measurements
Annual production was estimated by sampling herbage standing crop in exclo- sures in all treatment pastures at the end of the growing season from 1958 to 1961, the last 4 years of the grazing study. The aver- age sample date was 5 November with a
range from early October to late
November.
Standing crop of herbage was deter- mined using the micro -unit forage inven- tory method described by Shoop and Mcllvain (1963), a variation of the weight estimate method (Pechanec and Pickford 1937). All measurements were estimates.
Shoop and Mcllvain (1963) reported that the method tended to underestimate stand- ing crop by about 8% compared to clip- ping. Maintenance of accuracy was
addressed by using experienced field per- sonnel who trained before sampling peri- ods and checked their estimates by clip- ping about every tenth plot.
Four quadrats, 0.29 x 0.61 m, were esti- mated within portable barbed -wire exclo- sures measuring 3.7 x 3.7 m. Twenty exclosures were placed in each pasture and were moved to new locations each year. Standing crop of current year's herbage was recorded separately for the most prominent grasses and for forbs as a
group. Grasses estimated separately
included sand bluestem [Andropogon hal- lii Hack.], little bluestem [Schizachyrium scoparium (Michx.) Nash], sand lovegrass [Eragrostis trichodes (Nutt.) Wood], sand paspalum [Paspalum setaceum Michx.], fall witchgrass [Digitaria cognata var.
cognata (J.A. Schultes) Pilger], sand dropseed [Sporobolus cryptandrus (Ton.) Gray], and blue grama [Bouteloua gracilis (Willd. ex Kunth) Lag. ex Griffiths]. All other grasses were lumped into a miscella- neous grass component.
Data Analyses
Herbage production data were analyzed as a completely randomized design using analysis -of- variance with repeated mea- sures. Stocking rate was the main plot fac- tor and year was the repeated factor.
Separate analyses were performed for all individual grasses that contributed more than 5% of annual herbaceous production, total grasses, forbs, and total herbaceous production. PROC MIXED (Version 8;
SAS Institute Inc., 1999) was used for all analyses with the covariance structure specified as first -order autoregressive. If treatment effects were significant (P <
0.05), all pair -wise comparisons were made within a given treatment. The Tukey procedure was used to adjust P- values for these families of comparisons.
Results Precipitation
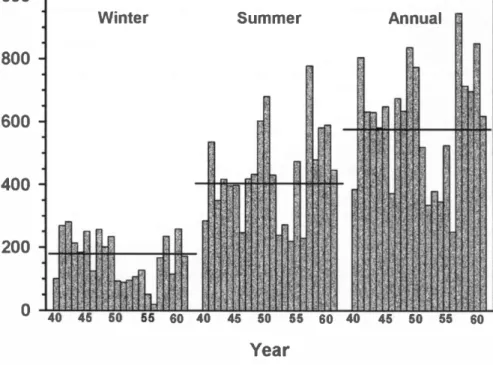
Precipitation patterns can be grouped into 3 distinct periods over the course of the study (Fig. 1). Precipitation from 1941 to 1950 averaged 659 mm, which is 14%
above the long -term average of 576 mm.
A severe drought occurred from 1951 until 1956. During this period, annual precipita- tion averaged 393 mm, about 64% of the long -term average, winter precipitation was consistently below the norm, and summer rainfall exceeded the average only in 1955. Precipitation was again high, averaging 765 mm, in the period 1957 to 1961. Summer and annual precipitation was above average every year during this period. Our data were collected during a period of favorable precipitation when the vegetation was recovering from a major drought.
Annual Production
Total annual production from herba- ceous species was 1,490 kg ha' when averaged over stocking rates and years.
Grasses comprised 89% of the herbaceous standing crop and 11% was contributed by forbs. Six grasses individually contributed between 10 and 15% of total production, the 3 most productive were blue grama, sand lovegrass, and sand paspalum.
Common forbs included annual buck- wheat (Eriogonum annuum Nutt.), horse weed (Conyza canadensis (L.) Cronq.), and whitemouth dayflower (Commelina erecta L.).
Stocking Rate Effects. After 17 to 20 years of treatment, stocking rate had little impact on herbaceous production. There were no differences among stocking rates
1000
800
600
400
200
Winter Summer Annual
40 45 50 55 60 40 45 50 55 60 40 45 50 55
Year
60
Fig. 1. Winter, summer, and annual precipitation (mm) from 1940 to 1961 at the Southern Plains Experimental Range, Fort Supply, Okla.
ages (1940-2000).
for total production or for the production of any component (Table 1, P > 0.05).
This lack of impact was consistent over years as the stocking rate -by -year interac- tion was not significant for any compo- nent (P > 0.05).
Relative composition was not impacted by stocking rate with 1 exception (Table 1). Sand dropseed was affected by the interaction of stocking rate and year (Table 2, P = 0.02). The relative composition of sand dropseed was similar among stocking rates for the first 3 years but increased at the highest stocking rate in 1961.
Horizontal lines indicate long -term aver-
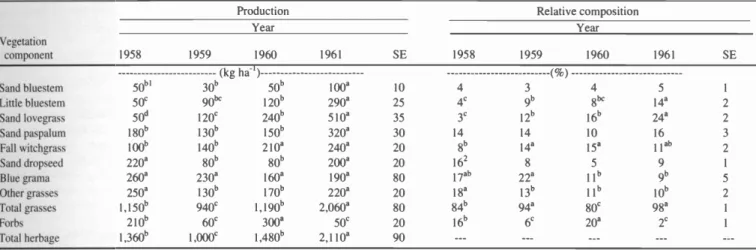
Year Effects. Production varied (P <
0.05) over years for all components except blue grama (Table 3). Relative composi- tion also varied over years for most com-
ponents; the exceptions were sand bluestem and sand paspalum (Table 3).
Little bluestem and sand lovegrass had the largest directional changes over the study period. Production increased by factors of 6 for little bluestem and 10 for sand love - grass between 1958 and 1961. Relative composition also showed large positive responses over time for these 2 grasses.
Production of sand dropseed and blue
Table 1. Herbaceous production and relative composition as affected by stocking rate, 1958 -1961.
Production Relative composition
Stocking rate (AUD há' y')
Stocking rate (AUD ha' y')
43 57 85 SE 43 57 85 SE
Vegetation
Component (kg há') ( %)
Sand bluestem 601 70 50 10 4 4 4 1
Little bluestem 180 160 80 25 11 10 6 2
Sand lovegrass 270 280 130 40 15 18 9 2
Sand paspalum 180 210 190 30 12 15 13 3
Fall witchgrass 150 200 160 20 10 14 12 2
Sand dropseed 140 130 170 30 102 9 10 2
Blue grama 210 90 330 140 14 7 23 7
Other grasses 160 200 210 15 10 14 15 1
Total grasses 1,340 1,330 1,330 120 86 90 91 1
Forbs 200 140 120 20 14 10 9 1
Total herbage 1,540 1,470 1,450 140
'Main effect of stocking rate is not significant for 2Significant stocking rate by year interaction, P =
any component, P > 0.05.
0.02.
grama showed little response over time but relative composition of these 2 grasses decreased. Forb production fluctuated over years with no discernable trend.
Discussion
Herbaceous production of this sand sagebrush- grassland was little affected by 20 years of differential stocking rates.
Previous studies on sandy rangeland in the western Great Plains reported reductions in herbaceous production as stocking rate increased. Over the last 3 years of a 10- year study in Nebraska, Burzlaff and Harris (1969) reported herbaceous produc- tion declined by 21% when stocking rate was doubled. Similarly, over the final 4 years of a 9 -year study in Colorado, Sims et al. (1976) found a reduction of 24% in herbaceous production as stocking rate doubled. On average, herbaceous produc- tion declined in these studies by 11.8 kg ha-' for each increase of 1 AUD ha' in stocking rate. In the current study this ratio was 0.2 and the reduction in herba- ceous production was not significant.
Table 2. Relative composition of sand dropseed as affected by the interaction of stocking rate and year.
Year Stocking rate
(AUD há' y -1) 1958 1959 1960 1961
43 57 85 SE
17a1
( %)
loa Sa
17a 8a 5a
15a 6a 6a
2 2 2
7b 6b 14a 2 'Means within year followed by different letters are sig- nificantly different, P < 0.05.
There were distinct differences in sand sagebrush populations at these different study sites which could have affected the responses of herbaceous vegetation to grazing. The average canopy cover of sand sagebrush was 38% in the current study.
At the Nebraska site, "some pastures had a population of sand sagebrush" but the abundance was not high enough to warrant measurement (Burzlaff and Harris 1969).
At the Colorado site, the canopy cover of sand sagebrush was less than 7% (Sims et al. 1976). We expected that higher popula- tions of the dominant, unpalatable sand sagebrush would increase the impact of stocking rate on the herbaceous compo- nent because of greater competition. This did not occur.
Table 3. Herbaceous production and relative composition as affected by year, averaged over stocking rate.
Vegetation component
Production Relative composition
Year Year
1958 1959 1960 1961 SE 1958 1959 1960 1961 SE
(kg há') (%)
Sand bluestem 50b1 30b 50b 100a 10 4 3 4 5 1
Little bluestem 50° 90bc 120b 290a 25 4c 9b 8"` 14a 2
Sand lovegrass 50d 120c 240b 510a 35 3` 12b 16b 24a 2
Sand paspalum 180b 130b 150b 320a 30 14 14 10 16 3
Fall witchgrass 100b 140b 210a 240a 20 8b 14a 15a 11ab 2
Sand dropseed 220a 80b 80b 200a 20 162 8 5 9 1
Blue grama 260a 230a 160a 190a 80 17ab 22a llb 9b 5
Other grasses 250a 130b 170b 220a 20 18d 13b llb 10b 2
Total grasses 1,150b 940c 1,190b 2,060a 80 84b 94a 80` 98a 1
Forbs 210" 60` 300a 50° 20 16b 6c 20a 2c 1
Total herbage 1,360" 1,000` 1,480b 2,110a 90
'Means within component followed by different letters are significantly different, P < 0.05.
2Significant stocking rate by year interaction, P = 0.02.
Companion hydrological studies at our study site suggested that herbaceous pro- duction would be negatively affected by stocking rate. Rhoades et al. (1964), work- ing in the same pastures on Eda soils, found water infiltration rates of 118, 91, and 58 mm hr-' under the stocking rates of 43, 57, and 85 AUD ha' y', respectively.
It might be expected that such differences in the rate of water infiltration into the soil would reduce average soil water content and plant production. Apparently the infil- tration rate at 85 AUD ha1 y-' was not below a critical level that would impact overall water relations, even though it was only 50% of the infiltration rate under the lowest stocking rate of 43 AUD ha' y -1.
Milchunas and Lauenroth (1993) found that the relationship between grazing intensity and above - ground net primary production (ANPP) was weak when viewed over a wide range of environ- ments. While most studies reported nega- tive impacts of grazing on ANPP, a signif- icant proportion found no impact or a small positive impact. In their comparative analyses (Milchunas and Lauenroth 1993), grazing intensity had the smallest impact in grasslands with relatively low ANPP and a long evolutionary history of grazing, both of which are characteristics of our study site (Sims and Singh 1978, Sala et al. 1988).
We detected no practical changes in species composition caused by stocking rate. Burzlaff and Harris (1969) also reported no large changes in species com- position due to stocking rate on sandy rangeland. However, Sims et al. (1976) observed directional changes in several species at higher stocking rates. While blue grama increased in the study of Sims
et al. (1976), this species was highly vari- able and did not respond to stocking rate in the current study. As with total produc- tion, species composition was relatively insensitive to stocking rate in this sand sagebrush- grassland.
Herbaceous production was more responsive to weather than to stocking
rate. The differences in production among years were much greater than the differ- ences among stocking rates for all compo- nents. Little bluestem and sand lovegrass showed the greatest responses to periods of favorable precipitation. These 2 species would be most useful as indicators of pre- cipitation trends. On the other hand, sand dropseed and blue grama were not respon- sive to precipitation and, as a result, their relative contribution to total production declined during a period of increased pre- cipitation.
Milchunas et al. (1994) hypothesized that long -term heavy grazing might reduce the ability of a grassland to increase pro- duction in years of favorable precipitation.
However, when testing this hypothesis in shortgrass steppe Milchunas et al. (1994) found that heavy grazing did not reduce production potential in years with high precipitation. Our results also reject this hypothesis since herbaceous production responded to favorable precipitation equally well at all stocking rates through- out the measurement period.
There is a common perception in grass- land management that forbs increase as stocking rates increase. This is based on the logic that cattle prefer grasses and alter the competitive interactions between grasses and forbs at high stocking rates.
Forb standing crop was not affected by stocking rate in the last 4 years of this study. During the first 10 years, basal
cover of perennial forbs was lower at a stocking rate of 85 AUD ha' y-' than at either 43 or 57 AUD ha -1 y', which had similar covers of perennial forbs (Sims and Gillen 1999). Basal cover of annual forbs was not affected by stocking rate.
Annuals dominated the forb community with 4 to 6 times more basal area than perennials (Sims and Gillen 1999). We hypothesize that these annual forbs were more responsive to variations in precipita- tion than to stocking rate. Burzlaff and Harris (1969) and Sims et al. (1976) also found that forbs did not respond to stock- ing rate treatments on sandy soils.
On the other hand, at this same study site, standing crop of both perennial and annual forbs was lower in areas excluded from grazing for over 50 years than in adjacent areas grazed at rates of 50 to 55 AUD há' y' (Berg et al. 1997). This sug- gests that the simple presence or absence of grazing is more important than the intensity of grazing. The response of forbs to stocking rate appears to be more com- plex than previously recognized and the current model that predicts linear increases in forbs as stocking rates increase should be reconsidered.
Sustainable management requires con- sideration of both biological and economic sustainability. The range of stocking rates in this study appears to be biologically sustainable, in terms of herbaceous pro- duction, since no large negative effects were noted after 20 years. Economic sus - tainability is dependent on livestock per- formance and there were clear differences among stocking rates for that variable (Sims and Gillen 1999, Gillen and Sims 2002). Economic returns from yearling steer grazing during the first 10 years of this study were maximized at a stocking
rate above the range of our experimental stocking rates (Sims and Gillen 1999).
Therefore, we cannot draw conclusions on the sustainability of profit- maximizing
stocking rates for yearling steers.
Economic returns from cow -calf produc- tion from 1954 to 1961 were maximized at 68 AUD ha'y ' (Gillen and Sims 2002), a stocking rate that appears to be sustainable in terms of herbaceous production.
Literature Cited
Berg, W.A. 1994. Sand sagebrush -mixed prairie, p. 99. In: T.N. Shiflet (ed.)
Rangeland cover types of the United States.
Soc. Range Manage., Denver, Colo.
Berg, W.A., J.A. Bradford, and P.L. Sims.
1997. Long -term soil nitrogen and vegetation change on sandhill rangeland. J. Range Manage. 50:482 -486.
Burzlaff, D.F. and L. Harris. 1969. Yearling steer gains and vegetation changes of western Nebraska rangeland under three rates of stocking. Nebr. Agr. Exp. Sta. SB -505.
Lincoln, Nebr.
Gillen, R.L. and P.L. Sims. 2002. Stocking rate and cow -calf production on sand sage- brush rangeland. J. Range Manage.
55:542 -550.
Holechek, J.L., R.D. Pieper, and C.H.
Herbei. 1995. Range Management, Principles and Practices. 2nd Ed. Prentice Hall, Englewood Cliffs, N.J.
Kuchler, A.W. 1964. Potential natural vegeta- tion of the conterminous United States.
Amer. Geograph. Soc. Spec. Pub. 36, New York, N.Y.
Kuchler, A.W. 1975. Potential natural vegeta- tion of the conterminous United States [Map].Amer. Geograph. Soc., New York, N.Y.
Milchunas, D.G. and W.K. Lauenroth. 1993.
Quantitative effects of grazing on vegetation and soils over a global range of environ- ments. Ecol. Monogr. 63:327 -366.
Milchunas, D.G., J.R. Forwood, and W.K.
Lauenroth. 1994. Productivity of long -term grazing treatments in response to seasonal precipitation. J. Range Manage. 47:133 -139.
Pechanec, J.F. and G.D. Pickford. 1937. A weight estimate method for the determination of range or pasture production. Agron. J.
29:894 -904.
Rhoades, E.D., L.F. Locke, H.M. Taylor, and E.H. Mcllvain, E.H. 1964. Water intake on a sandy range as affected by 20 years of dif- ferential cattle stocking rates. J. Range
Manage. 17:185 -190.
Sala, O.E., W.J. Parton, L.A. Joyce, and W.K. Lauenroth. 1988. Primary production of the central grassland region of the United States. Ecol. 69:40-45.
SAS Institute Inc. 1999. SAS /STAT User's Guide, Version 8. SAS Institute Inc., Cary, N.C.
Shoop, M.C. and E.H. Mcllvain. 1963. The micro -unit forage inventory method. J.
Range Manage. 16:172 -179.
Shoop, M.C. and E.H. Mcllvain. 1971. Why some cattlemen overgraze and some don't.
J. Range Manage. 24:252 -257.
Sims, P.L. and R.L. Gillen. 1999. Rangeland and steer responses to grazing in the Southern Plains. J. Range Manage.
55:651 -660.
Sims, P.L. and J.S. Singh. 1978. The structure and function of ten western North American grasslands: III. Net primary production, turnover and efficiencies of energy capture and water use. J. Ecol. 66:573 -597.
Sims, P.L., B.E. Dahl, and A.H. Denham.
1976. Vegetation and livestock response at three grazing intensities on sandhill range- land in eastern Colorado. Colo. Agr. Exp.
Sta. Tech. Bull. 130. Ft. Collins, Colo.