Hall
Petch Breakdown at Elevated Temperatures
Joachim H. Schneibel
1and Martin Heilmaier
218809 Carriage House Way, Knoxville, TN 37923, USA
2Institute for Applied Materials, Karlsruhe Institute for Technology, D-76131 Karlsruhe, Germany
The HallPetch effect responsible for the strength offine-grained and ultrafine-grained (UFG) metals is almost exclusively measured at room temperature. One reason for this is that at elevated temperatures grains tend to coarsen, and this negates the strengthening. The grains may, however, be stabilized by small volume fractions offine dispersoids. These dispersoids causedirectOrowan strengthening and, by stabilizing the so-called Zener grain size,indirectstrengthening due to HallPetch. We show that for most metals the critical Zener grain sizeabovewhich HallPetch strengthening is more important than Orowan strengthening is lower than, and sometimes even considerably lower than 1 µm, i.e., in the range of UFG metals. Breakdown of the HallPetch relationship, which occurs at elevated temperatures once mechanisms weaker than Hall Petch start to control the strength, is best studied for grain sizes well above this critical grain size. The HallPetch breakdown due to either Coble creep or grain size-dependent dislocation creep is modeled. We present model calculations for copper and verify our approach by comparing with experimental results for ferritic steels containing nanoscale dispersions. [doi:10.2320/matertrans.MA201309]
(Received July 26, 2013; Accepted August 23, 2013; Published November 1, 2013)
Keywords: HallPetch breakdown, elevated temperature,fine-grained, ultrafine-grained, Orowan strengthening, oxide dispersion strengthened steel
1. Introduction
A common feature of HallPetch measurements1,2) to study the strengthening of materials due to grain refinement is that they are almost always carried out at room temperature, regardless of the melting point of the material. However, depending on the absolute melting point Tm of a material, its homologous temperature T/Tm at room temperature may vary considerably®for example, it is 0.1 for molybdenum and 0.43 for zinc. Materials with low homologous temper-atures (e.g., T/Tm<0.2) will deform athermally at room temperature. The room temperature deformation of materials with higher homologous temperatures, on the other hand, will involve thermally activated processes characterized by an Arrhenius-type temperature dependence of the strength. Sometimes, in order to be able to study these processes at room temperature, alloys exhibiting high homologous temperatures and diffusivities at room temperature are chosen such as in the work of Kim et al.3)for MgLi alloys.
At sufficiently high homologous temperatures the observed strength will drop below that expected for the HallPetch relationship. In other words, the HallPetch relationship breaks down, or, briefly, HallPetch breaks down. This does not necessarily mean that the HallPetch mechanism, whatever it is, ceases to exist at elevated temperatures, but that some other, weaker deformation mechanism begins to control the strength. As a result of the HallPetch breakdown, the typical fine-grain strengthening may turn into softening; the “strengthening” contribution becomes negative. Some explanations for the so-called inverse HallPetch effect in which the room temperature strength decreases with decreasing grain size are based on thermally activated processes such as Coble creep, grain boundary sliding, or recovery of dislocations at grain boundaries that become more important as the grain size decreases and more diffusion paths become available.47) Put differently, by sufficiently reducing the grain size of a material, thermally activated deformation processes may be probed at room temperature.
Instead of increasing the homologous temperature at room temperature by reducing the melting point, or instead of refining the grains, a more direct way to probe thermally activated processes is to raise the test temperature. Such tests are rarely carried out for materials with“normal”grain sizes such as 10 µm and above. Ultrafine-grained (UFG) materials with grain sizes as small as ³20 nm, on the other hand, are sometimes tested above room temperature.7) This is not a trivial task since small grains like to coarsen at homologous temperatures as low asT/Tm=0.3,8)and large grains do not result in significant HallPetch strengthening. Therefore, tests to assess the HallPetch breakdown at elevated temperatures are best carried out with fine-grained materials exhibiting a stable grain size.
Methods to stabilize small grain sizes at elevated homologous temperatures do exist. An elegant approach is to reduce the grain boundary free energy to zero by segregating the correct amount of an appropriate element at the grain boundaries. Then the driving force for grain boundary migration becomes zero and the grains ought to be stable.9)An additional advantage of this approach is that the segregating element does not cause any additional strength-ening as long as its solubility in the matrix is sufficiently low. Atomistic simulations by Milletet al.10)support this concept, but only a few systems such as YFe,9)and NiW, NiB and NiS10) have so far shown experimental promise. Also, it appears that direct experimental evidence for zero free grain boundary energies, i.e., the absence of grooving at grain boundaries intersecting a free surface, does not exist. An additional complication is found in the work of Gorkaya
et al.11)who have shown that grain boundary migration may be driven not only by the grain boundary free energy, but also by an externally applied shear stress. Therefore, even when the grain boundary free energy is zero, grain coarsening may occur during mechanical testing.
Instead of reducing the grain boundary free energy to zero, grain coarsening may also be inhibited by pinning the grain boundaries with small particles. For any population of stable particles with a given size and number density, grain Special Issue on Strength of Fine Grained Materials®60 Years of HallPetch®
coarsening will stop once a limiting “Zener grain size”has been reached.12) The pinning particles may be precipitates produced by heat treatments or dispersoids introduced by methods such as internal oxidation or mechanical alloying. Dispersoids such as Y2O3 are preferred over precipitates because they tend to be extremely resistant to coarsening or dissolution. There are many examples for such oxide dispersion-strengthened (ODS) materials.1315)Because of the high stability of many ceramic particles in metallic systems, Zener pinning may be applied almost universally to stabilize grain sizes.
The problem with dispersoids in fine-grained materials is that they may obscure the HallPetch strengthening by introducing an additional strengthening mechanism, namely, Orowan strengthening. Hazzledine, in his two-page 1992 paper,16) has discussed this problem. First, he calculated the Orowan strengthening for a given population of dispersoids, i.e., thedirectstrengthening. Second, he calculated the Zener grain size, i.e., the grain size at which the grain boundaries are fully anchored by the dispersoids. Third, he calculated the HallPetch strengthening, i.e., theindirect strengthening arising from the fine grains stabilized by the dispersoids. Using representative values for the HallPetch coefficient Hazzledine showed that the HallPetch strengthening exceeds the Orowan strengthening for dispersoid sizes> 0.8 nm. Since experimentally observed dispersoids are typically much larger than 0.8 nm Hazzledine concluded that HallPetch strengthening is expected to always dominate Orowan strengthening. While this is true for many materials, a survey of a number of metallic systems will show the need to qualify this statement.
The purpose of the present work is two-fold. First, based on Hazzledine’s model, the critical particle size dp or the critical Zener grain size dZ above which HallPetch
strengthening exceeds Orowan strengthening will be calcu-lated for a range of pure metals at room temperature. It will be seen that the critical sizes are very much material-dependent. For grain sizes well above dZ the strength is primarily determined by HallPetch strengthening, and Hall Petch breakdown experiments are best performed for such grain sizes. The second purpose of this work is an analysis of the mechanisms responsible for HallPetch breakdown at elevated temperatures. Coble creep17)as well as a model for grain size-dependent dislocation creep recently proposed by Blum and Zeng18,19)will be used to estimate the temperatures above which mechanisms weaker than predicted by the classic HallPetch relationship govern the strength. The Hall Petch breakdown will be illustrated for pure copper and
verified by comparing with experimental results for ferritic stainless stainless steels containing nanoscale dispersions.
2. The Hazzledine Model for Indirect vs. Direct Strengthening
The Hazzledine model for the ratio between HallPetch (indirect) and Orowan (direct) strengthening requires an expression for the Zener grain size. The Zener grain size
dZis, roughly speaking, that grain size at which the driving force 2£=r due to the curvature of grain boundaries having a specific grain boundary free energy £ is balanced by the pinning action of the particles. For a given particle dispersion, it is the smallest grain size that is thermally stable. Experimentally, the Zener grain size dZ may be stable at temperatures up to homologous temperatures of T/Tm³ 0.7.20) It is proportional to the dispersoid diameter d
p according to:
dZ¼CZdp
f ; ð1Þ
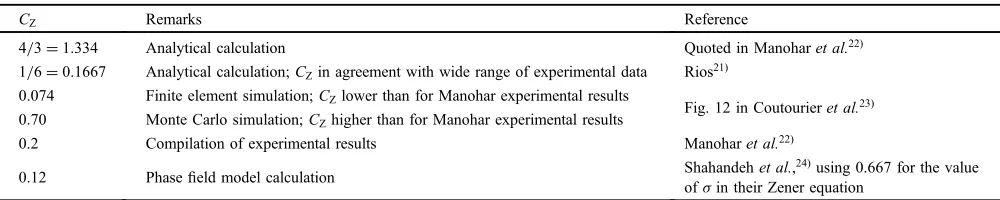
where CZ is a constant and f the volume fraction of the dispersoids. A commonly used value forCZis 4/3. However, as shown by Rios21) and Manohar et al.,22) experimentally observed values for the Zener grain size are several times smaller than those calculated withCZ=4/3. As an additional complication, the experimental and the calculated values for the Zener grain size are subject to considerable variation (Table 1). For example, Coutourier et al.23) show that different types of simulations actually bracket the exper-imental results compiled by Manohar.22)Since theC
Zvalues from the analysis of Rios21)and the experimental compilation by Manohar et al.22) in Table 1 agree quite well with each other, the Zener equation, for the purpose of this paper, is written as:
dZ¼ dp
6f: ð2Þ
Following Hazzledine,16)the yield stress ·yfor a pure metal at low homologous temperature is:
·y ¼·0þ·ORþ·HP: ð3Þ
Hereby·0is the matrix yield stress or“friction stress”for an infinite grain size (or some orientation-averaged value of the single-crystal yield stress),·OR is the Orowan strengthening due to the dispersoids and·HPthe HallPetch strengthening due to the grains. The Orowan contribution may be written as:16)
CZ Remarks Reference
4/3=1.334 Analytical calculation Quoted in Manoharet al.22)
1/6=0.1667 Analytical calculation;CZin agreement with wide range of experimental data Rios21)
[image:2.595.48.548.83.183.2]0.074 Finite element simulation;CZlower than for Manohar experimental results
Fig. 12 in Coutourieret al.23)
0.70 Monte Carlo simulation;CZhigher than for Manohar experimental results
0.2 Compilation of experimental results Manoharet al.22)
0.12 Phasefield model calculation Shahandehet al.,
24)using 0.667 for the value
·OR¼M 6³f 1=2Gb
dp
; ð4Þ
where M is the Taylor factor, G the shear modulus and b
the Burgers vector. With the help of eq. (2), the Orowan contribution may also be written as a function of the Zener grain size:
·OR ¼M 6³1
f 1=2Gb
dZ : ð5Þ
The HallPetch strengthening corresponding to the Zener grain size is:
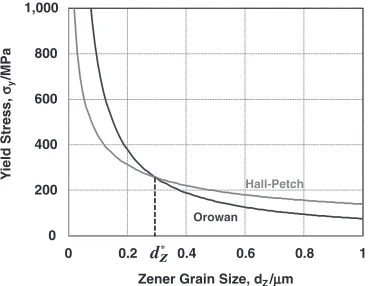
·HP ¼kHPdZ1=2: ð6Þ Figure 1 illustrates how the Orowan and HallPetch stresses depend on the Zener grain size (which in turn is controlled by the dispersoid size and volume fraction). Above a critical Zener grain sizedZ(to be calculated further down) the Hall
Petch stress becomes larger than the Orowan stress. This might suggest that experiments to study the HallPetch breakdown are best carried out for large dispersoids where HallPetch dominates. Larger dispersoids result however in larger Zener grain sizes and consequently a pronounced decrease of the HallPetch effect. Therefore one would expect a certain window for the Zener grain size which is particularly suited for experimental observations.
With eq. (2) for the Zener grain size we obtain for the ratio of the HallPetch and the Orowan strengthening either:
·HP
·OR
¼³1=2kHP
MGb d
1=2
p ð7Þ
or
·HP
·OR ¼
ð6³fÞ1=2k
HP
MGb d
1=2
Z : ð8Þ
The critical particle size dp and critical Zener grain size
dZ above which HallPetch strengthening exceeds Orowan
strengthening are obtained by setting·HP/·ORin eqs. (7) and (8) equal to 1 and solving fordp ordZ, respectively:
dp¼M
2
³ Gb kHP
2
ð9Þ
and
dZ¼ M
2
6³f Gb kHP
2
: ð10Þ
Equations (9) and (10) show that the critical sizes depends strongly on the ratio of the shear modulus and the HallPetch coefficientkHP. The critical dispersoid size is independent of the dispersoid sizeandthe dispersoid volume fraction, while the critical Zener grain size is independent of the dispersoid size, but depends on the dispersoid volume fraction.
[image:3.595.78.265.71.214.2]3. Critical Dispersoid Sizes and Critical Zener Grain Sizes®Experimental Assessment
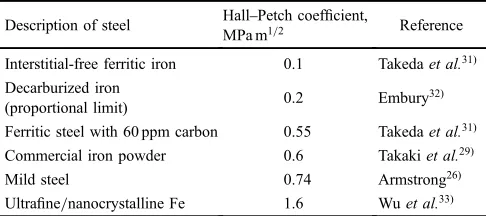
Table 2 summarizes materials parameters for a range of fcc, bcc and hcp metals. From these parameters the critical dispersoid size and critical Zener grain size above which HallPetch strengthening exceeds Orowan strengthening are calculated. It should be pointed out that these sizes are subject to considerable uncertainty, since the HallPetch coefficients of many metals are not precisely known. For example, HallPetch coefficients for ferritic iron compiled in Table 3 vary from 0.1 to 1.6 MPa m1/2. There are several reasons for these variations. First, the HallPetch coefficient may depend on the grain size. It may increase with decreasing grain size as seen by a comparison between the HallPetch coefficients compiled by Wu et al.33) for
ultra-fine/nanocrystalline metals with those in Table 2. But it may also decrease with decreasing grain size as in the inverse HallPetch effect.46,34)Second, the HallPetch coefficient of steels may increase strongly with increasing carbon concen-tration®the value of ³0.1 MPa m1/2 for an interstitial-free steel increases to ³0.55 MPa m1/2 when 60 ppm carbon are added.31) Third, in most measurements of the HallPetch coefficient it is implicitly assumed that a random polycrystal-line texture or grain size-independent texture is established which may not necessarily hold true. Fourth, in order to determine a“true”HallPetch coefficient one should subtract all other strengthening contributions such as precipitation or dispersion strengthening.35) The data for the HallPetch coefficients in Table 2 were chosen to be “reasonable”, but for the time being we can only hope that the substantial variations for the different metals in that Table are not primarily due to microstructural differences, but that they are actually meaningful. Obviously, when experimenting with a particular metal in a particular microstructural state, its Hall Petch coefficient needs to be verified.
Ignoring these complications, Table 2 shows that the calculated critical dispersoid sizes and critical Zener grain sizes vary substantially from metal to metal. With the exception of niobium (³300 nm and³5 µm), they tend to be smaller for bcc and hcp metals as compared to fcc metals. This is because the HallPetch coefficients in bcc materials tend to be higher than those in fcc and hcp materials.33)Some of the critical dispersoid sizes are extremely small, such as 1.3 nm for molybdenum or 0.5 nm for zinc. Such sizes are difficult to produce experimentally®the smallest particles observed to date appear to be the³2 nm nanoclusters seen in 14YWT steels.36)Also, if the particle size becomes too small, Zener pinning may not be effective at elevated temperatures
0 200 400 600 800 1,000
0 0.2 0.4 0.6 0.8 1
Y
ield Stress,
σy
/MPa
Zener Grain Size, dZ/μm
Hall-Petch
Orowan
dz*
Fig. 1 Illustration of the dependencies of the Orowan and HallPetch stress on the Zener grain size, withM=3.06,f=0.01 and values representative for copper, i.e.,G=42.2 GPa,b=0.256 nm andkHP=0.14 MPa m1/2.
because thermal activation may assist the unpinning of grain boundaries. In contrast to molybdenum and zinc, the critical sizes for aluminum, i.e., a dispersoid size of 34 nm and a Zener grain size of 0.6 µm, are within easy reach of experiments. Therefore, Hazzledine’s16) statement that in experimentally attainable situations the indirect strengthening always exceeds the direct strengthening is not universally true.
4. Models for the HallPetch Breakdown at Elevated Temperatures
Equation (6) for the HallPetch strengthening is temper-ature-independent. Following Hirth and Lothe37)and assum-ing that Poisson’s ratio is temperature-independent, the Hall Petch equation may be written as:
·HPðTÞ ¼ GðTÞ
Gð300KÞ
1=2
kHPð300KÞ d1=2; ð11Þ
i.e., the temperature dependence of the HallPetch strength is controlled by the temperature dependence of the shear modulus G. As a result, HallPetch strengthening shows a mild decrease with increasing temperature. The Orowan stress in eqs. (4) and (5) is proportional to the temperature-dependent shear modulus, and the same is assumed to hold true for the friction stress·0.
As the temperature is increased, the measured yield stress drops eventually below the predicted HallPetch strength, i.e., HallPetch breaks down. A large variety of thermally activated mechanisms may be responsible for this. According to Mukherjee38) the steady-state strain rate for these creep mechanisms may in general be written as:
_
¾¼AD0Gb
kT
b d
p
·
G n
exp Q
RT
; ð12Þ
whereAis a materials parameter,D0andQthe preexponental factor and activation energy for the appropriate value of the self-diffusivity (either in the bulk or in the grain boundaries),
p a constant, n the stress exponent and R the molar gas constant. Solving eq. (12) for· one obtains:
· ¼ kT Gn1¾_ AD0b
1=n
d
p q
exp Q
nRT
; ð13Þ
where q=p/n is the grain size exponent. The grain size exponent may take on values such as q=¹1/2,18,19)
q=0 (conventional dislocation creep, see Poirier17)),q=1 (Padmanabhanet al.,6)as long as their threshold stress is set to 0), q=2 (Ma et al.,39) as long as their threshold stress is set to zero); NabarroHerring creep17) and q=3 (Coble creep17)). With the exception of NabarroHerring and Coble creep, the absolute values of the creep stresses given by these models are subject to considerable uncertainty because not all relevant parameters are well known. Experimentally, discrimination between the different models is therefore best made on the basis of the temperature, grain size and strain rate dependence of the measured stress.
The Coble creep and the BlumZeng model bracket the range of the proposed grain size exponents and are derived on the basis of clear physical assumptions. For a given strain rate¾_ and temperatureT, the Coble creep stress is:17)
·C¼ kT d 3¾_
47¤BDB0exp
QB
RT
ð14Þ
[image:4.595.52.549.173.300.2]where k is Boltzmann’s constant, the atomic volume, ¤B the grain boundary width andDB0andQBthe pre-exponential Table 3 Compilation of HallPetch coefficients published for ferritic steels.
Description of steel HallPetch coefficient,
MPa m1/2 Reference
Interstitial-free ferritic iron 0.1 Takedaet al.31)
Decarburized iron
(proportional limit) 0.2 Embury
32)
Ferritic steel with 60 ppm carbon 0.55 Takedaet al.31)
Commercial iron powder 0.6 Takakiet al.29)
Mild steel 0.74 Armstrong26)
Ultrafine/nanocrystalline Fe 1.6 Wuet al.33)
dispersoid sizes and critical Zener grain sizes above which HallPetch strengthening dominates Orowan strengthening are listed in the last two rows of the table.
Sources:
Melting points, Burgers vectors, shear moduli: Frost and Ashby25)
HallPetch coefficients for Al, Ag, Cr, Nb, Mo, W, Zn (at 0°C), Mg,¡-Ti: Armstrong26)
HallPetch coefficient for Cu: Hansen27)
HallPetch coefficient for Ni: Thompson28)
HallPetch coefficient for¡-Fe: Takakiet al.29)
HallPetch coefficient for Ta: Jankowskiet al.30)
Al Ag Cu Ni ¡-Fe Cr Nb Mo Ta W Zn Mg ¡-Ti
Melting pointTm, °C 660 962 1085 1455 1538 1907 2477 2623 3017 3422 420 650 1668
Melting pointTm, K 933 1235 1358 1728 1811 2180 2750 2896 3290 3695 693 923 1941
Homologous temperatureT/Tmat 300 K 0.322 0.243 0.221 0.174 0.166 0.138 0.109 0.104 0.091 0.081 0.433 0.325 0.155
Burgers vectorb, nm 0.286 0.286 0.256 0.249 0.248 0.25 0.286 0.273 0.286 0.274 0.267 0.321 0.295 Shear modulusG(300 K), GPa 25.4 26.4 42.1 78.9 64 126 44.3 134 61.2 160 49.3 16.6 43.6 Friction stress·0, MPa 15.7 37.3 20 21.8 100 179 68.7 108 152 641 32.4 6.9 78.5
HallPetch coefficientkHP, MPa m1/2 0.068 0.068 0.14 0.158 0.6 0.9 0.04 1.77 0.556 0.788 1.02 0.279 0.403
[image:4.595.48.291.337.445.2]factor and activation energy for the grain boundary self diffusion coefficientDB¼DB0expðQRTBÞ.
In the BlumZeng model18,19)the HallPetch breakdown is due to grain size-dependent steady-state dislocation creep. Using eq. (1) in Blum and Zeng’s 2011 publication19) with simplifying assumptions made there, the strength may be written as:
·BZ¼G ³ð1¯ÞM 9
1:24
1=8
¡ 1cþc3
c3
1=2
kT¾_
GbDB0
1=8
exp QB
8RT
d
b 1=2
ð15Þ
where¯is Poisson’s ratio,Mthe Taylor factor,¡a dislocation interaction constant [eq. (15) in Blum and Zeng18)] andca parameter that stands for four constantsf£,frel,fband fdipthe values of which are assumed to be equal to cin Blum and Zeng.19)Furthermore,¤B¼bis assumed in eq. (15). For the sake of completeness it is pointed out that eq. (18) in Blum and Zeng’s 2009 publication18)reduces to eq. (15) above if it is solved for·, the resulting expression is multiplied with a factor of ¤Bb ð1¯Þ1=8 and the value of² in their function
f(²) is taken to be zero, resulting inf(²)=1.
The strengths given by the Coble creep and the Blum Zeng models have not only different grain size exponents, i.e.,q=3 vs.q=¹1/2, but their strain rate sensitivities are also quite different, namely, 1 and 1/8. Testing at different strain rates may therefore be used to discriminate between the
two models. Also, the temperature dependence of the stresses for the two mechanisms is different, namely, approximately
expðQB
RTÞandexpð8QRTBÞ, i.e., the BlumZeng creep stress drops
off more slowly with increasing temperature than the Coble creep stress.
5. Modeling of the HallPetch Breakdown for Copper
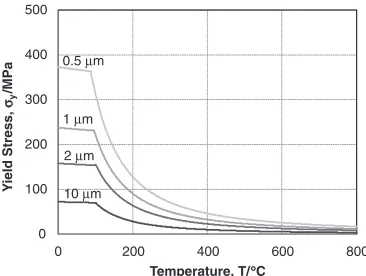
Figures 2 and 3 illustrate the HallPetch breakdown at elevated temperatures in pure copper due to Coble or BlumZeng creep [eqs. (14) and (15)] assuming that grain coarsening does not occur. The parameters for the simu-lations are taken from Tables 2 and 4. Thefigures show that, for the grain sizes considered, HallPetch breakdown due to BlumZeng creep occurs at lower temperatures than for Coble creep, i.e., BlumZeng creep is expected to control the temperature at which the breakdown occurs. Because of its lower activation energy,QB/8, the BlumZeng creep strength drops off more slowly with increasing temperature than the Coble creep strength. Not surprisingly, the temperature at which the HallPetch breakdown due to Coble creep sets in increases strongly with increasing grain size. For the Blum Zeng mechanism, on the other hand, the breakdown temper-ature is almost independent of the grain size. In fact, if the friction and Orowan stresses are zero or negligible, the breakdown temperature is grain size independent, since the strengths given by the HallPetch and BlumZeng mecha-nisms exhibit exactly the same grain size dependence. 0
100 200 300 400 500
0 200 400 600 800
Y
ield Stress,
σy
/MPa
Temperature, T/°C
0.5 μm
1 μm
2 μm
Fig. 2 Illustration of the HallPetch breakdown due to Coble creep in copper according to eqs. (11) and (14) using the parameters listed in Tables 2 and 4. The grain size is indicated next to each curve. For the 0.5 µm grain size, the full range of the HallPetch and Coble creep relationships is depicted (see broken lines).
0 100 200 300 400 500
0 200 400 600 800
Y
ield Stress,
σy
/MPa
Temperature, T/°C
10 μm 2 μm 0.5 μm
1 μm
[image:5.595.335.518.70.208.2]Fig. 3 Illustration of the HallPetch breakdown due to BlumZeng creep in copper according to eqs. (11) and (15) using the parameters listed in Tables 2 and 4. The grain size is indicated next to each curve.
Table 4 Parameters used for the simulations for copper in Figs. 2 and 3.
Physical quantity Value Reference
Atomic volume³, m3 1.18©10¹29 Frost and Ashby25)
Temperature coefficient of shear modulus Tm
Gð300KÞdGdT ¹0.54 AA
Product of grain boundary width and pre-exponential factor
for grain boundary diffusion¤BDB0, m3/s 5©10¹15 AA
Activation energy for grain boundary diffusionQB, kJ/mole 104 AA
Taylor factor 3.06 Blum and Zeng18)
Poisson’s ratio¯ 0.34 Smithellset al.40)
Parameter¡in eq. (15) 0.3 Blum and Zeng18)
[image:5.595.46.549.296.420.2] [image:5.595.60.292.545.602.2]Measuring the grain size dependence of the breakdown temperature may help to identify the strength-controlling mechanisms. Similarly, since the strengths given by Coble and BlumZeng depend in different ways on the strain rate, measurements of the strain rate dependence of the strength would also be useful.
6. Modeling of the HallPetch Breakdown for Ferritic Stainless Steels and Comparison with Experimental Data
There is a dearth of experimental data for the temperature dependence of the yield stress infine-grained materials with stable grain sizes. Arguably, the best compilation of data is found in Schneibel et al.20)for the nanocluster-strengthened steel 14YWT and the ODS steel PM2000. These data are shown in Fig. 4 together with data for the dispersion-free version of PM2000, namely, Kanthal-A1.20) In order to access as wide a range of grain sizes as possible we assume that the differences in the chemical compositions of the three types of steel are negligible as far as their mechanical properties are concerned. Table 5 is a compilation of the relevant microstructural parameters. It contains also the measured room temperature yield stresses, a reasonable value for the friction stress·0obtained from the Kanthal-A1 data in Fig. 4, the Orowan stresses calculated from eq. (4), the HallPetch stresses calculated from eq. (11) and the
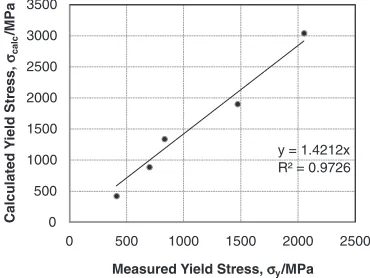
calculated ratio of the HallPetch (indirect) to the Orowan (direct) strengthening. Figure 5 indicates a reasonably linear relationship between the measured and calculated yield stresses. However, the calculated yield stresses are on average a factor of 1.42 larger than those measured. Assuming this factor to be due to inaccuracies in the strengthening models and microstructural parameters, the three strengthening contributions and thus the total value of the calculated yield stress were scaled down by a factor 1/1.42 in order to better match the experimental data (see last column of Table 5). The parameters used for modeling the HallPetch breakdown due to the BlumZeng model are listed in Tables 2 and 6. The value of the parameter c
was chosen such as to give reasonable agreement with the drop-off in the yield stress at elevated temperatures. The
fitted curves are shown by the broken lines in Fig. 4. For the grain sizes 0.2, 0.5 and 1.1 µm reasonable agreement is obtained for the yield stress below ³500°C given by
[image:6.595.47.550.95.221.2]·y=·0+·OR+·HP and the BlumZeng model above ³500°C. The fits to the experimental curves involved essentially two adjustable parameters, one to match the strength at low temperatures (the factor 1/1.42), and one to match the strength for temperatures above the HallPetch breakdown, i.e., the value of c=0.15. In order to keep Fig. 4 simple, the model calculations for 25 and 546 µm are not shown. For these grain sizes the calculated curves fall below the experimental data (because of the relatively
0 500 1000 1500 2000
0 200 400 600 800 1000
Y
ield Stress,
σy
/MPa
Temperature, T/°C
1.1 μm
25 μm
0.5 μm
0.2 μm
546 μm
Fig. 4 Measured yield stresses vs. temperature for ferritic stainless steels20)
(solid lines) and comparison with the HallPetch and BlumZeng models (broken lines).
ferritic stainless steels at 300 K (for experimental data see Schneibelet al.20)).
Material
Nominal composition of matrix, mass%
Grain sized, µm
Measured yield stress ·y, MPa
Volume fractionfof Dispersoids
Dispersoid size, nm
Friction stress·0,
MPa
Calculated Orowan stress·OR, MPa
Calculated HallPetch stress·HP, MPa
Calculated yield stress ·calc, MPa
·HP
·OR,
calculated
Adjusted yield stress, ·adj
y , MPa
Kanthal-A1 Fe20Cr
5.5Al0.5Ti 546 410 0 ® 400 0 26 426 0.00 300
PM2000 AA 25 698 0.008 16.2 400 371 120 891 3.09 627
PM2000 AA 1.1 830 0.008 16.2 400 371 572 1343 0.65 945
14YWT Fe14Cr
3W0.4Ti 0.5 1469 0.00031 1.8 400 657 849 1905 0.77 1340
14YWT AA 0.2 2050 0.00217 2.4 400 1303 1342 3044 0.97 2142
y = 1.4212x R² = 0.9726
0 500 1000 1500 2000 2500 3000 3500
0 500 1000 1500 2000 2500
Calculated Y
ield
Stress,
σcalc
/MPa
Measured Yield Stress, σy/MPa
[image:6.595.55.302.100.398.2] [image:6.595.327.534.102.396.2] [image:6.595.64.273.251.402.2] [image:6.595.334.519.258.397.2]low friction stress ·adj0 , see Table 5) and, in addition, the calculated HallPetch breakdown temperatures are quite low: 290°C for 25 µm and 205°C for 546 µm. The match might be improved by adding a temperature-dependent friction stress to the BlumZeng model, but it is questionable that this would result in a more conclusive interpretation. All that can be said at the present time is that the BlumZeng model is reasonably consistent with the HallPetch breakdown. In future experiments it would be preferable to choose pure metals with negligibly low friction stresses and with grain sizes well above the critical Zener grain sizes in Table 2. The direct Orowan strengthening would then be relatively unimportant and the strength for temperatures below the temperature at which the HallPetch breakdown sets in would be almost exclusively determined by the HallPetch mechanism. This would facilitate identification of the mechanism which causes HallPetch breakdown at elevated temperatures. As a result, an unambiguous and conclusive comparison between models and experiments for the Hall Petch breakdown may be possible.
7. Summary and Conclusions
(1) Traditionally, HallPetch strengthening is almost always measured at room temperature. Depending on the material, room temperature corresponds to homologous temperatures ranging from ³0.1 to ³0.4, i.e., thermally activated processes may or may not occur in traditional Hall Petch measurement.
(2) Dispersion-strengthened metals exhibit an extremely stable grain size, the Zener grain size. The Zener grain size above which HallPetch (indirect) strengthening dominates Orowan (direct) strengthening varies from 8 nm for zinc to ³5 µm for niobium. Materials with grain sizes well above these critical sizes lend themselves to measuring the Hall Petch breakdown at elevated temperatures.
(3) The breakdown of the HallPetch relationship at elevated temperatures is due to control by other mechanisms the strength of which depends in different ways on temper-ature, grain size and strain rate. Coble creep and BlumZeng grain size-dependent dislocation creep bracket the range of proposed grain size dependencies.
(4) The HallPetch breakdown due to Coble creep and BlumZeng creep has been modeled for copper. The Hall Petch breakdown due to BlumZeng creep has been modeled for oxide dispersion-strengthened ferritic steels and seen to be in reasonable agreement with experimental measurements for PM2000 and 14YWT steels, thus lending support to the BlumZeng model.
(5) Measurements of the yield stress vs. temperature for oxide dispersion-strengthened pure metals with different grain sizes and for different strain rates would be desirable for a more conclusive identification of the mechanism(s) for HallPetch breakdown at elevated temperatures.
Acknowledgments
The authors acknowledge financial support through DFG contract Nr. HE1872/23-1.
REFERENCES
1) E. O. Hall:Proc. Phys. Soc., B64(1951) 742. 2) A. Cracknell and N. J. Petch:Acta Metall.3(1955) 186. 3) W. J. Kim:Scr. Mater.61(2009) 652.
4) C. S. Pande, R. A. Masumara and P. M. Hazzledine: Phys. Mech.5
(2002) 16.
5) M. A. Meyers, A. Mishra and D. J. Benson:Prog. Mater. Sci.51(2006) 427.
6) K. A. Padmanabhan, G. P. Dinda, H. Hahn and H. Gleiter:Mater. Sci. Eng. A452453(2007) 462.
7) Y. J. Li, J. Mueller, H. W. Höppel, M. Göken and W. Blum:Acta Mater.
55(2007) 5708.
8) M. Chauhan and F. A. Mohamed:Mater. Sci. Eng. A427(2006) 7. 9) J. Weissmüller, W. Krauss, T. Haubold, R. Birringer and H. Gleiter:
Nanostruct. Mater.1(1992) 439.
10) P. C. Millett, R. P. Selvam and A. Saxena:Acta Mater.55(2007) 2329. 11) T. Gorkaya, K. D. Molodov, D. A. Molodov and G. Gottstein:Acta
Mater.59(2011) 5674.
12) C. S. Smith: Trans. AIME175(1949) 15.
13) J. Rösler and E. Arzt:Acta Metal. Mater.38(1990) 671.
14) U. Grundmann, M. Gerner, M. Heilmaier, U. Martin, L. Schultz and H. Oettel:Mater. Sci. Eng. A234236(1997) 505.
15) U. Martin and M. Heilmaier:Advanced Eng. Mater.6(2004) 515. 16) P. M. Hazzledine:Scr. Metall. Mater.26(1992) 57.
17) J.-P. Poirier: Creep of Crystals, (Cambridge University Press, Cambridge, 1985).
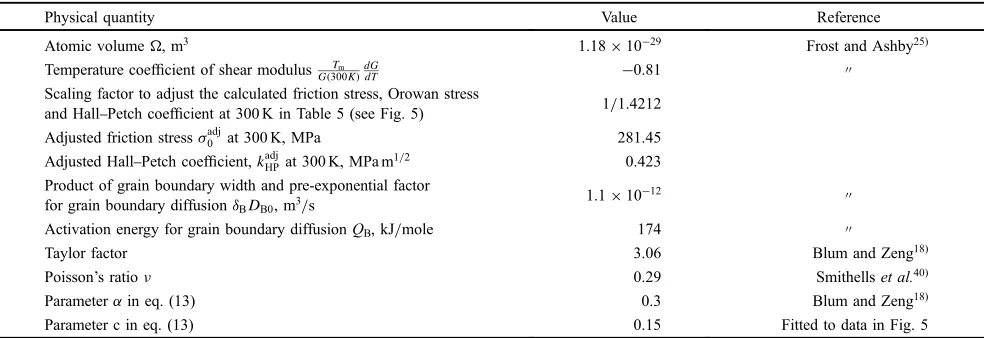
[image:7.595.55.547.84.253.2]18) W. Blum and X. H. Zeng:Acta Mater.57(2009) 1966. Table 6 Parameters used for the simulations for ferritic steel in Fig. 4.
Physical quantity Value Reference
Atomic volume³, m3 1.18©10¹29 Frost and Ashby25)
Temperature coefficient of shear modulus Tm
Gð300KÞdGdT ¹0.81 AA
Scaling factor to adjust the calculated friction stress, Orowan stress
and HallPetch coefficient at 300 K in Table 5 (see Fig. 5) 1/1.4212 Adjusted friction stress·adj0 at 300 K, MPa 281.45 Adjusted HallPetch coefficient,kadjHPat 300 K, MPa m1/2 0.423 Product of grain boundary width and pre-exponential factor
for grain boundary diffusion¤BDB0, m3/s 1.1©10¹12 AA
Activation energy for grain boundary diffusionQB, kJ/mole 174 AA
Taylor factor 3.06 Blum and Zeng18)
Poisson’s ratio¯ 0.29 Smithellset al.40)
Parameter¡in eq. (13) 0.3 Blum and Zeng18)
20) J. H. Schneibel, M. Heilmaier, W. Blum, G. Hasemann and T. Shanmugasundaram:Acta Mater.59(2011) 1300.
21) R. Rios:Acta Metall.35(1987) 2805.
22) P. A. Manohar, M. Ferry and T. Chandra:ISIJ Int.38(1998) 913. 23) G. Couturier, R. Doherty, C. Maurice and R. Fortunier:Acta Mater.53
(2005) 977.
24) S. Shahandeh and M. Militzer: Philos. Mag. (2013), in press. 25) H. J. Frost and M. F. Ashby: Deformation-Mechanism Maps: the
Plasticity and Creep of Metals and Ceramics, (Pergamon Press, Oxford, 1982).
26) R. W. Armstrong: Advances in Materials Research, ed. by Herbert Herman, (John Wiley & Sons, Inc., N.Y., 1970) pp. 101146. 27) N. Hansen:Scr. Mater.51(2004) 801.
28) A. A. W. Thompson:Acta Metall.23(1975) 1337.
29) S. Takaki, K. Kawasaki, Y. Futamura and T. Tsuchiyama:Mater. Sci. Forum503504(2006) 317.
30) A. F. Jankowski, J. Go and J. P. Hayes:Surf. Coat. Technol.202(2007) 957.
31) K. Takeda, N. Nakada, T. Tsuchiyama and S. Takaki: ISIJ Int. 48
32) J. D. Embury:Strengthening Methods in Crystals, ed. by A. Kelly and R. B. Nicholson, (Elsevier Publishing Company, Amsterdam-London-New York, 1971) p. 331.
33) D. Wu, J. Zhang, J. C. Huang, H. Bei and T. G. Nieh:Scr. Mater.68
(2013) 118.
34) T. G. Desai, P. Millett and D. Wolf:Mater. Sci. Eng. A493(2008) 41. 35) S. Thangaraju, M. Heilmaier, B. S. Murty and S. S. Vadlamani:Adv.
Eng. Mater.14(2012) 892.
36) D. T. Hoelzer, J. Bentley, M. A. Sokolov, M. K. Miller, G. R. Odette and M. J. Alinger:J. Nucl. Mater.367370(2007) 166.
37) J. P. Hirth and J. Lothe:Theory of Dislocations, (McGraw-Hill, New York, 1968) p. 717.
38) A. K. Mukherjee:Mater. Sci. Eng. A322(2002) 1.
39) Z. Y. Ma, R. S. Mishra and M. W. Mahoney:Acta Mater.50(2002) 4419.