Prediction of Intermetallic Compound Formation Sequences
in Pseudo Binary Diffusion Couples:
Experimental Examinations for (Sn-
x
Zn)
/
Cu (
x
=
2, 5, 10, 15, 20 and 25 mass
%
)
by a Kinetic Model with Thermodynamic Data Using MDR Diagram
Shinichi Terashima
1,+and Tsutomu Sasaki
21Advanced Technology Research Laboratories, Nippon Steel & Sumitomo Metal Corporation, Futtsu 293-8511, Japan 2Technical Planning Department, Nippon Steel & Sumitomo Metal Corporation, Tokyo 100-8071, Japan
A kinetic model based on the principle of maximum degradation rate of the total system free energy, MDR law, using thermodynamic data is applied to (Sn-Zn)/Cu diffusion couples to predict intermetallic compound phases and their order to be formed. According to this model, only £-Cu5Zn8is predicted to appear when Zn content is less than 10 mass%, while both£-Cu5Zn8and¾-CuZn4can exist with 10 mass%Zn or more, which was in a good agreement with EPMA and TEM observations of Cu plates dipped into Sn-Zn baths. Therefore, it is concluded that the phase prediction based on the MDR law can also be applied to pseudo binary diffusion systems. [doi:10.2320/matertrans.M2014151]
(Received April 24, 2014; Accepted August 18, 2014; Published September 20, 2014)
Keywords: intermetallic compound, interfacial reaction, diffusion couple, phase prediction, modeling, lead-free solder
1. Introduction
Because of a wide use of mobile electronic devices, a risk of failure of these devices is increasing by dropping them accidentally. Usually, long term reliabilities against these accidents are evaluated by drop tests.
Regulations to evaluate drop reliabilities for electronic devices (JESD22-B1101) and JESD22-B1112)) are proposed
by Joint Electron Device Engineering Council (JEDEC), where evaluations are carried out using an impact pulse with a peak acceleration of 1500 G and a pulse duration of 0.5 ms. In the literature, many researchers have evaluated drop reliabilities of lead free solder interconnects under above regulations, and reported that cracks caused by the drop test propagate through inside or near brittle intermetallic com-pound phases, which form between lead-free solders and electrodes.3,4)
Namely, intermetallic compound phases formed between a lead-free Sn-based solder and electrodes on an electric device or a printed circuit board plays an important role especially for mobile electronic products.
In order to clarify the relationship between intermetallic compound phases and drop reliabilities, a formation of these phases should be well understood. In most studies, intermetallic compound phases to be formed at a diffusion couple are predicted based on a diffusion path derived with thermodynamical calculations.59)However, phases formed at
some diffusion couples cannot be predicted precisely by these calculations. For instance, ¾-CuZn4 is predicted as a major
phase at (eutectic Sn-8.8 mass%Zn)/Cu diffusion couple,8)
but£-Cu5Zn8is observed as thefirst phase or¾-CuZn4cannot
be seen from experimental results in the literature.8,10) Hence, there have been several attempts using above thermodynamic calculations to predict the first intermetallic compound phase or intermetallic compound formation sequence by comparing driving forces of homogeneous
nucleation of intermetallic compound phases,7,8) activation energies for homogeneous nucleation of intermetallic com-pound phases,9)effective heat of formation of an intermetallic compound phase (EHF model),11) or by applying modified Jonson-Mehl-Avrami-Kolmogorov kinetic equation for pre-cipitation.12)Except EHF model, competitive aspect of these
models leads to a conclusion that a couple of intermetallic compound phases could form first at the interface simulta-neously while one intermetallic compound phase formsfirst then another intermetallic compound phase forms next in experimental observations. With EHF model, one can avoid this competitiveness with successful predictions of the first intermetallic compound phases. However, this model requires a special treatment for the predictions mentioned above, that is to say, this model uses two values of composition even at the reaction interface between two phases.
It is expected these differences can be solved if a reaction rate of a system is taken into account to the model. Sasaki et al.has proposed a kinetic model based on the principle of Maximum Degradation Rate of the total system free energy (MDR law) using thermodynamic data, and reported its successful application to both Cu/Sn and Ni/Sn diffusion couples by revealing good agreements of the predicted first and second phases based on this model with those observed experimentally.1315)
In this paper, MDR law is applied to (Sn-xZn)/Cu (x=2, 5, 10, 15, 20 and 25 mass%) diffusion couples, and the first and the second phases predicted by this model are compared with those observed experimentally (at 613,16) 653 and 673 K) in order to reveal an effectiveness of the MDR law even in the pseudo binary diffusion system.
2. Experimental Procedure
Cu plates (width: 10 mm, length: 50 mm, thickness: 2 mm) were cleaned by 10% diluted hydrochloric acid, and were dipped for 90 s into one of the melted Sn-xZn (x=2, 5, 10, 15, 20 and 25 mass%) baths which were kept at 613 K under +Corresponding author, E-mail: terashima.s9k.shinichi@jp.nssmc.com
an Ar atmosphere in our previous paper.16) In the present
paper, specimens were also prepared in Sn-10 mass%Zn and Sn-15 mass%Zn baths which were kept at 653 or 673 K under an Ar atmosphere.
After dipping, phases formed at the soldered interface were characterised by electron probe micro analyzer (EPMA), JEOL JXA-8230, operated with an LaB6 filament at 20 kV
under 100 nm steps using cross sections of metallographically prepared samples. In order to identify the crystal structures of the phases, a field-emission transmission electron mi-croscopy (FE-TEM, type: JEM-2100F) operated at 200 keV was employed. Specimens for TEM observation were prepared by a focused ion beam (FIB) apparatus.
3. Model for Intermetallic Compound Phase Formation
In this section, MDR law1315)is explained briefly and the
model for intermetallic compound phase formation at the interfaces of diffusion couples is explained.
MDR law is an assumption that a system chooses a path which gives the largest degradation rate of free energy of the system among feasible paths. In other words, a path with the most negative value of @G/@t is realized, where G is the system Gibbs free energy. Cahn proposed a model based on MDR to explain lamella structures observed in carbon steel.17)Recently, MDR law was applied to silicide formation at metal/Si interface,1821)amorphous phase formation,22)and
oxygen precipitation in Si.23)
In this model, intermetallic compound phase formation is described as a chemical reaction at the interface of a diffusion couple of metals X and Y, where intermetallic compound phasesXAYB,XCYD, and so on are formed at X/Yinterface.
The reactions are expressed as follows;
XþB
AY¼ 1
AXAYB; Xþ D CY¼
1
CXCYD;. . .: ð1Þ
For these reactions, supply rates of both metals to the reaction region, X/Yinterface, are introduced as rXand rY,
respectively.
In addition to the MDR law, the following assumptions are postulated.
(1) The reaction of intermetallic compound formation at the interface gives the largest change in the system total free energy of a diffusion couple.
(2) The reaction is limited by the supply of a metal with lower supply rate. Here, the ratio of the supply rates is assumed to be the ratio ofX/Yat liquidus minimum inX-Y binary phase diagram.
The second assumption is the Walser-Bené rule successful for silicide formation prediction24) and is supported by the thermodynamic discussion by Bené25)in which an interface composition is likely to be that of liquidus minimum.21)This well coincides to the assumption that the supply rate of a metal with higher melting point is lower than that of a metal with lower melting point as shown in the previous paper, in which the first phases are predicted for Cu/Sn and Ni/Sn interfaces.13)It seems to be reasonable to consider that in the
case of a metal with higher melting point atoms of the metal at the interface, i.e., at the surface exposed to the reaction region, are more tightly bound to their matrix compared to
another metal with lower melting point. In the present (Sn-Zn)/Cu system, Cu is assumed as the atom which limits the reaction of intermetallic compound formation since Cu has the higher melting point (³1358 K) than Sn (³469 K) or Zn (³693 K).
Assuming metal X to be the rate limiting one, the supply rate of X to the interface,rX, is smaller than that of Y,rY. X
atoms at the surface exposed to the reaction region, namely X/Y interface, are released from their matrix to the reaction region at the rate ofrX, while Y atoms are sufficiently supplied
to X/Y interface at the rate ofrY, which is larger thanrX.
When one X atom is supplied to the reaction region and react withYatoms of an amount of B/A, the system energy changes by"Gf©XAYB; per X atomª. The energy change in a
unit time,@G/@t, is the product of the supply rate of X,rX, and
the formation energy per X atom,"Gf©XAYB; per X atomª,
@G
@t ¼rXGfhXAYB; per X atomi: ð2Þ
Similarly, for another intermetallic compound phase XCYD, the energy change in a unit time is
@G
@t ¼rXGfhXCYD; per X atomi: ð3Þ
In order to predict which phase formsfirst at the interface, XAYB or XCYD, the products in eqs. (2) and (3) are
compared. In this model, the phase with more negative value of the product is predicted to be the first phase. If rX"Gf
©XAYB per X atomsª is more negative, the intermetallic
compound phase, XAYB, is predicted to be formedfirst.
Applying this model to Cu/Sn and Ni/Sn interfaces, the first intermetallic compound phases are successfully pre-dicted.13)In these cases, instead of the formation energy"G
f,
the formation enthalpy "Hf at 298 K is used since "Hf at
298 K is more easily available in the literatures for many intermetallic compound phases and this approximation is also successful in other first intermetallic compound phase predictions.11,1921) Therefore, in this paper, the products r"Hf are compared for intermetallic compound phase
formation in MDR diagrams explained in the next section. Because intermetallic compound phases formed at the reaction temperature (613, 653 and 673 K),"Hfof the exact
reaction temperature should be utilized to draw MDR diagrams ideally. However, "Hf of the near reaction
tem-perature were used in this paper. Namely,"Hfat 723 K26)is
used for¾-Cu3Sn formation, and"Hfat 773 K26)are utilized
for£-Cu5Zn8and¾-CuZn4formations.
4. Results and Discussions
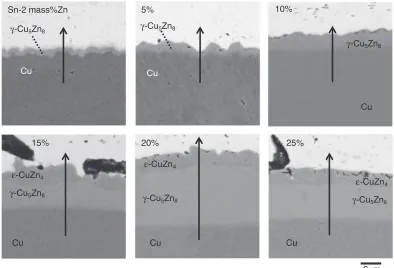
Figure 1 shows cross sectional SEM images of (Sn-xZn)/ Cu (x=2, 5, 10, 15, 20 and 25 mass%) diffusion couples prepared at 613 K.16) Arrows in Fig. 1 indicate lines for EPMA line measurements shown in Fig. 2.
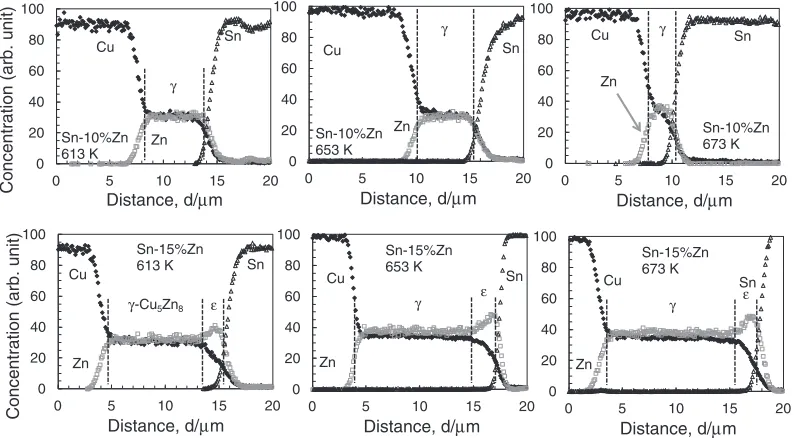
Figure 2 shows the EPMA line profiles of the (Sn-xZn)/Cu (x=2, 5, 10, 15, 20 and 25 mass%) diffusion couples.16)As
seen from thefigure, the diffusion couples withx=2, 5 and 10 mass% showed a single phase of£-Cu5Zn8, while those
with x=15, 20 and 25 mass% had two phases of ¾-CuZn4
Table 1 shows values ofA/Band the formation enthalpy,
"Hf, for¾-Cu3Sn (at 723 K)26)and for£-Cu5Zn8and¾-CuZn4
(at 773 K).26)A/Bwas calculated as a ratio of Aand Bof a XAYBphase, and"Hfper Cu was calculated using the value
of "Hfper formula shown in the literature.26)
If we assumerCuis constant when (rSnorrZn)/rCu>A/B, @G/@tcan be described as a constant value ofrCu"Hfper Cu,
while@G/@tlinearly changes along withrSnorrZnwhen (rSn
or rZn)/rCu<A/B. Figure 3 shows the relationship between
r"HfandrZn/rCuorrSn/rCufor¾-Cu3Sn (at 723 K) and for£
-Cu5Zn8 and ¾-CuZn4 (at 773 K), which is called as MDR
diagram14)plotted under above assumptions.
4.1 (Sn-xZn)/Cu (x=2, 5 and 10 mass%)
According to Walser-Bené rule,24,25) an initial chemical
composition at a reaction interface of a diffusion couple at
25%
Cu 20%
Cu 15%
Cu
10%
Cu 5%
Cu Sn-2 mass%Zn
Cu
γ-Cu5Zn8
ε-CuZn4
γ-Cu5Zn8
3μm
γ-Cu5Zn8
γ-Cu5Zn8
ε-CuZn4
ε-CuZn4
γ-Cu5Zn8 γ-Cu5Zn8
Fig. 1 Cross sectional SEM images of (Sn-xZn)/Cu (x=2, 5, 10, 15, 20 and 25 mass%) diffusion couples prepared at 613 K.16)Arrows indicate lines for EPMA line measurements shown in Fig. 2.
0 20 40 60 80 100
0 5 10 15 20
Cu Sn
Zn
20%
Distance, d/μm
0 20 40 60 80 100
0 5 10 15 20
Cu Sn
Zn 25%
Distance, d/μm
0 20 40 60 80 100
0 5 10 15 20
Cu Sn
Zn
15%
Distance, d/μm
Concentration (arb. unit)
0 20 40 60 80 100
0 5 10 15 20
Distance, d/μm
Cu Sn
Zn 10%
0 20 40 60 80 100
0 5 10 15 20
Distance, d/μm
Cu Sn
Zn
5% 0
20 40 60 80 100
0 5 10 15 20
Distance, d/μm
Concentration (arb. unit)
Cu Sn
Zn
Sn-2 mass%Zn
γ-Cu5Zn8 ε γ ε γ ε
γ γ
γ
[image:3.595.101.495.70.338.2]Fig. 2 EPMA line profiles of (Sn-xZn)/Cu (x=2, 5, 10, 15, 20 and 25 mass%) diffusion couples prepared at 613 K.16)
Table 1 Values ofA/Band the formation enthalpy,"Hf, for¾-Cu3Sn (at 723 K) and for£-Cu5Zn8and¾-CuZn4(at 773 K).
Reaction A/B "Hfper
formula/cal g-atm¹1 "
Hfper Cu/kJ mol¹1
[image:3.595.98.497.389.608.2] [image:3.595.303.549.667.732.2]the beginning of the reaction can be considered as the composition where the temperature becomes the lowest in the liquidus line. If it is assumed that an initialrZn/rCuis related
with its initial composition, an initial rZn/rCu of Zn/Cu
diffusion couple can be calculated as 32 (=97/3) because its initial composition is about Zn-3 mass%Cu according to Walser-Bené rule.
In Fig. 3,£-Cu5Zn8and¾-CuZn4can be considered as two
major phases to be formed in the present diffusion system since they have smaller "Hf than ¾-Cu3Sn. An intersection
point between two lines of £-Cu5Zn8 and ¾-CuZn4 can be
seen whenrZn/rCuorrSn/rCuis about 5.3. In the present
(Sn-Zn)/Cu system, it can be considered that Zn is diluted by Sn. Hence, Zn concentration of the (Sn-Zn)/Cu whose rZn/rCu
is 5.3 can be estimated as 9.9 mass%Zn (=16.6 at%Zn= 5.3/32). Therefore, the diffusion couple of (Sn-xmass%Zn)/ Cu is predicted to reveal a single phase of £-Cu5Zn8 ifxis
smaller than about 10 according to the MDR law. ¾-CuZn4
[image:4.595.67.272.71.249.2]can only appear as the second phase when the reaction proceeds further. This corresponds to the results shown in
Fig. 1,16) namely, the diffusion couples of (Sn-xZn)/Cu
(x=2, 5 and 10 mass%), which had lower Zn concentration than the intersection point in Fig. 3, showed a single phase of
£-Cu5Zn8.
4.2 (Sn-xZn)/Cu (x=15, 20 and 25 mass%)
When the initial rZn/rCu is higher than the intersection
point in Fig. 3 (namely,rZn/rCu>5.3),¾-CuZn4grows as the
first phase because ¾-CuZn4 has the lowest r"Hf when
rZn/rCu>5.3 in Fig. 3. After the reaction proceeds,rZn/rCu
decreases with Cu diffusion toward the reaction surface, and
£-Cu5Zn8 appears as the second phase when rZn/rCu fell
below 5.3 since £-Cu5Zn8 has the lowest r"Hf when
rZn/rCu<5.3. Namely, the diffusion couples of (Sn-xZn)/
Cu (x=15, 20 and 25 mass%), which had higher Zn concentration than the intersection point in Fig. 3 show two phases of¾-CuZn4and £-Cu5Zn8. This again corresponds to
the results shown in Fig. 2.16)
4.3 (Sn-10Zn)/Cu and (Sn-15Zn)/Cu at 653 or 673 K In order to confirm that (Sn-10 mass%Zn)/Cu shows a single phase of £-Cu5Zn8 and that (Sn-15 mass%Zn)/Cu
shows two phases of ¾-CuZn4 and £-Cu5Zn8, further
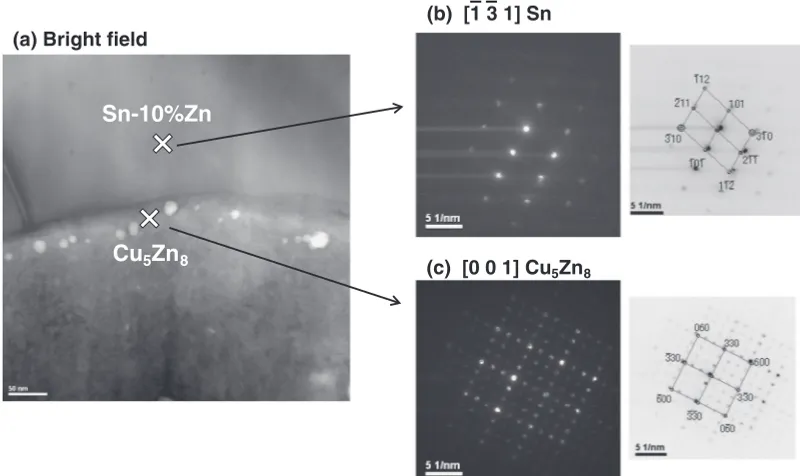
observation was performed even at elevated temperatures. Figure 4 shows the EPMA line profiles of (Sn-10 mass%Zn)/Cu and (Sn-15 mass%Zn)/Cu diffusion couples prepared at 613, 653 or 673 K. Figure 5 shows TEM images and diffraction patterns of (Sn-10 mass%Zn)/Cu diffusion couple prepared at 673 K. As seen from the figures, the diffusion couple of (Sn-10 mass%Zn)/Cu showed a single phase of£-Cu5Zn8, while that for (Sn-15 mass%Zn)/Cu had
two phases of¾-CuZn4and £-Cu5Zn8between Sn-Zn solder
and Cu even at elevated temperatures of 653 or 673 K. The results at elevated temperatures again correspond to the predictions from the MDR diagram shown in Fig. 3.
Therefore, it can be concluded that the phase prediction based on the MDR law is also effective in pseudo binary diffusion systems such as (Sn-Zn)/Cu diffusion couple. -50
-40 -30 -20 -10 0
0 5 10 15
r
Δ
Hf
(arb. unit)
rZn/rCu or rSn/rCu at constant rCu
ε-Cu3Sn
ε-CuZn4 γ-Cu5Zn8 Sn-25 mass%Zn
20% 15% 10% 5%
2%
Fig. 3 Relationship between r"Hf and rZn/rCu or rSn/rCu for ¾-Cu3Sn (at 723 K) and for£-Cu5Zn8and¾-CuZn4(at 773 K).
0 20 40 60 80 100
0 5 10 15 20
Distance, d/μm
Concentration (arb. unit)
Cu Sn
Zn Sn-10%Zn 613 K
0 20 40 60 80 100
0 5 10 15 20
Cu Sn
Zn
Sn-15%Zn 613 K
Distance, d/μm
Concentration (arb. unit)
0 20 40 60 80 100
0 5 10 15 20
Distance, d/μm
Cu Sn
Zn Sn-10%Zn 653 K
0 20 40 60 80 100
0 5 10 15 20
Distance, d/μm
Cu Sn
Zn
Sn-15%Zn 653 K
0 20 40 60 80 100
0 5 10 15 20
Distance, d/μm
Cu Sn
Zn
Sn-10%Zn 673 K
0 20 40 60 80 100
0 5 10 15 20
Distance, d/μm
Cu Sn
Zn
Sn-15%Zn 673 K
γ-Cu5Zn8 ε γ ε γ ε
γ γ
γ
[image:4.595.101.499.551.770.2]5. Conclusions
In this paper, MDR law is applied to (Sn-xZn)/Cu diffusion couples and the first and the second intermetallic compound phases predicted by this model were compared with those observed experimentally. Assuming that a supply of Cu, which has the higher melting point than Sn or Zn, limits a reaction of an intermetallic compound phase formation at a soldered interface, and that the reaction brings about the largest free energy change to the system in this model, thefirst and the second phases predicted well agreed with those observed experimentally. Namely, only£-Cu5Zn8
was observed when Zn content was 10 mass% or less, while both £-Cu5Zn8 and ¾-CuZn4 were indentified with
15 mass%Zn or more. Therefore, it can be said that the phase prediction based on the MDR law is also effective in pseudo binary diffusion systems such as (Sn-Zn)/Cu diffusion couple.
Acknowledgments
Thanks are due to Mr. Hidetoshi Yonekura and Mr. Masami Iwadate of Nippon Steel & Sumikin Technology Corporation (Japan) for sample preparation of EPMA measurement. One of the authors (ST) wishes to thank Dr. Yuri Mizuo of Nippon Steel & Sumikin Technology Corporation (Japan) for TEM observation.
REFERENCES
1) JEDEC Solid State Technology Association. JESD22-B110: Subas-sembly mechanical shock; (2001).
2) JEDEC Solid State Technology Association. JESD22-B111: Board level drop test method of component for handheld electronics products; (2003).
3) Y.-S. Lai, P.-F. Yang and C.-L. Yeh:Microelectron. Reliab.46(2006) 645650.
4) L. Xu, J. H. L. Pang and F. Che:J. Electron. Mater.37(2008) 880886. 5) K. Zeng and J. K. Kivilahti:J. Electron. Mater.30(2001) 3544. 6) H.-F. Hsu and S. W. Chen:Acta Mater.52(2004) 25412547. 7) B.-J. Lee, N.-M. Hwang and H.-M. Lee:Acta Mater.45(1997) 1867
1874.
8) H. M. Lee, S. W. Yoon and B.-J. Lee:J. Electron. Mater.27(1998) 11611166.
9) W. K. Choi and H. M. Lee:Scr. Mater.46(2002) 777781. 10) K. Suganuma, K. Niihara, T. Shoutoku and Y. Nakamura:J. Mater. Res.
13(1998) 28592865.
11) R. Pretorius, T. K. Marais and C. C. Theron: Mater. Sci. Eng.10(1993) 183.
12) H. Liu, H. Wang, W. Zhu, X. Tao and Z. Jin:J. Mater. Res.22(2007) 15021511.
13) T. Sasaki, M. Tanaka and Y. Ohno:Mater. Lett.61(2007) 20932095. 14) T. Sasaki and S. Terashima: Mater. Lett., to be published.
15) S. Sasaki: Doctoral Thesis, Kumamoto University, (2007) pp. 80101 (in Japanese).
16) S. Terashima and T. Sasaki: Mater. Lett., to be published. 17) J. W. Cahn:Acta Metall.7(1959) 1828.
18) R. W. Bené:J. Appl. Phys.61(1987) 18261833.
19) L. Zhang and D. G. Ivey:J. Appl. Phys.71(1992) 43144328. 20) L. Zhang and D. G. Ivey:Mater. Res. Soc. Symp. Proc.311(1993)
299304.
21) L. Zhang and D. G. Ivey: Thin Solid Films245(1994) 234248. 22) U. Gösele and K. N. Tu:J. Appl. Phys.66(1989) 26192626. 23) J.-Y. Huh, T. Y. Tan and U. Gosele:J. Appl. Phys.77(1995) 5563
5571.
24) R. M. Walser and R. W. Bené:Appl. Phys. Lett.28(1976) 624625. 25) R. W. Bené:Appl. Phys. Lett.41(1982) 529531.
26) R. Hultgren, P. D. Desai, D. T. Hawkins, M. Gleiser and K. K. Kelley: Selected Values of the Thermodynamic Properties of Binary Alloys, (American Society for Metals, Ohio, 1973) pp. 795822.
(c) [0 0 1] Cu5Zn8 – –
(b) [1 3 1] Sn
Sn-10%Zn
Cu
5Zn
8(a) Bright field
[image:5.595.97.497.76.314.2]