Characterization of AE Signals Generated by Gas Leak on Pipe
with Artificial Defect at Different Wall Thickness
Rem Nunez Laodeno
*, Hideo Nishino and Kenichi Yoshida
Faculty of Engineering, The University of Tokushima, Tokushima 770-8506, Japan
A unique behavior of acoustic signals occurred for each type of defect as evident in their respective time and frequency domains. Straight pinhole shows that the faster the gas leakage passes through the defect the greater the magnitude of amplitude of the generated AE signals was recorded. Scattered AE signals took place above the critical pressure due to large scale flow instability. For stepwise pinhole, the magnitude of amplitude is higher for a thicker wall dimension and has a common characteristics with a sudden dropped of amplitude over the transition of flow. In a similar manner, the cone-type pinhole shows other distinct characteristics for two different dimensions. When pressure is over 370 kPa unusual sound is generated for 1.0 mm wall thickness. On the other hand, only straight pinhole shows a decreasing peak frequency after reaching the critical pressure, which is attributed to screech tone characteristics. While for stepwise pinhole with 1.0 mm wall thickness, the peak frequency is generally higher compared with 2.0 mm wall thickness. The cone-type orifice have similar pattern with stepwise pinhole in terms of peak frequency. Generally, the dissimilarity of AE generated signals revealed a distinct characteristic for every type of pipe defect. And the
effect of stepwise deviation is extremely obvious in various depths. [doi:10.2320/matertrans.MRA2008175]
(Received June 3, 2008; Accepted July 25, 2008; Published September 10, 2008)
Keywords: acoustic emission, fast Fourier transform, gas leak, pipes
1. Introduction
It is now generally recognized that AE technique is extremely the best tool to determine the flaws from material structures as a nondestructive method. Over the years, Acoustic Emission (AE) testing method has been applied in monitoring and inspection of flaws specifically on gas leakage from pipeline installations through research in the
field and laboratory.1–7) Its application is considered as an
efficient and cost-effective process among other relevant methods. Such method could also be used to locate the leak source and could effectively characterize the development of defects such as deformation, corrosion, cracks, etc. Acoustic Emission is defined as a generation of the rapid release of strain energy that usually occurs within the material during a particular event in the defect development. However, in actual pipeline installations identifying the leak is a common problem that usually happens specifically when it is buried underground. At present, many researchers are paying attention to use the AE method in monitoring and inspection of flaws because of its appropriateness and usefulness as a non-destructive testing technique. Several research works have been carried out using acoustic emission (AE) method to characterize and analyze the flaws from pipeline installa-tions as quoted in the succeeding discussions. According to the report, it is shown that it is desirable to study small leak rates so that we could characterize them in the laboratory and reproduces as well in the field since the leakage rate is important in the context of environmental protection
regu-lation.1) Another study reported that the characteristic
frequency of acoustic emission due to gas leakage is
10 kHz.2) Acoustic emission studies on the attenuation of
elastic waves in pipelines and the acoustic noise environment associated with leak detection have been conducted on the basis that the AE amplitude is proportional to the leak energy
as mentioned.3–5)
At first, we have chosen these three types of defects in order to quantify the smallest possible defect from the material flaw that could be emanated in actual pipe installations. One of the advantages of this research study is the possibility to characterize the different AE signals generated from the gas leakage and eventually could enhance in the analysis of defect development during actual monitor-ing and inspection of pipelines. These types of defects are similar to the actual defect that might be developed through cracking of the material used in pipeline specifically the stepwise-type and cone-type defects. The dimension of these defects probably the smallest possible size that we might encounter during the inspection and monitoring of pipelines whether for small or large pipe diameter. And it is considered that it will vary significantly due to the energy release by the gas leakage or the pressure. So, it is very important that we should characterize the smallest defect using AE method. However, based on our observation all through out the experiment every type of defect has its unique characteristics. The characteristic curve that we have traced from the AE signals generated by gas leakage might probably be the same when the leakage will occur in the actual pipelines but its magnitude might probably differ as well. The critical pressure at 220 kPa was calculated based on the assumption
that the flow velocity reached to its sound velocity.6)When
this pressure is reached the shock cell is developed in which
the screech tone simultaneously took place.8,9) The screech
tone is characterized, as reported,10) as the feedback loops
driven by large-scale instability of waves of air flow. Other significant parameters that could characterize the air flow are the measurement of the Strouhal number and Reynolds number relative to the energy released emanated from the leakage.
The main objective of this study is to characterize and analyze the generated AE signals from gas leakage on pipe with artificial defect. It is essential to follow certain procedures especially the signal filtration process and the choice of the heuristic threshold level. A pressurized air
*Graduate Student, The University of Tokushima
cylinder has been used in order to eliminate the associated noise from the surrounding environment dissipated by moving parts and the mechanical equipment. We made several types of artificial defects such as straight-type, stepwise-type and cone-type pinhole. The process of evalua-tion on gas leakage has been continuously performed to perfectly determine the defects in material structures but it seems a lot of complexities come across during monitoring and inspection. Thus, this paper will enhance in establishing an appropriate procedure to resolve such problem.
2. Methodology
In this experiment, the same set-up of the experiment and
methods has been adopted from previous study.11)Figure 1
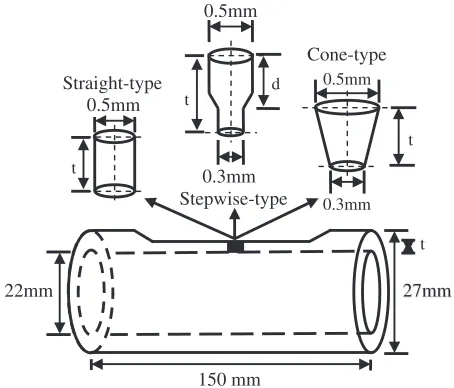
shows the set-up used during the conduct of the entire experiment. The steel pipe (SGP20A designated by JIS as Carbon Steel pipe for ordinary piping) has 27 mm outside diameter and corresponding length is 150 mm. The AE sensor (M5W, Fuji Ceramics), was attached to the flat surface of the specimen prepared with a reduced wall thickness and it was mechanically polished with #1000 grain sander where pinhole was formed using Electric Discharge Machine (EDM). At the middle portion of the specimen, as shown in Fig. 2, several artificial defects of varied dimensions such as straight-type, stepwise-type, and cone-type pinhole with 1.0 and 2.0 mm wall thickness were prepared. The straight-type
pinhole was made with a diameter () of 0.5 mm for two
different thicknesses (t) and the stepwise-type have two
different depths (d) such as 1.0 and 0.5 mm fort¼2:0and
1.0 mm, respectively. And the other artificial defect is the cone-type pinhole, which was prepared with inner and outer diameters of 0.3 and 0.5 mm for two thicknesses, respec-tively. In order to isolate the generated AE signals from unwanted noise emitted from the surrounding environment a heuristic threshold level was set to 45 dB. The total gain of 60 dB and a wideband pass filter ranging from 100 to 1200 kHz were considered prior to the test run. The high
frequency band (i.e.100–1200 kHz) was chosen because it is
clearly useful to detect the AE signals for relatively small pinhole less than 1.0 mm in diameter seemingly because
some difficulties in visualization are encountered during the
experiment.3,9) It is reported that the power spectrum in
Aeroacoustics moves to the higher frequency with increase of the flow rate and the sound due to the turbulence spreads out
to more broadband spectrum.12)It is considered also since it
appears that the elastic wave propagates at higher frequency (100–1200 kHz) through the medium and subsequently produces displacements on the surface that can be detected by the transducers. The AE signals were detected continu-ously at varying pressures from 100 to 500 kPa. The sensor location was fixed at a distance of 10.0 mm from the artificial defect. The flow of air coming from the cylinder was controlled by regulating the pressure valve.
In order to clarify the released energy due to air leakage, mean amplitude was numerically calculated from the digitized AE waveforms. As a result, the calculated mean amplitude is certain to be the relative energy released. Also, peak frequency was considered in our analysis since the frequency spectrum of the AE waveform clearly signify the
behavior of AE sources.3,13)
3. Results and Discussions
During online analysis the data were obtained using MISTRAS 2001 and subsequently were analyzed by FFT
process13)as shown in Fig. 3. It showed that AE waveform
generally differs from each other relative to pressure values and the nature of artificial defects. It was also observed that
upon reaching the critical pressure (cp) of 220 kPa, the shock
cell or the expansion wall was apparently developed at high pressure in which the screech tone simultaneously occurred. In this case the characteristic of screech tone for converging nozzle is generated because of the large-scale instability of waves from airflow. Upon continuous surging of air pressure it appears that the turbulent stage in all types of artificial defects was in effect.
3.1 Comparison of mean amplitude for different pipe wall thickness
As shown in Fig. 4, the two straight-type pinholes with
Main Valve
Pressure Gauge
Regulator Valve
V
Specimen
Pinhole cross section
Sensor
φ
Fig. 1 Set-up of the experiment and overview of the specimen.
0.5mm
0.3mm t
0.5mm
t
0.5mm
0.3mm
d t
Straight-type
Stepwise-type
Cone-type
27mm
t
150 mm
22mm 27mm
[image:2.595.312.539.73.267.2] [image:2.595.65.273.581.767.2]different wall thickness showed a distinct behavior of the AE generated signals. The faster the gas leakage that passes through the defect the greater the magnitude of amplitude of the signals was observed. AE signals were not stable when air flows through the defect due to the burst pressure at the nozzle lip over the critical pressure. For 2.0 mm wall
thickness the highest amplitude we recorded was 153 mV
while for t¼1:0mm the highest amplitude reached to
276 mV. The rapid fluctuations of amplitude from radiated signals occurred when the pressure is at higher value which shows the scattered amplitudes. In the case of stepwise-type defect, at the onset, a monotonic increase of amplitude took place since unsteady flow occurred at the nozzle lip region along with self-excitation of acoustic waves generated by pressurized gas leakage as shown in Fig. 5. Above the critical pressure sudden dropped of amplitude of about 2.5 mV and
4.3 mV fort¼1:0mm andt¼2:0mm, respectively,
appa-rently due to greater influence of waves instability during flow transition. Based on these results the wall thickness is considered to have greater effect on acoustic generation from leak. Also, the magnitude of amplitude is higher for a thicker wall dimension. During the flow transition a large-scale disturbance of signals took place which ensures the possi-bility of the rapid development of spiral waves or the vortex in the jet stream. In a similar manner, cone-type pinhole shows another distinct characteristic for two different dimensions shown in Fig. 6. When the pressure is over 370 kPa unusual sound is generated for 1.0 mm wall thick-ness. It seems that this unusual noise was due to the unstable acoustic wave generation at higher pressure. Above the critical pressure the amplitude tends to go up and down rapidly, however, a more stable peak frequency of acoustic signals have been recorded for both pipe wall thickness.
Sensor Pre-amplifier (60dB)
Band Pass Filter (100-1200kHz)
AE Analyzer (MISTRAS 2001)
FFT Analysis
Air Leakage
10 mm
Fig. 3 Flowchart for data analysis.
0 100 200 300
100 150 200 250 300 350 400 450 500
Pressure [kPa]
Mean Amplitude [mV]
0 100 200 300
100 150 200 250 300 350 400 450 500
Pressure [kPa]
Mean Amplitude [mV]
t=1.0mm t=2.0mm
153mV
276mV
c
pc
pFig. 4 Comparison of mean amplitude for Straight-type pinhole.
0 10 20 30 40
100 150 200 250 300 350 400 450 500 100 150 200 250 300 350 400 450 500
Pressure [kPa]
Mean Amplitude [mV]
0 10 20 30 40
Pressure [kPa]
Mean Amplitude [mV]
d=0.5mm, t=1.0mm d=1.0mm, t=2.0mm
4.3mV
c
p2.5mV
Fig. 5 Comparison of mean amplitude for Stepwise-type pinhole.
0 10 20 30 40
0 10 20 30 40
100 150 200 250 300 350 400 450 500 100 150 200 250 300 350 400 450 500
Pressure [kPa]
Mean Amplitude [mV]
t=2.0mm
Pressure [kPa]
Mean Amplitude [mV]
t=1.0mm
34.2mV
20.2mV
c
pc
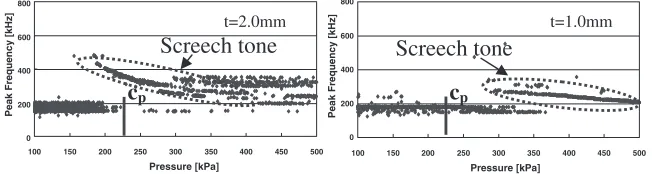
p [image:3.595.59.278.71.288.2] [image:3.595.142.457.418.502.2] [image:3.595.141.453.545.634.2] [image:3.595.142.456.679.767.2]3.2 Comparison of peak frequency for different pipe wall thickness
On the account of the above results, the peak frequencies of these AE signals will be presented. The peak frequency is the useful function of the direction of acoustic radiation. It can also be used to describe the screech tone development. In Fig. 7 the screech tone characteristics was demonstrated with a considerable amount of decreasing peak frequencies for straight-type pinhole. From this figure it is easily seen the downstream propagation of sound frequency. For a thicker wall the early development of screech tone is obvious in comparison with thinner wall dimension. On the other hand, in a general sense, the stepwise pinhole does not account for the completeness of screech tone behavior since the acoustic frequency should follow diminishing values for a wide increment of energy released during noise propagation, shown in Fig. 8. The steady occurrence of discrete acoustic frequency for two wall dimensions was evident. Although there was unsubstantial amount of decreasing peak
frequen-cies in the case of t¼1:0mm, the screech tone was not
totally developed. And eventually the appearance of this unusual noise banished right away. The multilayered values
of peak frequency especially fort¼1:0mm corresponds to
the three associated noise levels generated during the leakage such as excited acoustic, moderately excited and the pure tone signals. The excited acoustic signals registered the
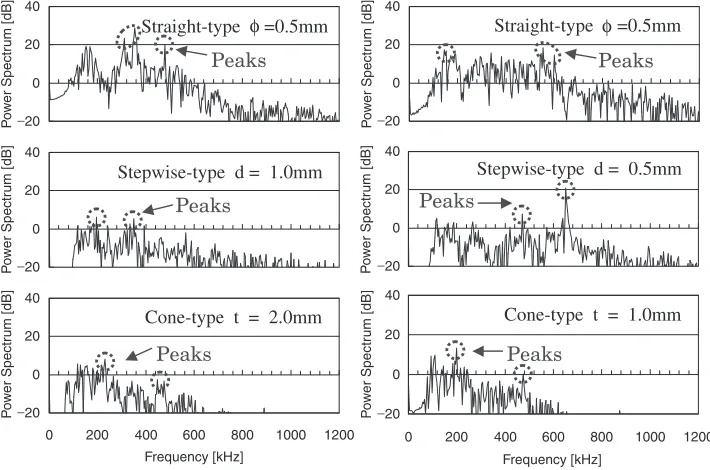
highest frequency values. This behavior was also evident for cone-type pinhole as shown in Fig. 9. In this case, as the pressure increases it seems that the frequency values have no significant difference for the two wall dimensions as they follow the same pattern. Except when pressure is over 350 kPa the occurrence of acoustic signals apparently attenuated. The peak frequency values for pure tone acoustic signals were below the mean values. The graphical presen-tation of peak frequency was drawn based on the raw AE which are processed entirely using FFT analysis. Each point in the plot represents the highest peak of frequency taken using averaging method as shown in Fig. 10.
3.3 Flow characteristics defined by dimensionless pa-rameter
To characterize the flow of air leakage it is worthwhile to emphasize the motion of the fluid at the nozzle lip region. In
this case, we have made a model of AE source14)to describe
the shock cell formed during the leakage. In order to demonstrate the latter it is necessary to determine the Strouhal number which could be defined by eq. (1). The Strouhal number denotes the oscillating phenomena in transonic jet stream.
St¼ ðflÞ=U ð1Þ
where St is the non-dimensional Strouhal number, f is the
0 200 400 600 800
0 200 400 600 800
100 150 200 250 300 350 400 450 500 100 150 200 250 300 350 400 450 500
Pressure [kPa]
Peak Frequency [kHz]
Pressure [kPa]
Peak Frequency [kHz]
t=1.0mm t=2.0mm
c
pc
pScreech tone
Screech tone
Fig. 7 Comparison of peak frequency for Straight-type pinhole.
0 200 400 600 800
100 150 200 250 300 350 400 450 500
Pressure [kPa]
Peak Frequency [kHz]
Pressure [kPa]
Peak Frequency [kHz]
d=0.5mm,t=1.0mm d=1.0mm,t=2.0mm
c
pc
pScreech tone
100 150 200 250 300 350 400 450 500 0
200 400 600 800
Fig. 8 Comparison of peak frequency for Stepwise-type pinhole.
Pressure [kPa]
Peak Frequency [kHz]
t=1.0mm
0 200 400 600 800
0 200 400 600 800
100 150 200 250 300 350 400 450 500 100 150 200 250 300 350 400 450 500
Pressure [kPa]
Peak Frequency [kHz]
t=2.0mm
c
pc
p [image:4.595.135.461.75.162.2] [image:4.595.133.461.207.304.2] [image:4.595.129.460.348.437.2]frequency in kHz, l is the relative distance between the
pinhole and the shock cell inmmshown in Fig. 11 andUis
the air flow rate in m/s. When the logarithm of the Reynolds number is between 2 and 5, the corresponding Strouhal
number should be 0.2.15)In this study, it showed that the log
of Re is also within the given range of values.
The Reynolds number, given by eq. (2), could be specified by three parameters such as velocity, linear dimension and the absolute viscosity of the fluid wherein it is useful in the determination of the flow structure whether it is laminar or turbulent.16,17)
Re¼ ðUtÞ= ð2Þ
also,
¼= ð3Þ
¼1:783105ðT=273:2Þ2=3 ð4Þ
RT ¼RT0=ðþ1Þ ð5Þ
wheretis the pinhole wall thickness in m,is the kinematical
viscosity in m2/s,is the absolute viscosity in Ns/m2,1is
the density of high pressure air in m3/kg,T andT0 are the
operating temperatures at the exit and inlet of the pinhole in
K, respectively,is 1.4 for air andRis the gas constant in
Ref. 18). The flow velocity (U) is based on the assumption
that it reaches the sound velocity given as 343 ms1.
The rate of airflow steadily increases as the pressure increases at which the transition stage occurred when the pressure is at critical value. Between the two thicknesses, the higher the Reynolds number the thinner the wall dimension was observed. However, at the onset of the flow they have almost the same values when pressure is at 100 kPa and as the pressure increases their difference also increases seemingly due to the effect of the wall thickness.
3.4 The AE source model
While the generation of AE is concerned during the air leakage, we have conceptualized a schematic model to describe the source during which the excitation happens within the flow structures. As discussed in previous paper, which states that the appearance of vortices occurred at the wall along the stepwise deviation specifically for
stepwise-type.14) On the other hand, looking at the straight-type
pinhole wherein the AE source occurs when shock cells were developed due to the excitation above the nozzle lip region as
0 20 40
P
o
w
er Spectr
u
m [dB] Straight-type =0.5mmφ φ
Peaks
0 20 40
P
o
w
er Spectr
u
m [dB]
0 20 40
P
o
w
er Spectr
um [dB]
Straight-type
Stepwise-type d = 1.0mm
Peaks
0 20 40
0 200 400 600 800 1000 1200 0 200 400 600 800 1000 1200
Frequency [kHz]
P
o
w
er Spectr
u
m [dB] Cone-type t = 2.0mm
0 20 40
P
o
w
er Spectr
um [dB]
Stepwise-type d = 0.5mm
0 20 40
Frequency [kHz]
P
o
w
er Spectr
u
m [dB] Cone-type t = 1.0mm
Peaks
Peaks
Peaks
Peaks
=0.5mm
−20
−20
−20
−20
−20
[image:5.595.119.474.74.309.2]−20
Fig. 10 Power spectrum showing the peaks of AE signals.
Stepwise-type
Vortex Shock
cell
Specimen Wall
thickness
AE Source
l
Straight-type Streamlines
Cone-type
[image:5.595.140.456.349.489.2]shown in Fig. 11. The first shock cell apparently took place a little over the nozzle lip and soon and so forth until it banish at the far field of the flow. This holds through when the development of screech tone actually happening specifically for straight pinhole type of defect. Apparently for other type
of defect (i.e. cone-type) the AE source seems to be at the
throat of the pinhole.
4. Conclusions
We have presented the different characteristic curves which showed its distinctive behavior for various artificial pipe defects. The uniqueness of the acoustic signals seems to be the greater effect of the kind of defect which the leakage emanates. In all cases, the transition of flow usually occurs when the pressure reaches its critical value. These results could be used in evaluation and analysis of flaws commonly encountered in monitoring and inspection of pipeline installations. Based on our observations and analysis we therefore conclude the following:
(1) Straight-type pinhole showed that the amplitude of generated AE signals differs on wall thickness and rapid fluctuations occurred over critical pressure specifically for 1.0 mm wall thickness which has higher amplitude. These types of defect manifest the characteristics of screech tone as evident in their respective spectral frequency curves.
(2) In the case of stepwise-type, higher value of amplitude at the onset is evident apparently due to self-excitation of unstable wave within the flow structures which generally caused by stepwise effect. And the sudden dropped of amplitude above critical pressure was due to the large disturbance of air flux at the nozzle lip region during transition stage.
(3) Finally, another distinct behavior of AE signals was traced out for cone-type pinhole in which the unusual sound appeared to be during the unstable acoustic wave generation at higher pressure. Also, over the critical pressure the amplitude tends to go up and down rapidly but steady frequency values of acoustic wave have been recorded.
Acknowledgement
The authors would like to extend their profound gratitude to the Tokushima Prefecture Center for Industry and Technology with special mention to Mr. Hitoshi Ogawa who shared his time and effort to us in the preparation of all the specimens used in this research study.
REFERENCES
1) R. K. Miller, A. A. Pollock, D. J. Watts, J. M. Carlyle, A. N. Tafuri and
J. J. Yezzi Jr.: J. NDT&E Inter. Elsevier32(1999) 1–8.
2) M. Kotani, H. Hirano and K. Akazawa: SICE.35(1999) 554–559.
3) K. Yoshida, H. Kawano, Y. Akematsu and H. Nishino: Proc. EWGAE (2004) pp. 321–326.
4) A. E. Lord, Jr., J. N. Diesher and R. M. Koerner: J. Mater. Evaluation
35(1977) 49–54.
5) E. G. Eckert, M. R. Fierro and J. W. Maresca, Jr.: J. Mater. Evaluation
52(1994) 954–958.
6) K. Yoshida, Y. Akematsu, K. Sakamaki and H. Horikawa: J. Acoustic
Emission21(2003) 223–229.
7) R. K. Miller, A. A. Pollock, D. J. Watts, J. M. Carlyle, A. N. Tafuri and J. J. Yezzi Jr.: Acoustic Emission: Standards and Technology Update, ASTM STP 1353 (1999) 67–70.
8) Y. Akematsu, K. Yoshida, K. Sakamaki and K. Horikawa: Progress in Acoustic Emission XI, (The JSNDI, 2002) pp. 319–324.
9) T. Kawano, K. Yoshida and K. Horikawa: National Conference on Acoustic Emission, JSNDI (2003) VI–3, pp. 113–116.
10) Y. K. Yu, R. H. Chen and L. Chew: AIAA Journal36(1998) 1968–
1974.
11) R. N. Laodeno, H. Nishino and K. Yoshida: Proc. 6th Inter. Conf. on AE, ed. by K. Ono, (Advances in AE 2007) pp. 173–178.
12) Fluid Mechanics Association of Japan:Handbook of Fluid Mechanics,
(Maruyoshi Publishing Co., 1998) p. 612.
13) T. Ankyoin and M. Nakajima: How to Use FFT, (Akiba Publishing Co., 1987) p. 11.
14) Y. Akematsu, K. Yoshida, K. Sakamaki and K. Horikawa: Proc. 25th European Conf. on Acoustic Emission Testing, (EWGAE 2002) pp. 15– 20.
15) T. Ikui and M. Inoue:Viscous Fluid Dynamic, (Rikougaku Publishing
Co., 1978) p. 227.
16) R. L. Daugherty and J. B. Franzini:Fluid Mechanics with Engineering
Applications, 7th ed. McGraw-Hill, (1977) pp. 257–263.
17) L. D. Landau and E. M. Lifshitz:Fluid Mechanics, (Addison-Wesley
Publishing Co., 1963) pp. 61–63.