Munich Personal RePEc Archive
Will a Universal Health Coverage Policy
be fiscally sustainable for India? New
evidence and implications
Muttur Ranganathan, Narayana
Institute for Social and Economic Change
22 February 2016
1 Will a Universal Health Coverage Policy be fiscally sustainable for India?
New evidence and implications for India
M.R. Narayana
Centre for Economic Studies and Policy Institute for Social and Economic Change
Bengaluru 560072, INDIA
mrnaryana@yahoo.com
This paper analyses the fiscal sustainability of India’s recently proposed Universal Health Coverage Policy (UHCP) over the period 2005-2100. Public expenditure on UHCP is calculated by combining the age profiles of public and private health consumption expenditure in the framework of National Transfer Accounts. Fiscal sustainability of UHCP is determined by using the concept and measure of Generational Imbalance in Generational Accounting. In general, the results show that India’s current fiscal policies are not sustainable in both the Baseline and UHCP expenditure scenarios. However, other things being the same, fiscal sustainability of public expenditure on the UHCP is attainable in both the policy scenarios if the income elasticity of public expenditure on social welfare and health expenditure is less than unity. These new results offer evidence and strengthen the arguments for implementation of proposed UHCP by justifying its fiscal sustainability.
Key words: Universal Health Coverage, Public health expenditure, Fiscal sustainability, National Transfer Account, Generational imbalance, Generational Accounting, India
JEL codes: H51, I18 and J11
1. INTRODUCTION
2 Package (NHP) of essential primary, secondary and tertiary health care services that will be funded by the government. The expected outcomes of UHC include financial protection, greater equity, improved health outcomes, reduced poverty, greater productivity and increased employment/jobs. 1 In this context, this paper argues that the current proposal to India’s UHC may be strengthened by explicit recognition and inclusion of sustainability of current fiscal policies in the presence of expected public expenditure on the UHC. This is contributory to the existing literature on public health
care expenditure in India, such as, Rao, Choudhury and Anand (2010), Rao and Choudhury (2012), Mukherjee (2015) and Gupta and Chowdhury (2015), because these papers have focused primarily on the short-run with little scope for the fiscal sustainability issues.
The main objectives of this paper are to analyses the economic implications of fiscal sustainability on India’s recently proposed Universal Health Coverage policy (UHCP) above by answering the following research questions. What are the health expenditure requirements for implementation of a proposed UHC policy? How can such expenditures be projected in future? What are fiscal options to financing a UHC policy above? If a proposed UHC policy is entirely pubic-funded, non-means tested and non-contributory, can it be sustained by current fiscal policies? If not, what are additional conditions required to attain fiscal sustainability under the proposed UHCP? To answer these questions, this paper calculates a new measure of age specific consumption of UHC by combining the age profile of public and private health consumption by using the National Transfer Accounts methodology [Mason and Lee, 2011; United Nations, 2013a)]. Fiscal sustainability of UHCP is evaluated by the Generational Accounting methodology [Auerbach and Kotlikoff, 1999], which determines fiscal policy initiatives on the “net tax burden” (tax payments net of benefit transfers) on current and future generations by using the concept and measure of Generational balance [or what a fiscal policy initiative that is
1
3 generous to current (and future) generations does to the net tax burden of future generations.2
Rest of the paper is organized as follows. Section 2 highlights the key fiscal policy issues in India’s public health expenditure since 2000. Methodology, variables and data are presented in section 3. Main results are analyzed in section 4. Section 5 includes major conclusions, implications and extensions.
2. KEY FISCAL ISSUES IN INDIA’S PUBLIC HEALTH EXPENDITURE
Historically, India’s public expenditure on health has been low. For instance, National Accounts Statistics of the Central Statistical Office provide estimates of private health consumption (or Final Private Consumption Expenditure on medical care and health services) and public health consumption (or Final Government Consumption Expenditure on health and other services). Over the period 2000-01 to 2012-2013, the public (or private) health consumption is less than 1 (or 3.5) percent of GDP or total health consumption is less than 4 percent of GDP. At the same time, share of public health expenditure has remained less than 5 percent of total public expenditure and 2 percent of GDP. Further, India’s public expenditure on health in total expenditure on health (21.48%) is the lowest as compared to many developing Asian countries including China (38.8%), Malaysia (44.8%), Indonesia (46.6%), Pakistan (17.5%), Sri Lanka (46.2%), Bangladesh (29.1%), and Nepal (28.1%).3
Interestingly, India’s health insurance market is public-sector dominated (Sen, 2014). By 2010, about 302 million or 25 percent of total population was covered by health insurance with 95 percent coverage by the general government’s (i.e. Central and State
2
Fiscal sustainability is important because the fiscal condition of the general government is already poor due to persistence of fiscal deficit and its debt financing. For instance, the actual combined gross fiscal deficit of the Central and State governments as a percentage of GDP has varied from 9.2 percent in 2000-01, 7.2 percent in 2004-05, 8.3 percent in 2008-09 and 7.4 percent in 2012-13.[Reserve Bank of India, accessed on 4 August 2015 at .http://dbie.rbi.org.in/DBIE/dbie.rbi?site=statistics].
3
4 governments) various schemes, such as, Employees State Insurance Scheme or, ESIS (18%), Rashtriya Swasthya Bima Yojana (26%), Rajiv Aarogyasri Scheme of Andhra Pradesh (23%) and Kalignar Scheme of Tamil Nadu (12%).4 Except ESIS, however, all other insurance schemes are not comprehensive because their coverage is limited to inpatient tertiary health care services.
Given the above current low levels of public expenditure on health and limited
coverage of public health insurance schemes, the proposed UHCP needs a careful consideration on additional public funding requirements in the long run. This is reflected in the HLEG’s recommendations, such as, (a) increase the share of public expenditure by Central and State governments from 1.2 percent in 2011-12 to 2.2 percent of GDP in 2016-17 and to 3 percent by 2022; (b) use general taxation as the principle source of health care funding; and (c) not to use insurance companies or any other independent agencies to purchase health care services on behalf of the government. In terms of per capita public expenditure, the increase in public health care spending (at 2009-10 prices) is projected to grow from INR675 in 2011-12, INR1975 in 2016-17 and INR3450 in 2022. This projection is based on the assumptions that total (public + private) health expenditure would remain at 4.5 percent of GDP, a real growth rate of GDP at 8 percent at 2009-10 prices and projected population totals by the Registrar General of India. Our methodology refines the above health expenditure projections for the proposed UHC and examines its fiscal sustainability.
3. METHODOLOGY, VARIABLES AND DATA
Our methodology aims at age-specific projections of public health expenditure and how a policy move towards a publicly funded UHC for the current and future population may be expected to exert a big fiscal pressure on public expenditure and general taxation in terms of sustainability of current fiscal policies. National Transfer Accounts (NTA) and Generational Accounting (GA) are our proposed methodologies. These
4
5 methodologies are explained below along with the variables and data required to implement them.
3.1. National Transfer Accounts Methodology
National Transfer Account (NTA) is a useful framework for calculation of age profiles of macroeconomic variables. This framework, consistent with the National
Income Identity, is established by the following NTA-Flow Account Identity (suffix “f” stands for private sector, “g” for public sector and “i” refers to individual or age group).
YL,i + YA,i + (Tf,i+ + Tg,i+), = (Cf,i + Cg,i) + Si + (Tf,i- + Tg,i-), (1)
where YL,i is labour income, YA,i is non-labour or asset income, Tf,i+and Tf,i- are private
transfer inflows and outflows respectively; Cf,i is private consumption expenditure, Cg,i
is public (government) consumption expenditure, Si is savings, , Tg,i+ and Tg,i- are public
transfer inflows and outflows respectively. The left hand side of equation (A.1) shows total inflows and the right hand side shows total outflows. Net exports are indirectly introduced in (1) to take care of Rest-of-World (ROW) by including net compensation of employees from ROW in YL,i and net entrepreneurial income from ROW in YA,i. This implies that (1) is consistent with an open macro-economy. However, individual is the fundamental entity in the NTA and all flows are disaggregated at individual level by age.
Health consumption is included in the calculation of public and private sectors transfer inflows in (1) and measured by age profiles of public and private health consumption expenditure. As per the recommendations of the HLEG on UHC [Planning Commission, 2011], people may have a choice of health facilities provided by public sector or contracted-in private providers (i.e. NGOs and non-profits). The private providers who opt for participation in the UHC would be required to provide at least 75 percent of out-patient and 50 percent of in-out-patient services to all in the NHP. The cost of these services
6 privately purchased insurance policies. 5 This implies that under the proposed UHC, public expenditure on health would be approximately equal to the total (public plus private) health consumption expenditure. Accordingly, a measure of age profile of UHC is calculated by combining the age profiles of public and private health consumption. This age profile is a measure of observed health consumption for UHC in the benchmark.
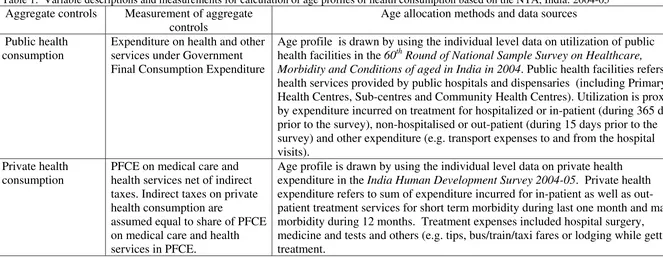
For lack of time series data, age profile of health consumption expenditure is
calculated for the benchmark year, 2004-05. Data and variable descriptions for calculation of cross-sectional age profiles of public and private health consumption are given in Table 1.
3.2. Generational Accounting methodology
We use Auerbach and Kotlikoff (1999) methodology of Generational Accounting (GA) to evaluate the sustainability of current fiscal policies and construct the GA for India as given in Narayana (2014). In general, GA methodology is based on government’s inter-temporal budget constraint. The constraint requires that the future net tax payments of current and future generations be sufficient, in present value, to cover the present value of future government consumption as well as service the government’s initial net debt as given in equation (2).
(2) tg
t s t s s t s s t t D s s t
t
N
G
r
W
N
+
∑
=
∑
+
−
∑
∞ = − − ∞ = + = − ) ( , 0,
(
1
)
The first summation on the left-hand side of (2) adds together the generational accounts of existing generations. The term Nt,t-s stands for the account of the generation born in
year t-s. The index s in this summation runs from age 0 to age D, the maximum length of life. The second summation on the left-hand side of (2) adds together the present value
5
7 of remaining net payments of future generations, with s representing the number of years after year t that each future generation is born. The first term on the right-hand side of (2) is the present value of government consumption. In this summation, the values of government consumption, Gs in year s, are discounted by the pre-tax real interest rate, r.
The remaining term on right-hand side, Wtg, denotes the government’s net wealth in t.
Thus, GA is defined as the present value of net payment (= tax paid minus benefit
received from the government) for the remaining lifetime. The account evaluated at the year t for the cohort born at the year k is expressed as equation (3).
(3)
∑
+
=
− −
+
=
k Dk t s t s k s k s k
t
T
P
r
N
) , max( ) ( , ,,
(
1
)
where Ts,k stands for the projected average net tax payments to the government made in
year s by the generation born in year k. The term Ps,k stands for the number of surviving
members of the cohort in year s who were born in year k. For the generations who are born in year k, where k>t, the summation begins in year k. A set of generational accounts is simply a set of values of Nt,k, one for each existing and future generation.
Equation (3) calculated in two steps. First, net payment of current generation is calculated based on the current fiscal policies without being constrained by the inter-temporal budget. Second, given the RHS of (3), net payment of the future generation is calculated as a residual. Thus, inter-temporal budget constraint fully determines the net payment of the future generation. Further, equation (3) indicates a zero sum nature of intergenerational fiscal policy. For instance, holding the RHS of (2) fixed, a reduction in present value of net payment of current generation implies an increase in net payment by future generations.
8 future generation and newborn (or age-0 cohort in the benchmark year) divided by the present value of net payment of the newborn. Current fiscal policies are sustainable if the value of GI is less than zero. This means that the lifetime net payment of future generation is smaller than that of current generation. Thus, to restore the long term budgetary balance, tax burden should be reduced, or transfer benefits should be increased, in future. In addition, fiscal sustainability is indicated by sustainability gap which is a ratio of government gap to sum of present value of GDP after the benchmark
year. Government gap is total value of the net payment of the future generation.
Construction of GA involves the following four steps: (a) projection of aggregates (i.e. aggregate value of taxes, transfers, and government consumption); (b) computing net payment of current generation; (c) computing net payment of future generation; and (d) evaluation of sustainability of fiscal policies. The variables and data descriptions for this construction for India are described below.
India’s GA is constructed for the benchmark year 2004-05. The choice of this benchmark year is based on the availability of survey and administrative data for calculations of age profiles of taxes (i.e. direct, indirect and non-tax revenues), transfers (i.e. education, health and cash including old age pensions) and labour income. All age profiles are based on the NTA methodology. In addition, construction of GA requires data for measurement of rate of technological progress, inflation rate, Government net wealth, GDP, Government consumption in benchmark year, and projected population. These parameters, variables and age profiles are taken from Narayana (2014) for the entire analyses of GA here. All the GA calculations are based on the computational GA model of Young (2014). Population projections are based on the UN Population Projections (Medium Variant by single year of age) [United Nations, 2013b].
3.3. Health expenditure projections
9 the constancy of age profiles of health expenditure in 2004-05, as they are calculated by the NTA methodology in section 3.1 above. Projection is based, among others, on assumed values of income elasticity of public health expenditure and growth rate of GDP. Growth rate of GDP is equal to combined growth rate of productivity and working age population.
Sensitivity of fiscal sustainability to above projections of health expenditure and
assumptions of GA model (e.g. productivity growth, discount rates and income elasticity of public expenditure) is determined to present few fiscally sustainable policy options for implementation of the proposed UHCP for India.
4. MAIN RESULTS
4.1. Projected health expenditure for UHCP
10
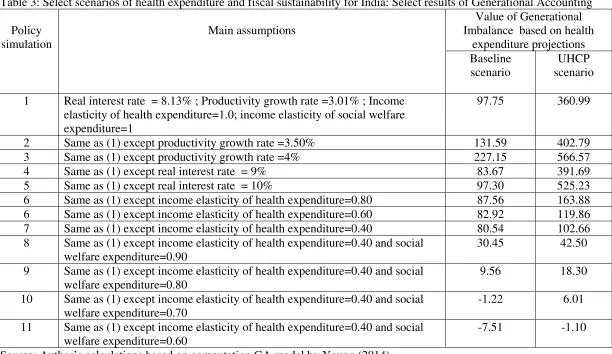
4.2. Fiscal sustainability of projected health expenditure
Table 3 summarizes the results of fiscal sustainability of current fiscal policies of India under two projections of health expenditure: Baseline and UHCP scenarios. In total, 11 policy simulations of fiscal sustainability are distinguished based on assumed values of productivity growth, discount rate and income elasticity of public health expenditure and income elasticity of expenditure on social welfare expenditure (e.g. old age pension).
Throughout, current fiscal policy is considered sustainable (or unsustainable) if the computed value of GI<0 (or GI>0). The results show that fiscal sustainability in the Baseline scenario is attainable if policy makers set the income elasticity of health expenditure at or below 0.40 and social welfare expenditure at or below 0.70. The condition for attainment of fiscal sustainability is more stringent for UHCP scenario as it requires the policy makers to set the income elasticity of health expenditure at or below 0.40 and social welfare expenditure at or below 0.60.
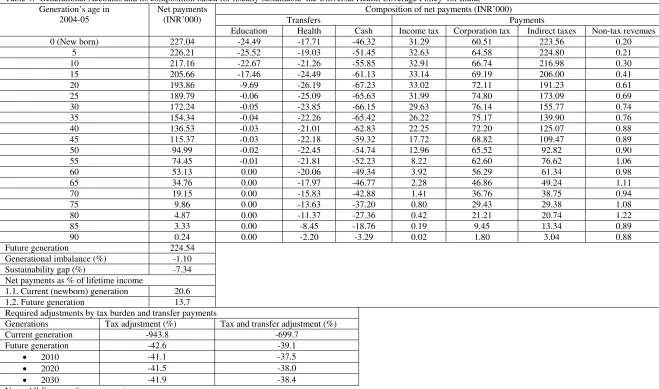
Table 4 gives the complete GA results for the current fiscal policies in the benchmark year 2004-05 under the sustainable UHCP scenario (or UHCP scenario in simulation 11 with GI equals to-1.10) in Table 3. The GA is presented for the combined generation (i.e. without distinguishing generations by male and female) and at every fifth age, ranging from age 0 to 90. Following the standard reporting practice of GA, per capita value rather than the aggregate net tax payment value for each generation is presented.
The net payment [i.e. present value of all taxes a person of each generation can expect to pay to the general government over his/her lifetime minus transfers that person can expect to receive from the general government from the benchmark year through the future years]. The net payment is positive for the current as well as for the future generations. This means that the generations are projected to pay more in taxes than it would receive in transfers over its remaining life time. The higher net payment is strongly driven by (a) low amount of transfers in general and health transfers in
11 Interestingly, the age pattern of net payment is not characterized by a lifecycle pattern because India’s elderly are net tax payers rather than net beneficiaries of public transfers.
The generational imbalance between the newborn and future generations is -1.10 percent. This implies that the future generations must pay, on an average, about 1.1 percent less net taxes as newborn generations. Thus, current fiscal policies are sustainable in the context of UHC scenario over the period 2005 to 2100. The
sustainability gap is -7.34 percent. This means that the required reduction/adjustment in future taxes and/or transfers is about 7 percent of the present value of future GDP. Further, net payment as a percentage of lifetime income is positive for the current (newborn) and future generations. In particular, the percentage is higher for the current generation (21 percent) than future generation (14 percent).
12 5. MAJOR CONCLUSIONS AND IMPLICATIONS
Using the methodology of the NTA and GA, this paper has analyzed the fiscal sustainability of proposed UHC policy for India for the bench mark year 2004-05. Fiscal sustainability is policy important because of its long run implications on tax-benefits adjustments between current and future generations. Fiscal sustainability is evaluated by using the projected current public health expenditure (or Baseline scenario) and
projected UHCP expenditure (or UHCP scenario). Major conclusions and implications from these analyses are as follows.
In the context of this paper, UHC is defined from the consumption side and measured by a combined age profile of private and public health consumption. This measure is entirely pubic-funded, non-means tested and non-contributory. The projected public expenditure on UHCP is sensitive to the assumption on the benchmark age profile of health expenditure, growth rate of GDP and age structure transition. These assumptions generate different scenarios of health expenditure projections and show their sensitivity to attainment of fiscal sustainability in the framework of GA.
Given the observed discount and productivity growth rates and assumed unitary income elasticity of public health and social welfare expenditures, India’s current fiscal policies are not sustainable in the Baseline and UHCP scenarios. However, if the generosity or income elasticity of public expenditure on social welfare and health expenditure is below unity (in particular, below 0.7), and other things being the same, fiscal sustainability for the UHCP is attainable in both the policy scenarios. These results offer evidence-based policy justification and strong support for introduction of India’s proposed UHCP on economic grounds of fiscal sustainability.
The analyses and results of this paper must be qualified by the limitation of data and assumptions of the NTA and GA models. For instance, health expenditure age profiles
13 the relevance and applicability of the NTA and GA methodologies for determining fiscal sustainability of India’s proposed UHCP.
The age profiles need to be revised as parts of complete and new construction of NTA Flow Account in future. Analyses based on such revised age profiles and changes in parameters (e.g. growth rate of productivity, discount rate, income elasticity of public health expenditure and inflation rate) may offer newer insights into the fiscal
sustainability of public health spending by comparison with the benchmark estimates in this paper. In the meanwhile, the approach, methodology and implications of this paper may have useful methodological and general policy relevance for determining fiscal sustainability of public health expenditure policies in other developing countries .
Acknowledgement
This paper is substantially revised version of the paper presented for the International Symposium on Demographic Change and Policy Response [13-14 November 2014, Beijing, China]. Grateful thanks are due to: (a) Professors Ronald Lee, Andrew Mason, Young Jun Chun and Robert Gal for research guidance and technical help; (b) Centre for Economics and Demography of Ageing (University of California, Berkeley) and East West Center (Hawaii) for full financial support for participation in the Conference; and (c) Institute for Social and Economic Change for research support. However, the usual disclaimers apply.
Reference
Auerbach, A.J., Kotlikoff, L.J. (1999). The Methodology of Generational Accounting, in: Auerbach, A.J., Kotlikoff, L.J., and Leibfritz, W. (Eds,). Generational Accounting Around the World, The University of Chicago Press (Chicago), pp.31-41.
Government of India. (2009). National Health Accounts India 2004-05. National Accounts Cell, Ministry of Health and Family Welfare (New Delhi).
Gupta, Indrani., and Chowdhury, Samik. (2015). Financing for Health Coverage in India: Issues and Concerns. IEG Working Paper No.346, Institute for Economic Growth (New Delhi).
Mason, Andrew., and Lee, Ronlad. (2011). Introducing Age into National Accounts, in:
Ronald Lee and Andrew Mason. (Eds.). Population Aging and the Generational Economy:
14 Mor, Nachiket., and Kalita, Anuska. (2014). Missing links in universal health care, The Hindu, November 12.
Mukherjee, Subrata. (2015). Health and Health Care in India: Current Scenario and New Challenges. In S. Mahendra Dev (Ed), India Development Report 2015, Oxford University Press (New Delhi): 205-220
Narayana, M.R. (2014). Impact of population ageing on sustainability of India’s fiscal policies: A Generational Accounting approach, The Journal of the Economics of Ageing, 3, 71-83.
Planning Commission. (2011). High Level Expert Group Report on Universal Health Coverage for India. Government of India (New Delhi).
Rao, M. Govinda., and Choudhury, Mita. (2012). Health Care Financing Reforms in India, Working Paper No: 2012-100 (March- 2012), National Institute of Public Finance and Policy (New Delhi).
Rao, M. Govinda., Choudhury, Mita., and Anand, Mukesh. (2010). Resource Devolution from the Centre to States: Enhancing the Revenue Capacity of States for Implementation of Essential Health Interventions, MPRA Paper No. 24387, posted 13. August 2010: Accessed at: http://mpra.ub.uni-muenchen.de/24387/ (accessed on 24 October 2014)
Sen, Aditi., Pickett, Jessica., and Burns, Lawton Robert. (2014). The Health Insurance Sector in India: History and Opportunities. In: Burns, Lawton Robert. (Ed). India’s Healthcare Industry: Innovation in Delivery, Financing, and Manufacturing. Cambridge University Press (Delhi): 361-399
Sen, Gita. (2012). Universal Health Coverage in India: A Long and Winding Road.
Economic and Political Weekly, XLVIII, 45-52.
United Nations. (2013a). National Transfer Accounts Manual: Measuring and Analysing the Generational Economy, ESA/P.WP/226, Population Division, and Department of Economic and Social Affairs, New York.
United Nations. (2013b). World Population Prospects: The 2012 Revision. New York: Population Division, Department of Economic and Social Affairs.
WHO. (2013). Research on Universal Health Coverage. World Health Report 2013, World Health Organization (Luxembourg)
Young, Jun Chun. (2014). Excel File for GA Calculation-Revised Health Expenditure
15
Table 1: Variable descriptions and measurements for calculation of age profiles of health consumption based on the NTA, India: 2004-05
Aggregate controls Measurement of aggregate controls
Age allocation methods and data sources
Public health consumption
Expenditure on health and other services under Government Final Consumption Expenditure
Age profile is drawn by using the individual level data on utilization of public health facilities in the 60th Round of National Sample Survey on Healthcare,
Morbidity and Conditions of aged in India in 2004. Public health facilities refers to health services provided by public hospitals and dispensaries (including Primary Health Centres, Sub-centres and Community Health Centres). Utilization is proxied by expenditure incurred on treatment for hospitalized or in-patient (during 365 days prior to the survey), non-hospitalised or out-patient (during 15 days prior to the survey) and other expenditure (e.g. transport expenses to and from the hospital visits).
Private health consumption
PFCE on medical care and health services net of indirect taxes. Indirect taxes on private health consumption are
assumed equal to share of PFCE on medical care and health services in PFCE.
Age profile is drawn by using the individual level data on private health expenditure in the India Human Development Survey 2004-05. Private health expenditure refers to sum of expenditure incurred for in-patient as well as out-patient treatment services for short term morbidity during last one month and major morbidity during 12 months. Treatment expenses included hospital surgery,
medicine and tests and others (e.g. tips, bus/train/taxi fares or lodging while getting treatment.
16 Table 2: Projected health expenditure for India, 2010-2100
Income elasticity of health expenditure
Projected per capita health expenditure (INR)
2010 2020 2030 2040 2050 2060 2070 2080 2090 2100
Public expenditure on health
0.1 213 237 262 288 315 344 374 405 439 474
0.2 222 267 319 380 450 531 625 734 860 1006
0.3 231 300 388 500 641 818 1042 1322 1675 2121
0.4 240 337 471 657 910 1256 1729 2371 3249 4447
0.5 250 379 572 861 1289 1922 2857 4235 6269 9270
0.6 259 425 693 1126 1820 2931 4704 7529 12033 19214
0.7 269 476 838 1470 2564 4455 7717 13327 22985 39603
0.8 280 533 1012 1915 3602 6751 12610 23488 43689 81186
0.9 290 597 1221 2489 5048 10198 20532 41220 82645 165536
1.0 302 667 1471 3230 7056 15357 33308 72039 155596 335739
Public expenditure on Universal Health Care
0.1 1101 1237 1381 1544 1723 1914 2114 2323 2543 2776 0.2 1146 1393 1683 2037 2461 2958 3536 4205 4984 5888
0.3 1191 1567 2048 2681 3504 4556 5891 7579 9715 12416
17 Table 3: Select scenarios of health expenditure and fiscal sustainability for India: Select results of Generational Accounting
Policy simulation
Main assumptions
Value of Generational Imbalance based on health
expenditure projections Baseline
scenario
UHCP scenario
1 Real interest rate = 8.13% ; Productivity growth rate =3.01% ; Income elasticity of health expenditure=1.0; income elasticity of social welfare expenditure=1
97.75 360.99
2 Same as (1) except productivity growth rate =3.50% 131.59 402.79
3 Same as (1) except productivity growth rate =4% 227.15 566.57
4 Same as (1) except real interest rate = 9% 83.67 391.69
5 Same as (1) except real interest rate = 10% 97.30 525.23
6 Same as (1) except income elasticity of health expenditure=0.80 87.56 163.88 6 Same as (1) except income elasticity of health expenditure=0.60 82.92 119.86 7 Same as (1) except income elasticity of health expenditure=0.40 80.54 102.66 8 Same as (1) except income elasticity of health expenditure=0.40 and social
welfare expenditure=0.90
30.45 42.50
9 Same as (1) except income elasticity of health expenditure=0.40 and social welfare expenditure=0.80
9.56 18.30
10 Same as (1) except income elasticity of health expenditure=0.40 and social welfare expenditure=0.70
-1.22 6.01
11 Same as (1) except income elasticity of health expenditure=0.40 and social welfare expenditure=0.60
-7.51 -1.10
18 Table 4: Generational Accounts and its composition based for fiscally sustainable the Universal Health Coverage Policy for India,
Generation’s age in 2004-05
Net payments (INR’000)
Composition of net payments (INR’000)
Transfers Payments
Education Health Cash Income tax Corporation tax Indirect taxes Non-tax revenues
0 (New born) 227.04 -24.49 -17.71 -46.32 31.29 60.51 223.56 0.20
5 226.21 -25.52 -19.03 -51.45 32.63 64.58 224.80 0.21
10 217.16 -22.67 -21.26 -55.85 32.91 66.74 216.98 0.30
15 205.66 -17.46 -24.49 -61.13 33.14 69.19 206.00 0.41
20 193.86 -9.69 -26.19 -67.23 33.02 72.11 191.23 0.61
25 189.79 -0.06 -25.09 -65.63 31.99 74.80 173.09 0.69
30 172.24 -0.05 -23.85 -66.15 29.63 76.14 155.77 0.74
35 154.34 -0.04 -22.26 -65.42 26.22 75.17 139.90 0.76
40 136.53 -0.03 -21.01 -62.83 22.25 72.20 125.07 0.88
45 115.37 -0.03 -22.18 -59.32 17.72 68.82 109.47 0.89
50 94.99 -0.02 -22.45 -54.74 12.96 65.52 92.82 0.90
55 74.45 -0.01 -21.81 -52.23 8.22 62.60 76.62 1.06
60 53.13 0.00 -20.06 -49.34 3.92 56.29 61.34 0.98
65 34.76 0.00 -17.97 -46.77 2.28 46.86 49.24 1.11
70 19.15 0.00 -15.83 -42.88 1.41 36.76 38.75 0.94
75 9.86 0.00 -13.63 -37.20 0.80 29.43 29.38 1.08
80 4.87 0.00 -11.37 -27.36 0.42 21.21 20.74 1.22
85 3.33 0.00 -8.45 -18.76 0.19 9.45 13.34 0.89
90 0.24 0.00 -2.20 -3.29 0.02 1.80 3.04 0.88
Future generation 224.54 Generational imbalance (%) -1.10 Sustainability gap (%) -7.34 Net payments as % of lifetime income 1.1. Current (newborn) generation 20.6 1.2. Future generation 13.7 Required adjustments by tax burden and transfer payments
Generations Tax adjustment (%) Tax and transfer adjustment (%) Current generation -943.8 -699.7
Future generation -42.6 -39.1
• 2010 -41.1 -37.5
• 2020 -41.5 -38.0
• 2030 -41.9 -38.4
Note: All figures refer to per capita.