Munich Personal RePEc Archive
Equity versus Equality
Konow, James and Saijo, Tatsuyoshi and Akai, Kenju
Kiel University, Loyola Marymount University, Kochi Institute of
Technology, University of Tokyo
1 December 2016
Online at
https://mpra.ub.uni-muenchen.de/75376/
December 2016
Equity versus Equality
ByJAMES KONOW,TATSUYOSHI SAIJO AND KENJU AKAI*
Abstract
How should economic output be distributed among those who created it? An expansive theoretical and empirical literature seeks to answer this fundamental, and controversial, question, which has implications, inter alia, for the structure of wages, redistributive policies and
international agreements. Among the possible fairness rules that have been proposed, the primary rivals are equality and equity, whereby the latter refers to allocating in proportion to some
measure of individual contributions. This paper reports the results of an experiment conducted in the United States and Japan. It investigates a large variety of factors that might affect preferences for equity and equality, including multiple approaches to examining concepts of culture. We find impersonal third parties, or spectators, exclusively favour equity. Distributive preferences move incrementally toward equality, however, when subjects share personal stakes (i.e., are
stakeholders), and even further toward equality, when stakeholder anonymity is lifted. Although
the degree of self-interest sometimes differs across countries, these findings about fairness preferences are robust with respect to a wide range of non-ethics variables that seldom matter, including race, income, gender, nationality and culture. We interpret the findings as suggesting that equity is an impersonal (or impartial) rule of fairness, whereas fairness preferences move
progressively toward equality with greater proximity, i.e., as relationships become more personal
through belonging to a group and being non-anonymous.
JEL classification: C91; D03; D63
*Corresponding author: Konow: Chair of Economics and Ethics, Kiel University, Germany, and Department of Economics, Loyola Marymount University, One LMU Drive, Suite 4200, Los Angeles, CA 90045-2659, USA ([email protected]);
Saijo: Institute of Economic Research, Hitotsubashi University, and Research Center for Social Design Engineering, Kochi University of Technology, Japan;
Akai: Project Assistant Professor, Department of Technology Management for Innovation, Graduate School of Engineering, University of Tokyo, Japan.
I certify that I have the right to deposit the contribution with MPRA.
We acknowledge the helpful comments and suggestions of Kjell Arne Brekke, Alexander Cappelen, Rachel Croson, Martin Dufwenberg, Robert Frank, Håkan Holm, Olof Johansson-Stenman, Stephan Kroll, David K. Levine, Karl Ove Moene, Karine Nyborg, John T. Scott, Matthias Sutter, Bertil Tungodden, and participants at various conferences and workshops. Konow thanks the Centre for Equality, Social Organization and Performance and the Centre for the Study of Mind and Nature, both at the University of Oslo, and the Institute of Economic and Social Research at Osaka University, where parts of the research were completed. Saijo
How should economic output be distributed among those who have contributed to its creation?
There is scarcely a question in economics more fundamental, or controversial, than this one. The
answer has wide-ranging implications for the structure of wages at the firm- and industry-level,
for returns to human and property resources, and for the redistribution of income and wealth,
both within countries through their domestic policies as well as between countries through
treaties and trade agreements. The textbook version of neoclassical economics, with its emphasis
on marginal productivity theory and efficiency, seems consistent with (a version of) equity. In
the social science literature on justice, the term “equity” commonly refers to rewarding
individuals in proportion to some measure of their contributions. On the other hand, people often
profess a desire for equality, a common interpretation of which is strict egalitarianism, i.e., equal
allocations irrespective of contributions. Along these lines, many economists as well as many
members of the general public have expressed growing concern in recent years about rising
economic inequality, as evidenced, for example, by the considerable academic and popular
interest in contributions to the topic by Piketty (2014) and Stiglitz (2012). Of course, opposition
to current levels of inequality does not by itself allow one to ascertain whether the favoured
target is equality or merely less inequality (perhaps still in keeping with equity). It does,
however, underscore the great importance of distributive preferences and the value of clarifying
the rules governing those preferences.
This study examines preferences for equity and equality and the factors that affect such
preferences using variations of a dictator experiment. In our version, subjects in the United States
(US) and Japan first perform a task that generates earnings, and then arbitrarily selected
“dictators” allocate the earnings to recipients, who have no recourse. The subject matter of this
study belongs to distributive justice, here understood to concern the distribution of income and
wealth. Within the empirical and theoretical justice literature, equity and equality are the most
prominent rivals for fairness principles, but no consensus has yet emerged about whether or
when each applies. To our knowledge, this paper reports the most comprehensive study of
factors that might affect equity and equality preferences: we consider, inter alia, entitlement,
culture, nationality, size of stakes, income, race, gender, and group vs. individual decisions. We
employ a laboratory experiment, specifically a non-strategic design, because it allows us to
control forces that might otherwise confound inferences from observational data, such as
distributive preferences and analyses possible cultural effects based both on a self-report
instrument and on behaviour in a novel treatment designed to induce cultural variation.
Recent theoretical and empirical research underscores the economic, political and social
importance of fairness preferences, in particular, as those preferences relate to what constitutes
fair and unfair inequality. For example, there is evidence that people accept inequalities due to
factors people control (e.g., effort) but reject inequalities resulting from factors people do not
control (e.g., luck), including from questionnaire studies like Faravelli (2007) as well as from
experiments like Konow (2000). An implication is that people are more supportive of
redistribution, the greater the role of luck in producing economic outcomes. Of course, the
relative importance of effort and luck is sometimes open to interpretation. Alesina and Angeletos
(2005), for example, demonstrate how different beliefs across countries about the source of
income differences can affect national tax policies, and Alesina et al. (2012) show how different
beliefs can impact the economic growth of countries. In related work, Ooghe and Peichl (2015)
analyse the design of optimal tax-benefit schemes, when earnings result from a combination of
controlled and uncontrolled factors but the exact role of each cannot be perfectly observed.
The relevance of fairness extends beyond national redistributive policies. For example,
Holm and Danielson (2005) find that the strength of distributive preferences as revealed in
dictator experiments is predictive of trustworthiness (i.e., the willingness to reciprocate other’s
generosity) across such dissimilar countries as Sweden and Tanzania. Several experimental
studies have demonstrated the importance for the optimal provision of public goods of precisely
the three forces we focus on here: equality, equity and self-interest. In the study of Balafoutas,
Kocher, Putterman and Sutter (2013), subjects trade off self-interest and fairness, whereby their
choices of allocation schemes for group earnings reflect a greater acceptance of equalizing, when
initial inequalities are arbitrary than when they are earned through task performance, echoing the
luck vs. effort distinction cited above. Reuben and Riedl (2013) find equity and equality to be the
two most salient rules for establishing cooperation, but high contributions to the public good are
only sustained, when punishment is possible. Subjects in Noussair and Tan (2011) may choose
whether to adopt a punishment regime, which as in Reuben and Riedl turns out to be conducive
to cooperation, but often fail to choose the optimal regime. The authors give as a possible reason
for this failure ambiguity about norms of equity or equality, which underscores the importance of
rules. Of course, the degree of inequality ultimately chosen by private or public policy-makers
also has implications for efficiency. For example, Burdín (2015) shows how the degree of wage
inequality chosen by firms has important implications for their ability to retain high-ability
workers.
The results of our experiment are striking in terms of what does and does not matter for
fairness preferences. In the literature, the relative preference for equity vs. equality is sometimes
associated with the cultural distinction between collectivism vs. individualism (e.g., Kashima et
al., 1988), nationality (e.g., Cappelen, Moene, Sørensen and Tungodden, 2013), and
demographic variables such as race or gender (e.g., Croson and Gneezy, 2009). Most
experimental evidence is based on the choices of stakeholders, or individuals with stakes in the
decisions they are making. We find in our study, however, that spectators, or impartial third
parties allocating rewards to others, display an exclusive preference for equity that is remarkably
consistent across cultural, national and demographic boundaries. Such spectator preferences are
potentially useful for various reasons. For example, Konow (2009) argues their relevance for
evaluating and informing normative theories and economic policies, and Schram and Charness
(2015) employ them as a source of advice aimed at influencing stakeholder behaviour. Here they
also serve as a basis for comparison with stakeholder preferences. Relative to spectators, we find
that stakeholders who share earnings anonymously shift significantly toward equalising earnings,
and stakeholders shift further toward equality, when their decisions are non-anonymous. Indeed,
non-anonymous stakeholders equalise completely, as the stakes approach zero. Ultimately, we
conclude these results are most consistent with an impersonal (or impartial) preference for equity
combined with a personal preference for equality that varies in strength monotonically with
proximity (i.e., how personal the relationship is between individuals) and stakes.1
A separate question concerns the strength of material self-interest relative to fairness
preferences, whatever rules govern fairness preferences. In this study, average allocations to
recipients do not, in many cases, differ significantly from those recipients’ contributions to
earnings based on their average task performance. This is consistent with List’s (2007) finding
that tasks, in comparison to windfall earnings, seemingly solidify property rights and reduce the
1 Bohnet and Frey (1999a, 1999b) also find reduced self-interest, when subjects communicate and are
role of self-interest. Nevertheless, under certain conditions, stakeholders do take significantly
more than they contribute, on average, and, in this respect, national or demographic differences
sometimes emerge. For instance, individual anonymous stakeholders, who are big spenders
outside the laboratory, take, on average, more than they contribute in both the US and Japan. In
addition, anonymous stakeholders take, on average, more than they contribute, both in individual
and in group dictator decisions, but only in the US, which mirrors the greater self-interest
exhibited by US subjects in some other comparisons, e.g., see Rey-Biel, Sheremeta and Uler
(2016). This study also contributes to research on groups (or teams) and finds that groups are
more selfish than individuals, contrary to Cason and Mui (1997) but consistent with Luhan,
Kocher and Sutter (2009), although we additionally find more selfish groups to be associated
with more selfish individuals in the US and more equitable ones in Japan. Other variables seldom
matter, including age, income, work hours, race, gender, culture and nationality.
The remainder of the article is organised as follows. Section 1 discusses factors that have
been related to fairness preferences in the literature. Section 2 presents the experimental design
and states hypotheses to be tested. Section 3 reports and analyses the results, and section 4
contains the discussion and conclusions.
1. Factors Related to Fairness Preferences
The design of the present experiment is informed by a rich but disperse literature related
to fairness preferences. The focus of this study, which has been scarcely examined thus far, is on
factors that potentially affect the equity-equality trade-off, that is, whether fairness preferences
correspond to equity, equality or some combination of the two. To be clear, equality refers in this
paper not to equal opportunities, equal rights or equal ratios, but rather to equal outcomes, i.e.,
strict egalitarianism. Equity, by contrast, refers here to rewards that are proportional to
contributions to joint earnings. The discussion of this literature is broken down into four parts,
which correspond to the top four (of the five) categories of variables that Camerer (2003)
identifies as being important in social preference experiments. We order variables according to
Camerer’s taxonomy, although, several might arguably be categorised differently in the context
of our experiment, as explained below.
1.1 Structural Variables
variables, “because they connect simple games to richer economic structures … and also provide
the most direct clues to the psychology underlying social preference” (pg. 75). The structural
variable that is central to the concept of equity is entitlement, or a sense of property rights, which
in the laboratory is typically conveyed through subject participation in a task. Some experiments
find proportionality of fair rewards to task performance, consistent with equity, e.g., Gächter and
Riedl (2006), whereas others suggest a mix of equity and equality preferences, e.g., Cappelen,
Hole, Sørensen and Tungodden (2007). These findings highlight a challenge to this research:
whereas equity seems to be chosen simply because of a preference for it, one can think of various
other explanations for why people might steer toward equality. For one, equality can occur as a
special case of a more general principle that otherwise generates inequality. For instance, the
accountability principle of justice (Konow, 2000) claims fair rewards are in proportion to the
contributions people control, but if contributions under individual control do not differ or differ
solely because of factors people cannot control, fair allocations reduce to equal shares. Another
common reason for equality is the ceteris paribus assumption: when information about relevant
differences is either unavailable or unreliable, people usually assume away any such differences
and favour equality by default (see Konow, 2003).
1.2 Culture and Nationality
Economics experiments of possible cultural differences in social preferences have come
to differing conclusions. The seminal paper of Roth et al. (1991) finds ultimatum game offers are
higher in the US and Slovenia than in Japan and Israel, whereas Okada and Riedl (1999)
discover no such differences between Austrian and Japanese subjects.2 Buchan and Croson
(2004) report differences in trust between US and Chinese subjects, whereas Brandts, Saijo and
Schram (2004) find no significant differences in cooperation between subjects in the US, Japan,
the Netherlands and Spain. Such studies raise questions not only about the type of social
preferences potentially at work but also their strength. Cason, Saijo and Yamato (2002), for
example, find that Japanese subjects are more inclined to punish low contributions in a public
good game than are US subjects.3
2 In the canonical ultimatum game, one subject proposes a division of a fixed sum with an anonymous
counterpart, and the counterpart may accept, in which case the sum is divided as proposed, or reject, in which case both receive nothing.
3
Although this topic is typically described as one of “culture,” there are at least two reasons to differentiate culture and nationality. First, multiple countries might share a common
culture (e.g., arguably North and South Korea), and multiple cultures might exist within a single
country (e.g., Switzerland and the US). Second, culture and nationality can be seen as different
possible social identities. Social identity refers to a sense of membership in a group, and that
group might be defined in terms of national identity (US or Japan) or cultural identity (e.g.,
individualism or collectivism).4 To our knowledge, this study is unique by allowing examination
of both cultural and national dimensions of the equity-equality trade-off. Although it is typically
clear what nationality means, culture requires some further discussion.
Since Hofstede (1980), most cross-cultural research makes a distinction between
individualism and collectivism, i.e., the degree to which people act as individuals or as members
of a group. With regard to distributive justice, a frequent claim is that people in
Western/individualistic countries prefer equity, whereas members of Eastern/collectivist
countries prefer equality. This claim finds support in the results of some questionnaire studies,
for example, see Kashima et al. (1988) and the meta-analysis of Sama and Papamarcos (2000).
As a mostly collectivist society, Japan has traditionally experienced one of the lowest levels of
income inequality in world, which Tachibanaki (2005) attributes to the strong “egalitarian
principle prevalent among the Japanese” (pg.110).5 At the opposite extreme, the individualistic
US has one of the highest levels of income inequality among developed countries, which Alesina
and Angeletos (2005) trace, in part, to fairness views that tolerate higher inequality. On the other
hand, the meta-analysis of Fischer and Smith (2003) suggests the need for a more complex
account of culture and its relationship to distributive preferences. One oft cited proposal for a
richer measure of culture is the two dimensional individualism-collectivism instrument
developed by Singelis et al. (1995). In section 2, we discuss this measure in greater detail and its
differences rather than institutional differences: their experiment was conducted at two universities in the US and two in Japan, and they found significant between-country differences but comparatively minor within-country differences.
4 For an economic treatment of identity, see Akerlof and Kranton (2000). In the following subsection on
demographic variables, we consider other traits that are often used to define social identity, e.g., race, gender, age and income.
5 Although inequality has increased substantially in Japan in recent decades, this does not necessarily
reflect a change in values. Rather, Ohtake and Saito (1998) point out that the income distribution by age
has remained relatively constant, and they attribute the increasing overall inequality to Japan’s rapidly
role in the present study.
Our design strategy for examining cultural effects also produces variation in additional
variables, so we discuss the literature related to them here, even though they are actually
structural variables. Dictator giving can depend on whether decisions are individual or group,
and Cason and Mui (1997) show the sequence of both types of decisions can affect these choices
in subtle ways. An inverse relationship between the level of subject anonymity and pro-social
behaviour has been found in studies of social distance among both Western and Asian subjects,
e.g., Hoffman, McCabe and Smith (1996) and Buchan and Croson (2004), respectively. In
addition, pro-social behaviour often increases with communication among subjects. For example,
Charness and Gneezy (2008) find dictators are more generous, when they know the family
names of their counterparts. Both Western and Asian subjects are both more trusting and more
trustworthy in Buchan, Johnson and Croson (2006), when communication is personal (about
something related to their birthdays), but their behaviour is unaffected by impersonal
communication. We see these findings as suggesting a unifying characteristic we will call
proximity, which signifies how personal the relationship is between parties. Thus, relationships
are more proximate, according to this concept, if people belong to a group, are non-anonymous,
and may communicate, a point to which we will return in the interpretation of our own results.
1.3 Demographic Variables
Many experimental studies have examined the relationship between distributive
preferences and demographic variables, so we also elicit information from subjects about gender,
race, age and various economic measures. In their survey of gender differences in preferences,
Croson and Gneezy (2009) report that the evidence on dictator giving is mixed, although women
are usually more inequality averse than men. There are conflicting results on the interaction of
dictator and recipient gender: women sometimes give more and sometimes less to other women.
The evidence on race and social preferences is similarly mixed. For example, blacks are more
generous in the ultimatum study of Eckel and Grossman (2001). On the other hand, the race of
donor and recipient does not significantly affect average dictator giving to victims of Hurricane
Katrina in Fong and Luttmer (2009), although giving is sensitive to donors’ reported closeness to
their own racial group. In a meta-analysis of dictator games, Engel (2011) finds a significant
positive correlation between giving and age.
charitable giving routinely find a positive relationship between income class and absolute giving
(e.g., see the evidence cited in Andreoni, 1990). On the other hand, Piff et al. (2010) report an
inverse correlation between economic class and anonymous generosity, measured both as
dictator giving and as charitable donations. Bracha and Vesterlund (2013) hypothesise that
giving can confer two types of status, economic and generosity, which makes the income-giving
relationship ambiguous. Their results provide a means to reconcile the seemingly contradictory
evidence and also underscore the importance of anonymity for the identification of intrinsically
motivated generosity. Using a representative sample of children, Almås, Cappelen, Salvanes,
Sørensen and Tungodden (2016) find spectators with low socio-economic class allocate more
equally, whereas higher status dictators allocate more equitably.
1.4 Methodological Variables
A common question about social preference experiments is whether the departures from
narrow self-interest they often reveal diminish, or even vanish, with larger stakes, such as those
sometimes encountered outside the laboratory. Camerer (2003) reviews the results of ultimatum
games with varying stakes, including ones up to several month’s wages, and concludes there is
comparatively little variation in offers and rejections. Using dictator and ultimatum games,
Forsythe et al. (1994) report significant differences between zero stakes and positive stakes but
find even very modest stakes produce the same behaviour as larger ones. In these studies, stakes
can rightly be considered a methodological variable, since the question is one of salience and
external validity (i.e., relevance to behaviour outside the laboratory). Although we keep with
Camerer by listing stakes in this sub-section, we actually treat it as a structural variable that
potentially affects fairness preferences themselves. We raise two distinct questions about stakes.
First, previous work shows that dictator allocations differ significantly depending on
whether the decision maker is a stakeholder or a spectator, e.g., see the literature cited in Konow
(2012). In the standard dictator game, the dictator is a stakeholder, whose anonymous decision
affects his own payoff. In the spectator version of the dictator game, a third party chooses the
allocation of a fixed sum between two other anonymous subjects, and the spectator is paid a
fixed fee that is invariant with respect to his decision. Whereas spectators are presumed to
choose impartially, stakeholders can, due to their material self-interest, be expected to allocate
more, on average, to themselves than would spectators. The less obvious question, which we
equity-equality trade-off. That is, do impartial (and impersonal) spectators act on a different
fairness rule from parties in a more personal relationship, like stakeholders? If so, this could have
important implications for distribution, e.g., judges are ideally impartial third parties typically
bound to the legal principle of proportionality, whereas co-workers can perhaps be seen attaching
a greater weight to equality.
Second, focusing now on personal stakes, the research cited above finds little effect of the
size of stakes on willingness to act on fairness preferences. But a separate question is whether the
size of stakes affects what people consider fair, i.e., the equity-equality trade-off. According to
Güth (1988), the early literature on justice in social psychology supports proportionality as the
basic rule of distributive justice, but it also finds that small stakes are often associated with
equality. We ask, therefore, whether higher personal stakes increase the relative importance of
equity and believe ours in the first economics experiment to address this question. This issue is
not confined to the laboratory, though, but mirrors issues of the appropriate distributive rule in
the field. For example, friends and colleagues often “split the tab” in restaurants, when the bill is
comparatively small, to avoid various costs, including goodwill, of a more exact reckoning.
2. Experiment and Hypotheses
2.1 Design and Hypotheses
There are two main phases to the experiment. In the production phase, twelve subjects in
room X and twelve in room Y perform a task that generates earnings. Specifically, they prepare
letters for mailing, and earnings are the product of the number of letters and a constant credit per
letter that is common to all subjects and treatments. Usually, subjects differ considerably in their
performance on this task and, therefore, in the earnings that can be attributed to them
individually. Subjects are then matched into pairs, whereby the matching protocol takes
advantage of variation in performance to maximise the productivity difference within each
session. In a standard session, the most productive X subject is matched with the least productive
Y subject, the second most productive X subject with the second least productive Y subject, etc.
In the subsequent allocation phase, the earnings of matched subjects are pooled, and their joint
earnings are allocated among them dictator style. The treatment differences all pertain to the
allocation phase, specifically, with respect to the exact pooling of subject earnings and the
The design is constructed so as to minimise non-preference-based reasons for equality.
Except where noted below, individual performance is common knowledge so as to avoid the
aforementioned ceteris paribus rationale for equalising earnings. The matching protocol produces
very few instances of actual equal productivity between members of a pair. In addition, the letter
preparation task employed here has proven very effective in conveying entitlement in past
research, e.g., Carpenter et al. (2010) and Falk and Ichino (2006). Its efficacy in the current
experiment is reaffirmed by the observed allocation decisions and responses to a
post-experimental questionnaire, which are reported later in the results section.
The experiment comprises three treatments. We now describe the first two treatments, in
which all subjects are aware of other subjects and their roles but are anonymous, i.e., they do not
know the identities of other subjects. In the Spectator treatment, there are twelve spectators, or
third party subjects, located in a third room, called Z. Each Z subject is matched with a single
X/Y pair. Spectators are informed of the number of letters individually prepared by X and Y and
are paid a fixed fee, unrelated to their allocation decisions, for distributing the joint earnings
generated by their X and Y counterparts between them. The Anonymous Stakeholder treatment
is closer to the standard version of the dictator game. Subjects in rooms X and Y (again twelve
each) first generate earnings and are then matched into pairs as in the Spectator treatment, but
there is no third party Z. Instead, X subjects are arbitrarily chosen to allocate the earnings
generated by their pair between themselves and their Y counterparts. Each X subject does this
only for his or her pair. Thus, the only difference between the Anonymous Stakeholder and
Spectator decisions is whether or not the dictator is also a party to the earnings being distributed.
The labels and main features of these two treatments are summarised in the top two rubrics of
Figure 1.
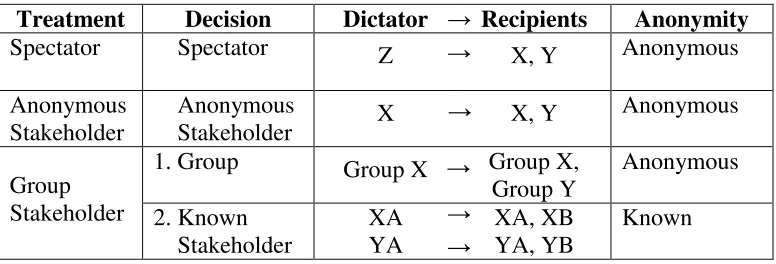
FIGURE 1.Experimental Design
Treatment Decision Dictator Recipients Anonymity
Spectator Spectator Z X, Y Anonymous
Anonymous Stakeholder
Anonymous
Stakeholder X X, Y
Anonymous
Group Stakeholder
1. Group Group X Group X,
Group Y
Anonymous
2. Known Stakeholder
XA YA
XA, XB YA, YB
Known →
→
→
[image:12.612.108.496.578.710.2]The Spectator treatment seeks to identify impartial distributive preferences, which are
potentially useful for the various purposes listed in the introduction, viz., to evaluate or inform
normative theory, policy, and stakeholders. The intent here is to utilise spectators to provide the
clearest possible signal of impartial fairness rules, in light of the fact that stakeholders have been
found to form biased beliefs about fairness, even their entitlements are equal (see Di Tella et al.,
2015). Spectators in this experiment, by contrast, have no material or informational basis for
distorting beliefs. It is also important to study the choices of stakeholders, however, since most
situations in which distributive preferences are implicated involve parties with stakes in the
outcome, e.g., workers, management, stockholders, resource owners, polluters, etc. Having both
spectator and stakeholder decisions enables us to make several important comparisons. First, the
strength of self-interest relative to fairness can be associated with different levels of giving
between stakeholders and spectators. Second, the fairness rule of equity predicts that giving will
vary in proportion to the entitlement, whereas equality rule predicts no such changes. So, any
differences between spectator and stakeholder giving in response to changes in the entitlement
will shed light on how each weights these two rules. Third, having both spectator and
stakeholder decisions facilitates separate testing of possible national and cultural differences in
the strength of fairness preferences and in fairness rules, a topic to which we now turn.
FIGURE 2.Nationality Hypothesis
Spectator Anonymous
Stakeholder
Japan = ½ ≥ ½
United States = ∝ ≥ ∝
Notes: These are amounts allocated to subject X. The second symbol in each cell
represents the fairness rule, either equal splits (½) or proportionality (∝). The first symbol is the standard mathematical operator, indicating allocations to X are either equal to (=) or greater than or equal to (≥) amounts that correspond to the respective rule.
Regarding nationality, there are four reasons we chose the US and Japan for this study.
First, a large volume of experimental economic research has been conducted in the US and
Japan, both separately and in joint cross-cultural investigations. This fact facilitates connections
between this study and others and, thereby, could help bolster claims of generality. Second, they
are two of the three largest economies in the world and represent, therefore, a substantial fraction
of world economic activity. Third, the US and Japan are often said to represent two sides of the
Fourth, our chief interest is in preferences for equality versus inequality, and much cross-national
research (e.g., see section 1.2) places these two countries at opposite poles on this issue. Building
on this final point, the Nationality Hypothesis states that Japanese subjects value equality and
that US subjects value equity, as summarised Figure 2. Specifically, Japanese spectators seek to
set amounts equal to equal splits, denoted = ½, whereas US spectators set allocations
proportionately, denoted = ∝. Anonymous stakeholders are motivated not only by fairness but
also by material self-interest. Assuming the full range of possible weights on these two motives,
they are predicted to allocate to themselves an amount greater than or equal to their respective
fairness rule, either equality in Japan (≥ ½) or proportionality in the US (≥ ∝).
Although we call this the Nationality Hypothesis, if true, it could be an instance of the
more general cultural claim outlined in section 1.2 that justice in collectivist societies
corresponds to equality and in individualistic societies to equity. To examine this, the
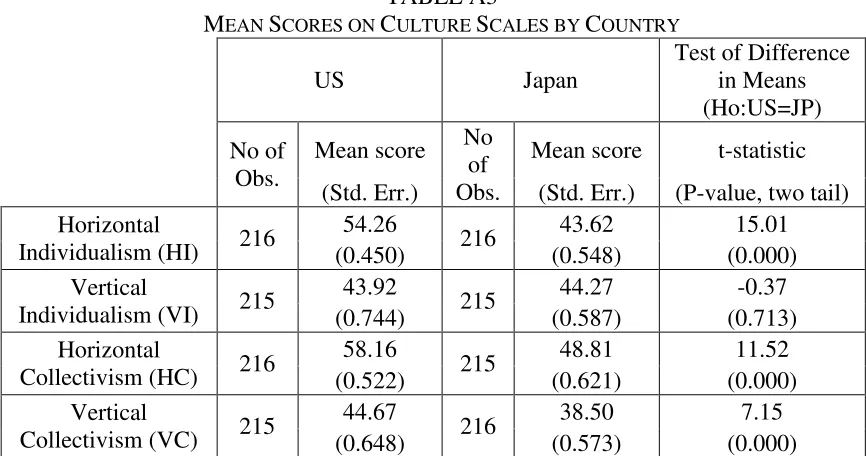
post-experimental questionnaire includes an individualism-collectivism (IC) measure.6 Specifically,
we employ the IC measure of Singelis, Triandis, Bhawuk and Gelfand (1995), hereafter STBG,
which comprises 32 items that respondents rate on a nine point scale. Although this construct is
one of the most cited IC instruments, most cultural psychologists acknowledge that it has been
notoriously difficult to develop satisfactory IC measures based on self-reports. These measures
have proven especially vulnerable in terms of reliability, i.e., their ability to produce stable and
consistent results over time and with different samples. An alternate approach is to activate
cultural identity in the laboratory. To this end, we separately design an experimental treatment
based on the theoretical framework of STBG but using behavioural rather than self-reported IC
measures. An important reason for choosing the STBG framework, apart from its richer
conceptualization and widespread usage, is that it is nicely adaptable to an economics experiment
and, in particular, to our focus on equity and equality.
The theory behind the STBG construct involves two dimensions. Along one dimension, it
distinguishes collectivism (C) as a cultural pattern in which people favour in-groups over
out-groups from individualism (I), which makes no such distinctions, i.e., people are autonomous.
An in-group (out-group) is a set of people with whom one shares (does not share) an identity,
such as friends, family, team, nationality, culture, gender, race, etc. The second dimension
6 In addition, if the hypothesized behavioural relationship obtains, the IC measure could help avert a
distinguishes horizontal (H) relationships, which are based on equality, from vertical (V) ones,
which are based on inequality. This produces four cultural variations: HC, VC, HI and VI.7
Among theories of culture, this one lends itself well to the current topic. Nevertheless, like other
such theories, it is not formulated in terms of distributive justice, so we now add some flesh to it.
FIGURE 3.HVIC Hypothesis
Group Individual/
Known Stakeholder
HC
Japan > ½ = ½
VC > ½ = ∝
HI = ½ = ½
VI US = ½ = ∝
Notes: These are amounts allocated to one’s in-group (Group column) and to oneself (Individual/Known Stakeholder column), according to the four STBG-inspired cultural variations. Amounts are either greater than (>) or equal to (=) the equal split rule (½) or the proportionality rule (∝). In the Group Stakeholder treatment, Group corresponds to the Group decision and Individual to the Known Stakeholder decision.
Specifically, we take the IC dimension to refer to group preferences and collectivism to
imply that in-groups consider it acceptable to have larger shares than out-groups. Individualism,
on the other hand, implies no such distinctions so that in- and out-groups are treated equally.
Further, we take the HV dimension to refer to allocations between individuals within in-groups
with horizontal implying equal splits between individuals and vertical implying equitable (i.e.,
proportional) allocations between individuals. We call this interpretation of the STBG
framework the “HVIC Hypothesis” and illustrate it in Figure 3. In Group allocations,
collectivists prefer a larger share for their own group, denoted for HC and VC as > ½, whereas
individualists make no group distinctions and prefer equal allocations across groups, denoted for
HI and VI as = ½. For Individual allocations within groups, horizontal collectivists and
individualists both prefer equality within their group, denoted for HC and HI as = ½, whereas
vertical collectivists and individualists prefer equity within their group, denoted for VC and VI
as = ∝(disregard the “Known Stakeholder” label for now). If we wish explicitly to factor in a
self-interested bias, it is straightforward to adjust this table: we replace “=” with “≥” and
7 For the self-report instrument, subjects respond to statements on a scale from 1 to 9, and each culture
additionally require for Groups that HC and VC be strictly greater than HI and VI.8 According to
STBG, the United States is VI, whereas Japan has a mixed pattern: more VC than anything else
and overall more C than I, so we assign it to both HC and VC. As an alternative to self-reports,
therefore, we formulate a test based on this assignment of countries to cultural patterns. Thus, for
Individual, Japan is between equity and equality, and the HI cell is left empty in this study.
The HVIC Hypothesis posits cultural differences in distributive preferences based on
distinctions between and within groups. We seek to activate those preferences in the laboratory
by creating in-groups. For that purpose, we draw on a separate literature on induced group
identity. Psychologists have conducted a large number of experiments employing a method
called the “minimal group paradigm” (e.g., Tajfel and Turner, 1979), which has also been used in
economics experiments (e.g., Chen and Li, 2009). Most of these studies reveal that subjects
exhibit favouritism toward in-groups that are constructed on such trivial bases as art preferences,
final digits of social security numbers, or even random assignment to colour-coded groups.
Goette, Huffman and Meier (2012), however, find quantitative differences in social preferences
between such “minimal groups,” who do not interact, and groups randomly assigned to real
social interactions. Their subjects comprised Swiss officers in training, who had interacted all
day over several weeks, and Goette et al. were able to maintain anonymity during their
experiment. By contrast, our study requires a more diverse subject pool and permits only brief
interaction. Therefore, we form groups without anonymity in order, inter alia, to strengthen
group identity. There are several other benefits of this design choice, including greater external
validity (social interaction is not usually anonymous) and the ability to examine possible effects
of knowing the gender or race of counterparts. A potential source of noise, however, is if
subjects know one another outside the laboratory – we sought to minimise this by assigning any
subjects who showed up together or appeared to be acquainted to different rooms, where they
would not be non-anonymously matched.
We tested the HVIC Hypothesis with the Group Stakeholder treatment, which is
illustrated in the bottom of Figure 1 above. This treatment begins with the same production phase
as the other treatments, but the allocation phase involves two stages and a different matching
protocol (described momentarily). Instead of pairs, subjects are initially matched into quadruples
8
One might interpret the STBG theory differently from these two variations, of course, but the
consisting of two X subjects, called XA and XB who form Group X, and two Y subjects, called
YA and YB who form Group Y, and the earnings of all four subjects are pooled. The first
allocation is the Group decision. XA and XB subjects are re-seated to meet face-to-face, are
informed of the total production and earnings of their quadruple, and jointly choose how much to
take for their in-group (Group X) and how much to give to the out-group (Group Y). YA and YB
also meet face-to-face and are informed of what they receive from Group X. After five minutes,
A and B subjects in both rooms return to their original seats. Although A and B subjects in both
rooms meet with one other, X and Y groups never meet and remain anonymous to one another.
The second decision in this treatment is an individual one. Subject XA is arbitrarily
chosen to allocate the Group X earnings they just selected for themselves between himself and
his XB counterpart. Similarly, the YA subject is arbitrarily chosen to distribute the earnings
Group X gave to them in the earlier decision between herself and her YB counterpart. These
decisions are all made individually, but they are not anonymous: A and B subjects have met and
know one another’s identity. This Known Stakeholder decision is similar to the Anonymous
Stakeholder decision in that the dictators are individual stakeholders with knowledge of
individual production but differs in that they are known by and to the recipients. In terms of
Figure 3, therefore, the Group decision corresponds to the predictions in the Group column and
the Known Stakeholder decision to those in the Individual column.
The matching mechanism in the Group Stakeholder treatment is a bit more involved than
in the other treatments. In each room, A and B subjects are separately matched so as to maximise
productivity differences, i.e., the most productive A with the least productive B, etc., analogous
to the subject X and Y pairings in the other treatments. Then these X groups (each consisting of
an XA and XB) and Y groups (consisting of YA and YB) are matched to form quadruples,
specifically, the most productive X group is matched with the most productive Y group, the
second most productive X group with the second to most productive Y group, etc. This results in
large average differences in productivity between A and B subjects but small productivity
differences between X groups and Y groups.
For the Group decision, Group X is told only the total, but not individual or group,
production and earnings of their quadruple. There are several reasons for this. The HVIC
Hypothesis is not predicated on, or committed to, a rule of equity or equality. Instead, it simply
Without relevant information, previous research cited in section 1 indicates subjects typically
make the ceteris paribus and assume equality applies. In fact, the matching protocol described
above generates small productivity differences between X and Y Groups. At the same time,
providing information only about total productivity likely helps create larger differences between
Group X and Y pies, which is needed to study the effect of the size of stakes on the choice of
fairness rule.9 In addition, the Group Stakeholder treatment allows comparison of the degree of
self-interest by groups (or teams) versus individuals (e.g., as Cason and Mui, 1997) and makes
possible analysis of nationality and of effects of groups on the choice of equity or equality.
2.2 Procedures
A total of 432 subjects participated in this experiment: 144 in the Spectator treatment, 96
in the Anonymous Stakeholder treatment and 192 in the Group Stakeholder treatment. Each of
these totals consisted of equal numbers drawn from the undergraduate campuses of universities
in Los Angeles, California and Osaka, Japan. These are comparably sized metropolitan areas,
both the second largest in their respective countries. Subjects were invited by campus wide
emails and flyers posted around campus to sign up at designated websites. Participants were
recruited from different disciplines and screened to exclude non-citizens. All sessions had twelve
subjects per room, and the Spectator treatment was conducted with three rooms (X, Y and Z), or
36 subjects total, per session, whereas the Anonymous Stakeholder and Group Stakeholder
treatments each involved two rooms (X and Y), or 24 subjects total, per session. All subjects
initially showed up at a single location to register and receive their show up fees in order to
dispel doubts about the existence of counterparts in other rooms (see Frohlich, Oppenheimer and
Moore, 2001, for evidence on the effects of such doubts). They were then randomly assigned to
separate rooms except for adjustments to balance gender and to break up acquaintances.
Subjects are told that there are two phases of the experiment and then given more specific
instructions for the first, or production, phase.10 Each letter correctly prepared in the six minutes
9Specifically, there is little actual variation in the total stakes of dictator/recipient pairs in the other
decisions of this experiment, but the self-interest of X groups in the Group decision represents a natural way to create variation in Group X and Y pies. This, in turn, allows us to study the effect of the size of stakes on the fairness rule, in this case, those acted on by A subjects in the subsequent Known
Stakeholder decision. Moreover, providing information about group productivity might overly limit variance in these stakes given the previously cited research that known entitlements significantly reduce self-interest.
10
allotted generates 100 points, which is also stated in local currency (i.e., US dollar or Japanese
yen). After the task is complete and the letters counted, the pooling of earnings for their
particular treatment is explained, the dictators are identified for the first time (although they are
merely identified as subjects X or Z), and dictators are given five minutes to allocate points
between subjects. For the Group Stakeholder treatment, X groups are first given five minutes to
allocate the total earnings of the quadruple between themselves and the Y group.11 Then, the
Known Stakeholder allocations take place: the A subjects in each room are given five minutes to
allocate the group X (or Y) totals between themselves and B subjects. All subjects then complete
a questionnaire, which includes demographic questions, questions about distributive preferences
and the STBG instrument. Finally, subjects are paid privately and permitted to leave. Altogether,
sessions lasted, on average, about 50 minutes.
Show-up fees were $5 in the US and 750 yen in Japan, and each letter in the US earned
$1 (1 point = 1 cent) and in Japan earned 150 yen (1 point = 1.5 yen). These parameters resulted
in average total earnings of $18.14 in the US and 2121 yen in Japan, approximately equal
amounts in purchasing power parity using contemporaneous OECD conversion rates.12 The
instructions were written in English, translated into Japanese and then back-translated by a
separate translator into English to check for consistency. The first author was present at both
locations to verify that the recruitment, procedures, and even physical set-up were equivalent.
For language reasons and in order not arouse suspicion, the experiment was conducted solely by
Americans in the US and Japanese in Japan, and the lead experimenter in the dictator rooms
(except for the YA decisions) was always the same person (Konow in the US and Akai in Japan).
The experimental protocol is contained in the Appendix.
3. Results and Analysis
The presentation and analysis of results follows the outline of section 1.
allocation procedures in order to avoid any effect on effort and productivity in the first phase that might subsequently impact allocations and confound inferences about distributive motives. The experiment was partially, but not completely, computerized for logistical reasons, viz., one of the labs did not have separate computerized rooms, but the use of pencil and paper for allocation decisions probably also helped reinforce that dictator decisions were anonymous to recipients. For practical reasons, though, decisions were not blind to the experimenter.
11 The X groups are told that, if at the end of the five minutes they fail to agree, one of the X subjects will
be randomly chosen to decide, although it never came to that.
12 These earnings seemed sufficient: after receiving their payments, 99% of American subjects and 94%
3.1 Structural Variables
We consider first summary statistics for all four decisions in the experiment. Table 1
summarises the mean allocations to X (or A, in the case of Known Stakeholders) as fractions of
total earnings of pairs for the four decisions. The entitlement is the mean fraction of earnings
produced by X or A, respectively. Below these are two-tail t-tests of differences between mean
allocations and mean entitlements and between mean allocations and equal splits, respectively.
We see Spectator allocations do not, on average, differ significantly from either equity (i.e., the
mean entitlement, using paired t-tests) or equality, whereas Anonymous Stakeholder allocations
to themselves significantly exceed both their mean entitlement and equality. We reserve detailed
discussion of the Group Stakeholder treatment for the following section but note at this point that
Known Stakeholders and Group Stakeholders take more than their respective entitlements and
equality, although these differences vary in size and significance. These results are consistent
with all groups being motivated by fairness and with the additional effect of material self-interest
on stakeholders, but it does not tell us whether the governing fairness rule is equity and equality.
Table1
SUMMARY OF MEAN RESULTS
Anonymous Known Group
Spectator Stakeholder Stakeholder Stakeholder Allocations
Mean 0.45 0.57 0.54 0.59
(Std. Err.) (0.036) (0.029) (0.015) (0.023)
Entitlements
Mean 0.45 0.49 0.52 0.46
(Std. Err.) (0.033) (0.028) (0.019) (0.006)
Difference mean allocation and mean entitlement
t-statistic −0.02 2.95 1.29 5.72
p-value 0.985 0.005 0.200 <0.001
Difference mean allocation and equality
t-statistic −1.42 2.31 3.06 4.04
p-value 0.161 0.025 0.002 <0.001
No. of obs. 48 48 91 48
Table 2 presents a simple but more disaggregated summary of the results. It categorises
each decision into one of three types, viz., proportional, equal or selfish, based on a calculation
of whether it is closest in absolute terms from its respective entitlement, equality or giving X (or
A in the Known Stakeholder decision) the entire pie (ties are counted one-half to each type). The
first column illustrates that 81% of Spectator decisions are closest to being proportional and 19%
to being equal (the selfish category is not applicable here, since the dictators in this treatment are
third parties). The percentage of proportional decisions falls to 57% and the percentage of equal
ones rises to 30% for Anonymous Stakeholders, while 13% of decisions are closest to the
completely selfish allocation. Further gains in equality and losses in equity are apparent for
Known Stakeholders, while selfish allocations fall somewhat. Finally, we see that, although
Group Stakeholders deviate, on average, significantly toward self-interest, as reported above,
only 11% are closest to taking the entire earnings whereas 83% of their allocations are closer to
equality. Only 6% are closest to being proportional, presumably by chance, since these dictators
receive no information about relative production. Moreover, regression analysis shows that
group entitlements do not significantly affect group allocations. As the remaining analysis in this
sub-section concerns the entitlement, we therefore focus below on the three individual decisions.
Table 2
TYPE OF ALLOCATION BY DECISION
(percentage of each type) Dictator Decision Allocation
Type Spectator
Anonymous Stakeholder
Known Stakeholder
Group Stakeholder
Proportional 81 57 45 6
Equal 19 30 49 83
Selfish NA 13 6 11
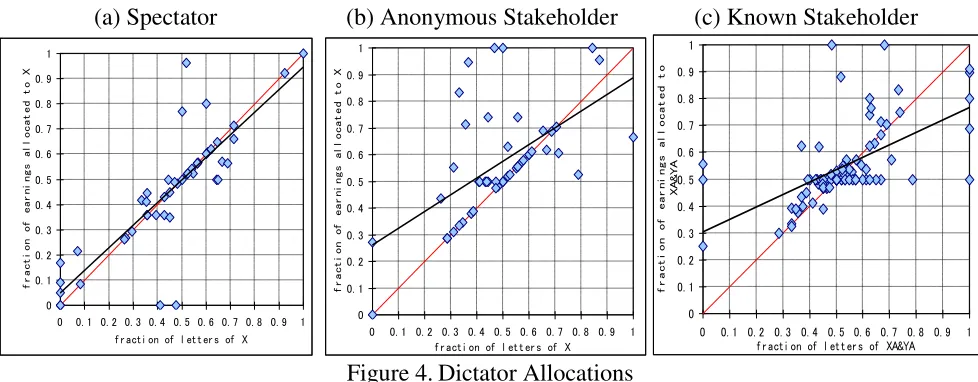
The dictator allocations of Z subjects in the Spectator treatment are illustrated in Figure
4a. The horizontal axis represents the fraction of letters produced by the X subject and the
vertical axis the fraction of earnings allocated to the same X subject by the Spectator. If
spectators value equality, the allocations should lie along a horizontal line at 0.5. Equity, on the
other hand, calls for proportionality: fair allocations, or the entitlement, lie along the lighter 45
degree line where fractional allocations equal fractional contributions (ignore the dark lines for
now). Apart from a few outliers, most decisions appear to be quite close to the entitlement.
again to the X subjects, but the fractional earnings on the vertical axis are those chosen by the X
subjects to themselves (rather than those chosen by a third party). As with Spectators, a number
of these allocations equal the entitlement, but departures from this line are more prominent. The
Known Stakeholder treatment in Figure 4c illustrates the dictator allocations of A subjects in
rooms X and Y to themselves, which appears to include a greater incidence of equality.
(a) Spectator (b) Anonymous Stakeholder (c) Known Stakeholder
0 0. 1 0. 2 0. 3 0. 4 0. 5 0. 6 0. 7 0. 8 0. 9 1
0 0. 1 0. 2 0. 3 0. 4 0. 5 0. 6 0. 7 0. 8 0. 9 1 f r act i on of l et t er s of X
f r a c t i o n o f e a r n i n g s a l l o c a t e d t o X 0 0. 1 0. 2 0. 3 0. 4 0. 5 0. 6 0. 7 0. 8 0. 9 1
0 0. 1 0. 2 0. 3 0. 4 0. 5 0. 6 0. 7 0. 8 0. 9 1 f r act i on of l et t er s of X
f r a c t i o n o f e a r n i n g s a l l o c a t e d t o X 0 0. 1 0. 2 0. 3 0. 4 0. 5 0. 6 0. 7 0. 8 0. 9 1
0 0. 1 0. 2 0. 3 0. 4 0. 5 0. 6 0. 7 0. 8 0. 9 1 f r act i on of l et t er s of XA&YA
[image:22.612.61.550.182.373.2]f r a c t i o n o f e a r n i n g s a l l o c a t e d t o X A & Y A
Figure 4.Dictator Allocations
These impressions are reinforced and further illuminated by regression analysis. The dark
lines in Figure 4 result from the following OLS regression of fractional allocations on fractional
entitlements for the three individual decisions:
(1) Allocationi = a + b·Entitlementi+ εi
Equality corresponds to an intercept of one-half (a=0.5) and a slope of zero (b=0),
whereas equity predicts an intercept of zero (a=0) and a slope of one (b=1). Since the dependent
variable is left- and right-censored, however, we also run two-sided Tobit regressions for these
and the other regressions reported in this paper.13 Table 3 reports these regressions and the
results of F-tests of the joint hypotheses for the equity and equality cases. For the Spectator
decisions, there is strong support for equity and no support for equality, confirming the
impressions from Table 2 and Figure 4. Allocations in the two stakeholder decisions, however,
fall between equity and equality and differ significantly from those two sets of predictions, as
13 For the findings reported in this paper, OLS and Tobit regressions result in conclusions that are
seen in Table 3. Comparing slope coefficients to those of Spectators, dictators equalise more as
Anonymous Stakeholders (t-statistic=–2.12, p<0.05) and even more as Known Stakeholders
(t-statistic=–3.97, p<0.01). Joint tests of the hypothesis of no change in intercepts and slopes
similarly indicate significant differences between Spectator allocations and those of Anonymous
Stakeholders (F-statistic=5.34, p<.01) and Known Stakeholders (F-statistic=10.55, p<.01). The
highly significant slope coefficients in all three regressions demonstrate that the entitlement, and
therefore equity, matters in every condition, although to differing degrees. On average, spectators
allocate according to equity, whereas Anonymous and Known Stakeholders respond to but are
less sensitive than spectators to differences in entitlement.
Table3
TOBIT REGRESSION ANALYSIS
Anonymous Known
Spectator Stakeholder Stakeholder
Intercept 0.01 0.24*** 0.30***
(0.049) (0.072) (0.037)
Entitlement 0.96*** 0.67*** 0.47***
(0.097) (0.138) (0.067)
F-statistics
Equity (a=0, b=1) 0.11 7.61*** 33.16***
Equality (a=0.5, b=0) 52.39*** 15.67*** 31.40***
Adjusted R2 0.70 0.33 0.34
No. of obs. 48 48 91
Notes: Standard errors are in parentheses. Adjusted R2 are from OLS.
Significant at *10%, **5%, ***1% level.
We also examine whether dictator allocations are related to other distributive preferences
than those activated by the entitlement. The post-experimental questionnaire includes five
questions that elicit agreement on a four point Likert scale with statements about subject control
over performance on the experimental task, basic needs, guaranteed income, and whether
efficiency is promoted by minimizing differences in pay (equality) or by paying workers
according to productivity (equity). Tobit regressions reported in Table A1 of the Appendix add
the five responses to the right side of regression (1). They show that the entitlement remains
highly significant and nearly identical in magnitude across the three treatments while none of the
strongly agreed that performance on the task was due to things they could control, thereby
satisfying a more stringent criterion for entitlement, but the regression results suggest that even
dissenters on this question accepted the experimental task as a fair basis for allocation.
3.2 Culture and Nationality
The Nationality Hypothesis predicts Japanese will allocate equally and Americans
equitably with a possible self-interested bias in the case of Anonymous Stakeholders. Table 4
summarises the results of Table 1 broken down by country (minus the Known and Group
Stakeholder decisions, which we present later). Consistent with the Nationality Hypothesis, there
are no significant differences between mean Spectator allocations and entitlements in the US or
between mean Spectator allocations and equal splits in the Japan. The results for Anonymous
Stakeholders are also consistent the predictions, which involve weak inequalities: the mean US
allocation significantly exceeds the entitlement, and the mean Japanese allocation exceeds
equality, although not significantly so. These results are mostly inconclusive about the core
claims of the hypothesis, though, so we turn now to regression analysis to test its stronger claims
regarding equity and equality.
TABLE4
MEAN RESULTS FOR SPECTATOR AND ANONYMOUS STAKEHOLDER ALLOCATIONS BY COUNTRY
Anonymous
Spectator Stakeholder
US Japan US Japan
Allocations
Mean 0.40 0.50 0.57 0.57
(Std. Err.) (0.058) (0.039) (0.040) (0.044)
Entitlements
Mean 0.38 0.52 0.47 0.52
(Std. Err.) (0.053) (0.037) (0.047) (0.023)
Difference mean allocation and mean entitlement
t-statistic 0.50 –0.718 3.00 1.29
p-value 0.622 0.479 0.006 0.208
Difference mean allocation and equality
t-statistic –1.77 0.04 1.70 1.55
p-value 0.090 0.967 0.103 0.134
No. of obs. 24 24 24 24
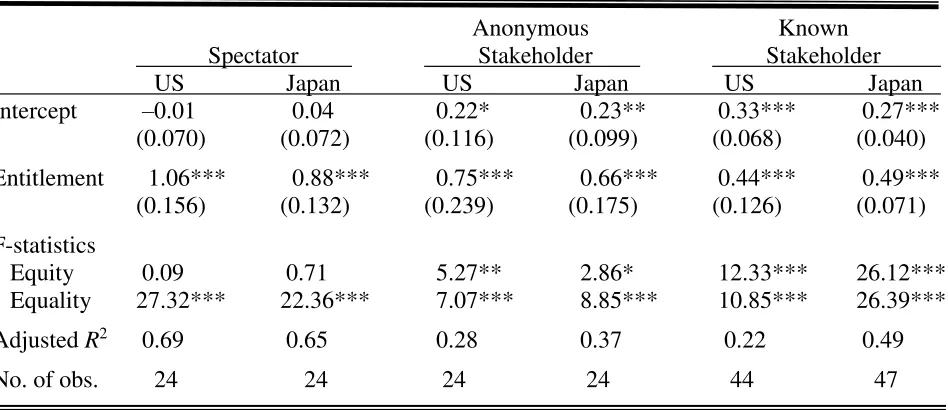
Table 5 summarises Tobit regressions that parallel Table 3 but are additionally broken
down by country. The results are very close to those in Table 3: dictators in the US and Japan
allocate similarly within treatments, and the allocations of both subject pools respond similarly to
treatment differences. Spectators in both the US and Japan allocate equitably and not equally,
according to F-tests. Anonymous Stakeholders in both countries equalise more, on average,
departing from equity (in Japan, the F-test for Tobit is weakly significant with p=0.078 whereas
OLS gives a p=0.026). We return to the Known Stakeholders later but note for now that we
observe, compared to Anonymous Stakeholders, the same pattern from Table 3 of even greater
equality and reduced equity in allocations in both countries. Thus, the evidence on the
Nationality Hypothesis is mixed and mostly negative. Consistent with the hypothesis, US
Spectators allocate equitably, and Stakeholders in both countries allocate to themselves no less
than the fair amount. But, contrary to the hypothesis, Japanese Spectators also allocate equitably
rather than equally. And Anonymous Stakeholders in both countries follow, on average,
something between equity and equality, rather than equity in the US and equality in Japan.
TABLE5
TOBIT REGRESSION RESULTS BY COUNTRY
Anonymous Known
Spectator Stakeholder Stakeholder
US Japan US Japan US Japan
Intercept –0.01 0.04 0.22* 0.23** 0.33*** 0.27***
(0.070) (0.072) (0.116) (0.099) (0.068) (0.040)
Entitlement 1.06*** 0.88*** 0.75*** 0.66*** 0.44*** 0.49***
(0.156) (0.132) (0.239) (0.175) (0.126) (0.071)
F-statistics
Equity 0.09 0.71 5.27** 2.86* 12.33*** 26.12***
Equality 27.32*** 22.36*** 7.07*** 8.85*** 10.85*** 26.39***
Adjusted R2 0.69 0.65 0.28 0.37 0.22 0.49
No. of obs. 24 24 24 24 44 47
Notes: Standard errors are in parentheses. Adjusted R2 are from OLS.
Significant at *10%, **5%, ***1% level.
In section 1 we noted the possibility of cultural variation that is orthogonal to nationality,
so we included the STBG self-report instrument in the post-experimental questionnaire to try and
[image:25.612.76.550.410.615.2]entitlement and the four STBG scales controlling for demographic variables are reported on
Table A2 of the Appendix. They reveal no significant effects of any of the scales on the
allocations of Spectators or Anonymous Stakeholders.14 As previously mentioned, however, such
measures are notoriously unreliable, which is one reason our primary focus is on the treatment
we designed that uses behavioural measures, to which we now turn.15
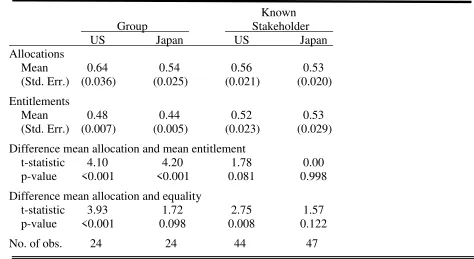
TABLE6
MEAN RESULTS FOR GROUP AND KNOWN STAKEHOLDER ALLOCATIONS BY COUNTRY
Known
Group Stakeholder
US Japan US Japan
Allocations
Mean 0.64 0.54 0.56 0.53
(Std. Err.) (0.036) (0.025) (0.021) (0.020)
Entitlements
Mean 0.48 0.44 0.52 0.53
(Std. Err.) (0.007) (0.005) (0.023) (0.029)
Difference mean allocation and mean entitlement
t-statistic 4.10 4.20 1.78 0.00
p-value <0.001 <0.001 0.081 0.998
Difference mean allocation and equality
t-statistic 3.93 1.72 2.75 1.57
p-value <0.001 0.098 0.008 0.122
No. of obs. 24 24 44 47
Notes: The differences in means between allocations and entitlements employ paired t-tests.
According to the HVIC Hypothesis in Figure 3, average Group allocations should exceed
equality in Japan but not the US. The results of Table 6 reveal the opposite finding: mean
allocations in the US significantly exceed one-half, whereas the difference is not significant at
conventional levels in Japan. If we adjust the hypothesis to add an equal measure of self-interest,
then Japanese allocations should still exceed US ones, but the reverse is actually the case
14 Additional regressions explore effects on the choice of equity versus equality by adding interaction
terms of the scales with the entitlement (for the rationale, see the discussion of equation (2) in section 3.3 below). These similarly reveal no effects of the scales that are significant at conventional levels, although introducing so many interaction terms produces multicollinearity that compromises the usefulness of such tests.
15 In addition, validity is in question here with the self-reports: contrary to expectations, mean scores on
[image:26.612.63.537.223.482.2]according to a two-tail t-test (t=2.27, p=0.027).16 Note also there is no self-interested bias in
Known Stakeholder allocations: mean allocations do not exceed mean entitlements at
conventional levels of significance. Returning to Table 5 for regression analysis of the Known
Stakeholders, we see these individual dictators allocate, on average, amounts between equity and
equality. This is consistent with the HVIC Hypothesis for Japan, which is posited to have a mix
of HC and VC, but not with the proportionality of VI posited for the US. Overall, then, the
evidence from Group and Known Stakeholders is mostly inconsistent with the HVIC Hypothesis.
In addition to the cultural hypothesis for which it was primarily designed, the Group
Stakeholder treatment is also related to studies in which subjects make both group and individual
dictator allocations. For example, Cason and Mui (1997) find individuals might be slightly more
selfish than groups (or “teams”), whereas Luhan, Kocher and Sutter (2009) report that groups are
more selfish than individuals. Our results from Table 6 on mean Group and Known Stakeholder
allocations are more consistent with the latter study, although the Group selfishness is only
marginally significant for Japan. A Tobit regression of XA allocations on their entitlements and
their previous Group X allocation to themselves show, in fact, that Group X selfishness only
impacts individual selfishness in the US but not Japan (see Table A4 in the Appendix).
3.3 Demographic Variables
To examine whether allocations are related to demographic variables, we added the
following regressors to equation (1): age, student expenditures during the school year, student
earnings, parents’ annual income (in seven discrete categories), work hours per week, a gender
dummy, and, for US subjects, dummy variables for Asian, black, Latino and Middle Eastern.17
16 One conjecture about the lower level of self-interest in Japan is that it is due to single-blind anonymity:
Japanese subjects might be more inclined than US subjects to alter their decisions in order to present themselves more favorably to the experimenter. As mentioned previously, we did not see a way to conduct this experiment double blind, but any concern about this should, in any case, be allayed by a number of facts. First, the lead experimenter in the dictator room helped with registration, and whenever he recognized a subject, the subject was specifically assigned to a different room. Second, the lead Japanese experimenter was a graduate student who, in both countries, has lower social status than a professor, who was used in the US. Third, we know of no evidence that single blind procedures prompt any different response among Japanese subjects than among Western ones. For example, Okada and Riedl (1999) use the single blind method and find no significant difference, indeed, evidence elsewhere does not support any strong experimenter effect in general (e.g., Cason and Mui, 1997, and Bolton et al., 1998).
17 The questionnaire includes three variables that are not analyzed here, viz., college (e.g., Business,