Munich Personal RePEc Archive
The Gross Domestic Product. History,
relevance and limitations in its
interpretation
Georgescu, George
10 September 2016
Online at https://mpra.ub.uni-muenchen.de/73644/
1
The Gross Domestic Product.
History, relevance and limitations in its interpretation
George Georgescu
National Institute for Economic Research Romanian Academy
Abstract. Despite theoretical and methodological improvements by national accounts framework revisions, not without disputes and confrontations of views, the growing complexity of economic and social phenomena under globalization circumstances has led to increasing difficulties in the design, monitoring and implementation of specific policies depending on GDP indicator. The paper focuses on the analysis of the GDP relevance and limitations in its interpretation, including a retrospective view. Some inconsistencies as regards the metrics of GDP (illegal activities, unobserved economy, self-consumption in
rural households, owner’s imputed rents) are highlighted. Because the GDP does
not take into account the impact of important factors of progress (depletion of natural resources, environmental factors, urban concentration and rural depopulation etc.) and does not reflects neither the citizens wellbeing (starting from Easterlin Paradox), efforts to develop new statistical standards in order to complement/substitute GDP with other indicators and/or building composite indicators that integrates various aspects of quality of life have been made, but without meeting a general consensus at the global level. In the end of the paper other derived indicators (GNP, GNI, AIC) are discussed and some
considerations regarding the time horizon of Romania’s real convergence with
the EU, including the accession to Eurozone are added.
Key words: System of National Accounts, GDP limitations, International Comparison Program, wellbeing, Romania EU convergence.
JEL Classification:B15, B41, C82, E01, N10, O11
Note. Revised version in English of the paper in Romanian having the title:
2
The Gross Domestic Product.
History, relevance and limitations in its interpretation
George Georgescu
National Institute for Economic Research Romanian Academy
1. GDP and National Accounts
1.1 Brief history of National Accounts
The first attempts to estimate the National Accounts dates back to the seventeenth century, being attributed to William Petty (16761) who, in the assessment of income and wealth at the personal and national levels included components such as land, ships, housing and other real estate, recommending that taxes to be paid in other ways than gold and silver, as a result of the increase in fiscal capacity of England, at that time, engaged in a war with the Netherlands.
A century later, Adam Smith (17762) introduced the idea that the wealth of a nation is based not only on activities in agriculture and mining, but the domestic production should include also manufacturing activities, although without providing a concrete way of measuring wealth (or production). After another century of economic thought evolution, in the late of 1800s, the neoclassical approach of welfare, particularly through the work of Alfred Marshall (18903), recorded significant progress towards a more rigorous conceptual and terminological framework of economics (defining supply and demand, marginal utility, costs of production, market value or price), including notions on production metrics.
In terms of measuring the aggregate economic activity, domestic production and the development of econometrics, in the 1930s, the work of Colin Clark (19324) in the United Kingdom and Simon Kuznets (19345) in the United States made a major contribution. The latter, at the request of US Congress, has developed a uniform set of National Accounts, considered the prototype of what was to be transformed afterwards into a system of standards at international level.
1
W. Petty, Essays on Mankind and Political Arithmetic, Project Gutenberg, transcribed from the Cassell & Co. edition by David Price, London, 2014 (First edition: 1676).
2
A. Smith, An Inquiry into the Nature and causes of the Wealth of Nations, Edited by S.M. Soares, Metalibri edition, London, 2007 (First edition: 1776).
3
A. Marshall, Principles of Economics, Palgrave Macmillan, London, 2011 (First edition:1890).
4
C. Clark, The National Income 1924-31, Frank Cass & Co Ltd, london, 1965 (First edition: 1932).
5
3
John Maynard Keynes (19366) had a revolutionary approach to economic thought in the interwar period. In his macroeconomic vision, based on the primacy of demand and an active role of the state in moderating the economic cycles fluctuations (boom and bust), including the US post-crisis recovery after the '30s Great Depression and the World War II, the use of new tools of National Accounts was of crucial importance.
Following the theoretical and methodological improvements in the National Accounts framework, including the Gross Domestic (or National) Product measurement, not without disputes and confrontations of views7, subject on which we shall further return, the growing complexity of economic phenomena and the increasing difficulties encountered by the decision makers in the design, monitoring and implementing specific policies, exacerbated by crises or wars, have imposed the necessity of amending the macroeconomic tools, associated with more clear indicators and methodologies, both nationally and internationally agreed.
Shortly after the establishment of the United Nations in 1947, a committee of experts from the Statistics Commission, under the leadership of the British economist Richard Stone8 (Nobel laureate for economics in 1984) delivered a report on National Accounts, containing principles and methodological recommendations of compiling them, in order to ensure also the international comparability of data.
This report is considered as substantiating the first version of National Accounts (System of National Accounts - SNA) drafted in 1953 by the UN Statistical Commission, which included a set of 12 standard tables, designing a detailed classification of flows in the economy, appropriate practically for all countries in the world.
After slight revisions done in 1960 and 1964, the SNA was considerably extended in 1968, by adding input-output tables, methodological changes that allowed the estimates of indicators in constant prices being also operated.
6 J.M. Keynes,
The General Theory of Employment, Interest and Money, Palgrave Macmillan, London, 2007 (First edition: 1936).
7
In the context of multiple critics over time about the limitations of GDP as a measure of macroeconomic performance (between them, Nobel Prize winners for economics as Daniel Kahneman, Robert Solow, Joseph Stiglitz, Amartya Sen, Muhammad Yunus) it should be pointed out that Kuznets himself, in arguing the utility and interpretation of the indicator, in 1934, made some remarks about its shortcomings, warning that the welfare of a nation can scarcely result by measuring the national income. Moreover, in 1962, returning to the subject, Kuznets mentioned that one have to distinguish between the quantity and quality of growth, and between the short-term and long-term, and, in case of establishing a specific objective of economic growth, its type and purpose requiring to be clearly specified (European Parliament, Alternative progress indicators to Gross Domestic Product as a Means Toward Sustainable Development, EP, Policy Department, Brussels, 2007, p. 12).
8
4
Subsequently, the SNA was reviewed in two stages, namely in 1993 by harmonizing National Accounts with other international standards, and in 2008, by updating and adapting, somewhat late in our opinion, to the changes in the global economic environment.
It is worth mentioning that these revisions were coordinated by a working group including experts from five institutions of international importance, namely the UN, IMF, World Bank, European Union (Eurostat) and OECD, that aimed at developing a reference framework of definitions, standards, classifications and accounting rules, e.g. a unified statistical toolkit, able to ensure a consistent set of macroeconomic accounts in order to satisfy the information needs of policy making, analysis and research.
The SNA international standards, although just recommended and not mandatory, were adopted by most countries, with some exceptions, for reasons that are rather related to the economic development level and/or the type of political regime (many countries on the African continent, North Korea, Cuba).
At the European Union level, the SNA standards were adapted to the structures of Member Countries, under the European System of Accounts (ESA), established in 1995 (according to the SNA 1993) and revised in 2010 (according to the SNA 2008).
It must be emphasized that, in accordance with the European Parliament Regulation No. 549/2013, the reporting and publication of National Accounts data, based on the methodology envisaged by ESA 2010 standard, became mandatory for the Member States in September 2014.
The necessity of these last amendments was generated by the accelerating globalization, the fragmentation of the world production and the expansion of international value-added chains led, mainly, by the multinational companies, the increased cross-border movement of persons, goods, services, capital, information and the increasing interconnection of national economies, as well as the financial markets, dramatically highlighted by the global crisis triggered in 2008, with rapid spillover effects around the entire world.
It was found that these new phenomena induced by the globalization have affected the relevance of traditional indicators, including those based on the National Accounts, introducing distortions that have damaged the quality of data and their correspondence with real phenomena in the world economy, directly impacting on their usefulness in decision making and having to be corrected by revising the existing international standards and introducing new ones to compensate the lack of information and the emergence of so-called data gaps9.
Furthermore, we will briefly focus on some major effects of the 2008-2009 global crisis upon some macroeconomic and financial concepts and approaches.
9
5
1.2 Effects of the global crisis on macroeconomic and financial concepts
The shock of the global crisis of 2008-2009 highlighted, in a dramatic manner, the need for another conceptual and methodological approaches to macroeconomic and financial stability, fundamentally different, with effects on GDP relevance, including its interpretation paying maximum analytical attention of the related data.
One of the most important changes has been generated by the observation that a crisis triggered on a financial market niche (the sub-prime mortgage market in the US), appreciated as having an insignificant dimension compared to the overall American financial system, could be transmitted extremely fast, by contagion effects, in an interconnected global context, on a large number of markets around the world, which imposed, among others, new connotations regarding the definition and assessment of the systemic risk10.
In general, the systemic risk is considered as referring to the failure in complying with the obligations, financial or other, of one participant in the system, which has led to the failure of meeting the commitments of another participant, thus jeopardizing the stability of the entire system. From this definition it follows that the systemic risk is associated with all and, respectively, each system / subsystem related to the functioning of global markets mechanisms and can be validated at the local level too, in the sense of countries or group of countries with a major influence on the financial balances and the world economy. For instance, as concerns G-20, a number of 10 countries are listed as having systemically important financial sectors.
In terms of financial stability, the systemic risk is associated with the possibility of occurrence, suddenly and unpredictably, of an event that causes a loss of economic value or confidence in an important area of the financial system, with significant adverse effects on the real economy, under the circumstances of the absence of strong and immediate responses from policy makers or policy-led authorities.
If this definition may be categorized as having an abstract substance, the operationalization of evaluating and monitoring the systemic risk represents a challenge that, at least so far, the academic world and the regulatory national and / or international institutions, have failed to agree on the adequate solutions. In practice, a number of indicators, simple or aggregated, both in the category that have the ability to report phenomena having a crucial role in triggering previous crises (as the widening of current account deficits) and new indicators, with a more complex nature (as the interbank network connections), which implies immediate data access and the use of sophisticated methods and models to process them for assessing and monitoring the credit risk or the default contagion risk.
10
6
In order to manage, supervise and assess the systemic risk, on the occasion of G-20 meeting in April 2009, it was decided to establish a Financial Stability Board (the successor to the Financial Stability Forum), which was confirmed at the important summit at the level of heads of state held in September 2009 (Pittsburgh, USA). The Financial Stability Board (FSB) has its own Charter and organizational structure, with the essential task of promoting the reform of international financial regulations. In January 2013, this multinational board was set up as a non-profit organization based in Basel, under Swiss jurisdiction.
The structure of the FSB is extremely complex, comprising, at the level of G-20 member countries, the national authorities responsible for financial stability (ministries of finance / treasury, central banks, supervision agencies / committees), international organizations (EU, OECD), regulatory or financial institutions (IMF, World Bank, BIS), international financial markets committees / associations in specific sectors, involved in developing standards and best practices.
Despite certain progress (mainly, the implementation of Basel III standards in the banking system), as stated in the last report of the G-20 FSB 11, a number of inconsistencies in critical areas concerning, in particular, the implementation of resolution mechanisms, the reform of OTC (over-the-counter) derivatives, the prevention of new risks and vulnerabilities arising from changes in the structure and liquidity of markets, the financial institutions misconduct (especially at the level of top management) etc. is still maintaining.
Reducing the risks to financial stability, as clearly stated in the FSB report's conclusions12, depends on the improvement of information quality, the transparency and due time they are made known, in such a way as to allow economic and financial actors to understand and better manage the risks and the sudden changes occurring in the markets.
In this regard, starting from the IMF / FSB report presented in November 200913, on the financial crisis and the scarcity of information, the G-20 have launched the Data Gap Initiative (DGI) and a multiannual action program, which includes 20 recommendations aimed to recover the situation regarding the lack of information in four major areas: risk assessment in the financial sector; cross-border financial links; vulnerability of the domestic economy to external shocks; improving communication of official statistical data.
At the international level, the DGI was coordinated by an inter-agency group chaired by the IMF and including BIS, ECB, Eurostat, OECD, UN and World Bank.
11
Financial Stability Board, Financial Reforms – Achieving and Sustaining Resilience for All, FSB Report to the G20, November 9, 2015, p. 4.
12
Idem, p. 7.
13
7
On the occasion of the Global Conference on the DGI progress held in June 2014, the representative of the IMF Statistics Department, He Qi14, said that, virtually, in all four major areas of interest, the conceptual and statistical framework needs to be developed further and, more important, despite the existence of this framework, efforts should be focused on collecting data on financial soundness indicators, CDS (Credit Default Swap), housing market prices etc., and on improving the communication of official statistical data regarding key global indicators (PGI - Principal Global Indicators)15.
Clearly, one of the most important indicators which is seeking to eliminate the lack of information is the GDP, including its detailed breakdown on the demand side (expenditures method).
The inter-agency group is trying to contribute to the improvement and implementation of common standards also regarding the methodology based on purchasing power parity (PPP), the harmonization and dissemination of real estate market price indices etc.16.
Since a detailed analysis of methodological changes suffered by SNA over time exceeds the objectives of this paper, we focus further on the main changes of the ESA 2010 standard compared to 1995 edition, and their effects on the GDP revision at the European Union level.
1.3 Methodological changes of ESA 2010 and the impact on GDP revision
The new ESA 2010 standard imposed a series of conceptual adjustments in the framework of the National Accounts, in its scope and coverage, also by the expansion of quarterly and regional accounts, and the introduction of new chapters concerning the satellite accounts, of the public administration and the rest of the world.
Summarizing, the main changes relate to:
- reclassifying Research and Development (R&D) expenditures from intermediate consumption to gross fixed capital formation, materialized in intellectual property assets, to be recorded in a satellite account;
- reclassifying expenditures for weapons systems from intermediate consumption to gross fixed capital formation;
14 He Qi,
G-20 Data Gaps Initiative, IMF/FSB Global Conference on the G-20 DGI-Progress in Five Years, June 25-26, Basel, Switzerland, 2014, p. 5.
15
A database managed by the IMF, designed to provide comparable data to the G-20 member countries, of high quality and easily accessible, including over 100 indicators covering the real sector, external sector, financial sector, public finances, public debt, inflation, exchange rate etc.
16
8
- changing the methodology for the financial services assessment by introducing the analytical concept of capital services, registered separately, as a component of the value added;
- redefining the financial assets, by including a wider coverage of the financial derivative contracts;
- introducing new rules for pension funds registration, by including the entitlements and associated flows for all public and private pension schemes;
- changing the registration of purchases and resale of goods subject to processing in the same country or abroad, according to the "change in economic ownership" principle;
- redefining the regime of the financial companies, mainly on "special purpose entities" type, the public-private partnership, the dividends paid by the public corporations, the credit guarantees;
- introducing new accounting rules for the registration into the GDP of illegal activities (prostitution, production and smuggling of drugs, alcohol, tobacco).
Nominal GDP (thousand billion euro)
ESA 2010 compared to ESA 95, in 2000-2013
Figure 1
9
In accordance with the preliminary Eurostat estimates published in 201417, the implementation of ESA 2010 and the review of the figures for the period 1997 to 2013 resulted in a significantly higher nominal GDP, by 3.5% on average annually over the whole EU-28 for the entire period, compared with the estimations of the ESA '95 methodology, mentioning also a limited impact on the GDP growth rates.
As shown in Figure 1, in terms of nominal GDP, the differences between the two methodologies, in absolute terms, ranged from 2,500 billion euro to almost 4,000 billion euro annually at the EU-28 level, throughout the period 1997-201318. These significant differences following the revision of GDP figures according to ESA 2010 were caused both by methodological changes and statistical improvements, the latter due to the use of new data sources, mainly as concerns the estimation of illegal activities.
[image:10.595.65.532.435.632.2]In 2010, in some countries, where the differences in the GDP levels estimated under ESA 2010 compared to ESA '95, were significant, comparing also with the average of +2.3% registered at the level of EU-28 (Sweden: +5.5%; Finland: +4.7%), they are explained, almost exclusively, through the impact of methodological changes, mainly due to the reclassification of expenses for Research and Development (see Table 1).
Table 1
The impact of methodological changes and statistical improvements in several EU countries in 2010
- % of GDP -
Source: Eurostat, First estimation of European aggregates based on ESA 2010, Eurostat News Release no 157/2014 - 17 October, 2014, p. 4.
17
Eurostat, First estimation of European aggregates based on ESA 2010, Eurostat News Release no 157/2014, 17 October, 2014.
18 For the US, the data revision according to SNA 2008 led to a higher nominal GDP by
nearly 4%, while in the case of China it was estimated that the impact of methodological changes on GDP stood at 16% (Independent Evaluation Office, Behind the scenes with data at the IMF: an IEO evaluation, IEO-IMF, Washington, February 25, 2016, p. 8).
Country Difference
(GDP increase)
Methodological changes ESA 2010
Statistical improvements
Total Total of which: R&D
EU-28 3.7 2.3 1.9 1.4
Bulgaria 2.0 0.4 0.3 1.6
Czech Republic 4.3 3.1 1.2 1.2
Cyprus 9.5 1.1 0.2 8.4
Finland 4.7 4.2 4.0 0.5
Netherlands 7.6 1.7 1.7 5.9
Poland 1.5 1.2 0.5 0.2
ROMANIA 1.9 0.6 0.5 1.3
10
In other countries (the Netherlands: +7.6%; Cyprus: +9.5%) the differences are due mostly to the impact of statistical improvements. In this context, it is worth mentioning that, the revision by Eurostat of Romania's GDP, showed a difference of +1.9% in 2010, of which +0.6% on the account of methodological changes, and +1.3% due to statistical improvements.
Beside the illegal activities, that continue to encounter major difficulties for an adequate registration, a study of Bruegel19 pointed out that a significant influence on GDP estimations has the legal hidden economy (legal shadow economy) defined as referring to the production and services carried on so-called "black" (or "gray") market.
To these, the tax evasion, which has reached alarming levels, exacerbated by tax optimization practices and intra-group pricing transfer, mainly by the multinationals or their subsidiaries is added. It is estimated that, in 2013, the informal economy accounted for over 20% of GDP in countries like Italy, Greece, Cyprus, Lithuania, Latvia and Slovenia20.
For Romania, the non-observed (hidden) economy was estimated at 28.4% of GDP by a report of the European Commission published in 2013, which was double compared to the EU-27 average (e.g. 14.3%), noting that half of it was caused by the undeclared work, especially due to the high tax burden on labor21. In some emergent countries (India, Philippines) the share of the hidden economy is significantly higher, ranging between 40% and 50% of GDP and, in other countries, usually less developed (many African countries and some from Latin America) even exceeding 50% of GDP22.
The Implementation Guide of SNA 2008 prepared by the UN experts, in the chapter on time series, revisions and statistical discrepancies, was drawing attention on the fact that, in most cases, the published data cover a historical period of 10-15 years, while the macroeconomic quantitative modeling principles and methods require the use of longer time series, up to 50 years23.
Under the circumstances of increased uncertainty and lack of reliable data, based on the evolution of real phenomena, the quality of macroeconomic forecasts, as essential tools in the management of policies and the orientation of international financial markets, has deteriorated, both globally and at the regional and country levels, the time intervals for their revision from the responsible institutions becoming smaller and the corrections, in most cases, bigger.
19
S. Merler, P. Huttl, Wellcome to the dark side: GDP Revision and the non-observed economy, Bruegel, February 26, 2015.
20
OECD, Base Erosion and Profit Shifting Project, Final Reports, OECD Better Policies for Better Lives, Paris, 2015.
21
European Commission, Tax reforms in EU Member States 2013 Report, EC Brussels, 2013, p. 78.
22
Countries with the biggest shadow economy, Bloomberg, USA, 2016.
23
11 2. GDP relevance and limitations
2.1 Major methodological inconsistencies in estimating GDP
The conceptual consistency of the three methods for estimating GDP (output, expenditures and incomes approaches) does not always correspond to the effective means of compiling data, due to the diversity of sources, especially for exports and imports of services. Any error in each of these methods is leading to differences, which, necessarily, have to be published as "statistical discrepancies", but, in practice, it does not often happen24.
The average user will encounter many difficulties to realize, unless the explicit size of statistical discrepancies is made known, if they do not exist, or merely they have not been published, so his degree of attention to this issue needs to be the highest, in order to ascertain a benchmark on the data accuracy.
Beside the statistical distortions occurring mainly because of measurement errors of exports and imports of services, the accuracy of GDP data is affected also by the substitution of the lack of direct sources for data with estimates, such as the case of some expenditures of the central and / or local government, the fixed capital depreciation, the interest paid / received, some emergent activities (Internet, purchase of software, mobile phone services etc.) in rapid expansion.
Another major methodological inconsistency of GDP estimates is generated by the consumption of goods and services in-kind, associated, mainly, with the household sector and the subsistence agriculture.
Although they should be included in National Accounts, the transfer of such goods and services among resident households escapes, usually, to statistics, which have more significant effects in countries where the non-fiscalized economy has a more important size.
Assessing the households’ self-consumption in rural areas, which, in many countries, has a significant dimension, shows a high degree of approximation, both due to the difficulties of estimating the contribution of product inventories from the previous period, taking into account the seasonality of production, and the use of relative prices associated to the principle of nearest local market, including the related transportation costs.
In Romania, the share of self-consumption in GDP is relatively high, although registering a downward trend in recent years, namely from 13% in 2004 to 6.4% in 2011 and about 5% in 2014, with the mention that the
24
12
difference ranging from simple to triple between this ratio in rural and urban areas respectively25.
In the category of goods and services produced in households for their own consumption the construction / expansion of dwellings, shelters for livestock, warehouses for grains, domestic services for own consumption etc. are also included, making virtually impossible the exhaustive and accurate measurement of the entire self-consumption.
Another methodological problem is generated by the inclusion in the households final consumption of the imputed rent for owner-occupied houses or the market rent collected / paid for rented houses, especially if the proportion of dwellings for rental is high and the real estate market has a high degree of stratification / segmentation (e.g. urban / rural, major regional disparities in the standard of living26), as is the case of Romania.
The GDP limitations arise also from the fact that non-market activities escape National Accounts records. Despite many attempts, there is no consensus on the valuation of homework (noted also as unpaid or non-market housework, sometimes as household production) e.g. some domestic activities, especially in the category of services, such as meal preparation, house cleaning, washing, children care and elderly care etc.
Some studies have revealed a monetary value of domestic work estimated at percentages between 30% and 50% of GDP during 1970-1990 in countries like USA, Germany, France and Canada27.
More recent calculations have pointed out that, in the US, the value of domestic work accounted for 26% of GDP in 2010, compared to 39% in 196528. In most of the EU Member States, the household production was estimated at figures between 20% and 40% of GDP29.
Even if the numbers have a certain degree of approximation, the downward trend in the share of GDP of the housework value is consistent with the increase in the development level, reflecting the more and more domestic activities transition to the market services.
Although the idea dates back to the 1970s30, only recently, at the UN level, a development in the context of national accounts has been agreed, the extended (satellite) accounts for highlighting the accounting of non-market
25
National Commission of Prognosis, The projection of main macroeconomic indicators, CNP, Bucharest, September, 2010 and November 2012, 2015.
26
United Nations, idem, p. 466.
27
A. Chadeau, What is households non-market production worth?, OECD Economic Studies, No 18, Spring, 1992, pp. 85-103
28 B. Bridgman, A. Dugan, M. Lal, M. Osborne, S. Villones,
Accounting for Household Production in the National Accounts, 1965–2010, BEA Survey of Current Business, May 2012, pp. 23-36.
29
V. Miranda, Cooking, Caring and Volunteering: unpaid work around the world, OECD Social, Employment and Migration Working Papers, 3 March, 2011, p. 30.
30
13
activities, especially of social and environmental nature, that can be important growth factors, including capital and household services and unpaid household work.
At the EU level, despite some progress, the record of these activities in satellite accounts is still in the phase of methodological debates, the reconciliation of data and their proper integration remaining a difficult challenge31.
These methodological deficiencies, whose persistence, through a multiplier effect, lead to considerable margins of error in measuring GDP at national level, are multiplied by international comparisons, which implies the figures conversion into a single currency (usually US dollars or euro, time series in constant prices) by using increasingly volatile exchange rates and / or by using specific methodologies in virtual currencies (PPP, PCS) that take into account the purchasing power parity, in order to ensure the comparability of data.
A more detailed discussion on the matter related to the data comparability shall be made further, where the evolution of the GDP in Romania during the last 150 years, including various international comparisons will be analyzed.
2.2 Criticisms of GDP
The criticisms of GDP are manifold, some of their roots being fundamentally different, but having an interfering area, which, in the attempt - often apparent - of harmonizing them, seems to have drifted on the land of speculations, farther from the frontiers of real phenomena knowledge that face the contemporary world and their dynamics understanding, making almost invisible and, therefore inoperative, the maneuver room in correcting the adverse effects and, respectively, in their orientation towards the desirable objectives of development at the national, regional, continental and global levels.
One of these roots has, as origin, the hegemony of the economic thought after the Second World War, e.g. the approach based on growth (growth-centric thinking), prevailing until the '90s, which had, among the adverse implications, the politicization of GDP, by diverting its meaning and function, essentially economic, and assigning it an untouchable nature, which stemmed from the fear that, granting a greater consideration, otherwise rightful, to other factors (the environment for example) would have meant taking decisions with potential political complications, requiring legislative changes, revising the economic, monetary and fiscal policies, that would suppose increases in government expenditures.
31
14
Thus, despite clearer evidences of its limits, the GDP has become a standard of success or failure, the singular measure indicating the course of the development progress, opposed to the gradually increase in the complexity of social and economic issues under the circumstances of more interconnected global markets, diverting and concentrating the attention of all stakeholders and decision makers in one direction only.
At the level of the public perception, it has been induced, by "omniscient" officials, maybe deliberately, the idea that GDP has the ability to compress the diversity and immensity of an economy, condensing into a single measure all phenomena of any kind, which occurs within an area, at national or global levels32.
Moreover, it has witnessed the foundation and strengthening, per se, of a "reversed" logic of the development process, namely, in terms of market economy, rule of law and democracy, by converting GDP, from a means of increasing the population wellbeing, to an end in itself, acting sometimes as a campaigner agent during the general elections, rendering absolute the assessment of the measure in which this policy target is being reached with the real performances of the economy, implicitly, as result of the political power in office33.
This new paradigm, in a political interpretation, most often wrong, generates the manipulation of voters on the basis of flawed promises (economic growth, employment creation, social assistance etc.) without a real foundation, and, into an economic approach, that could be merely validated, influences, in a decisive manner, the investors decisions and the financial flows on capital and / or goods markets and, to some extent, the national and international policies34.
An example of an arbitrary manipulation of GDP, its conversion to political ends and distorting the realities, occurred just in Romania during 2007-2008, preceding the economic and social effects caused by the global crisis of 2008-2009, but which, more likely, have even exacerbated them.
32
J. Gertner, The Rise and Fall of the G.D.P., The New York Time Magazine, May 13, 2010.
33
The intentional manipulation is often a case of Goodhart’s Law, the popular formulation of
which is “When a measure becomes a target, it ceases to be a good measure”. Goodhart’s Law
(named after an economist who was a member of the Bank of England’s Monetary Policy
Committee) refers to the vulnerability of a statistical indicator to manipulation once it is used to define a policy target (Independent Evaluation Office, Behind the scenes with data at the IMF: an IEO evaluation, IEO-IMF, Washington, February 25, 2016, p. 8).
34
15
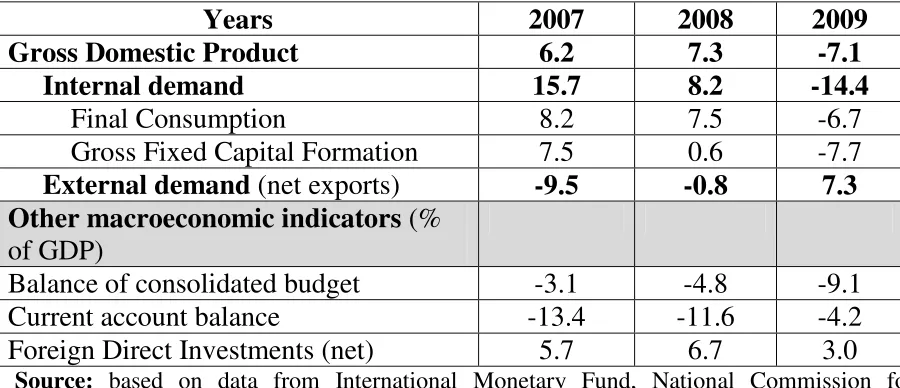
[image:16.595.67.517.236.430.2]Examining the contribution of Romania's GDP growth factors on the demand side (Table 2) it was found an atypical macroeconomic picture during 2007-2009, marked by major structural changes in only three years, i.e. from a situation that seemed favorable (high GDP growth rates in 2007 and 2008) to one of extreme fragility (GDP decline by 7.1% in 2009).
Table 2
Contributions to GDP growth in Romania
and other macroeconomic indicators in 2007, 2008 and 2009
- percent -
Source: based on data from International Monetary Fund, National Commission for Prognosis, National Bank of Romania.
It is worth mentioning that, in 2009, Romania was saved from a financial collapse only by resorting to the external assistance from the IMF and the EU (amounting to 20 billion euro), procured under conditions of extreme emergency. Without going into details, just noting that this slippage, apparently from one extreme to the other, occurred amid a major imbalance between the domestic demand (+15.7%) and the external demand (net exports contribution of -9,5%) in 2007, witnessing an unsustainable increase in GDP in 2007 and 2008, based less on the gross capital formation (helped anyway by the massive inflows of Foreign Direct Investments up to 2008) but mainly on the increase in final household consumption, fueled by the wage rises and the consumer credit boom, under the circumstances of budget deficits widening and of the trade and current account deficits.
The fact that the increase in consumption and, therefore, in generating economic growth, was unsustainable is proved by its transformation from the factor with the biggest contribution to the GDP growth (+8.2% and +7.5% in 2007 and 2008 respectively) in the determinant of GDP decline in 2009 (a negative contribution of 6.7%), offset partially, in an atypical manner for the Romanian economy, by the hyper-positive contribution of net exports (+7.3%), due, in fact, to the fall in imports of goods (38.9 billion euro in 2009 compared
Years 2007 2008 2009
Gross Domestic Product 6.2 7.3 -7.1
Internal demand 15.7 8.2 -14.4
Final Consumption 8.2 7.5 -6.7
Gross Fixed Capital Formation 7.5 0.6 -7.7
External demand (net exports) -9.5 -0.8 7.3
Other macroeconomic indicators (% of GDP)
Balance of consolidated budget -3.1 -4.8 -9.1
Current account balance -13.4 -11.6 -4.2
16
to 57.2 billion euro in 2008) and reversing, in a shock-type manner, the ratio between the indexes used for calculating this contribution.
The Romanian authorities, placed in an election year in 2008, rendering absolute the figures showing high GDP growth rates, without an analysis of its factors, which would have identified specific vulnerabilities, have pushed the government expenditures to excessive levels, especially due to significant wages growth, leading in 2009 to a record budget deficit, accounting for 9.1% of GDP. In June 2010, according also to the conditionality regarding the decrease in the ratio of budgetary sector wages to GDP, stipulated in the IMF-EU agreement for financial assistance concluded in 2009, the public finances recovery imposed severe austerity measures, including the wage cutting by 25% in the budgetary sector, which have had severe economic and social effects, some of them being felt until today.
On the other hand, the authorities have not adopted the most appropriate monetary policy in order to mitigate the momentum of lending (the increase, in 2006, in the reserve requirements ratios to 40% on forex-denominated liabilities of credit institutions and to 20% on those in leu-denominated, in order to contain the credit expansion, has proved detrimental) and did not properly perceived the dangers of a real estate bubble occurring, as well as the severity of external financial imbalances impact, stressed by the global financial crisis triggered in September 2008, which affected, directly and indirectly, the banking system in Romania, dominated by foreign-capital banks, has not been anticipated35.
Therefore, a radical change in the aggregate demand composition, happened in a relatively short period of time, as shown in the case of Romania, which reveals rather a vulnerable economy, especially if the GDP growth is achieved, mainly, by an excessive increase in consumption.
A sustainable development, even if looked upon through the angle of the evolution of a single aggregate indicator (GDP), requires a long-term balance between the domestic and the external demand contribution and also between the domestic demand components, in such a way that the gross fixed capital formation and, particularly, the investments - private and public - could spread their spillover effects vertically and horizontally, strengthening the overall economic growth in time and space.
Another vulnerability of the economy, unreported by the GDP indicator, even in an apparently stable configuration and balanced growth factors, stems from the fact that it does not reflects the degree of indebtedness nor the international investment position of a country, i.e. the extent to which growth was due to the increase in consumption and / or investments on the account of internal and / or external loans.
35
17
Or, if the rise in the indebtedness degree has not positive effects on raising the productive capacity of the economy and the added value, also by multiplier effects, the payments associated to the outstanding debt and / or the volatility of foreign capital may turn into real barriers to growth.
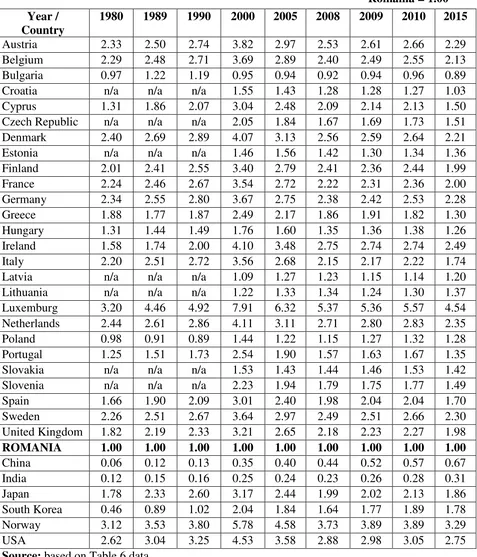
A significant example in this respect is still the case of Romania, where the public debt, expressed in euro, increased two times faster than GDP between 2000 and 2015, and being in the situation as the annual service (representing over 10% of GDP in the last years) has to be honored mainly by debt refinancing36.
As regards the conceptual shortfalls, it should be mentioned that GDP, taken as such or per capita, does not reflect inequalities in income distribution and could hide disparities, both in time and space, which, as shown in some recent studies37 have deepened in recent years, becoming of high concern at national, continental and world levels, that witnessed an increase in the degree of poverty, social inequalities and territorial discrepancies, despite the overall GDP growth.
The attempt to bring goods and services domestically produced in a given period to a common value denominator, using average or aggregate prices, is somewhat forced, as many reserves in interpretation due to inconsistencies of estimating the "real" growth by computing the GDP deflator, which is based on a variable basket of goods and services, corresponding only approximately to the complex patterns of consumption and investments and their changes.
The analysis of GDP, both statically and dynamically, is far from be able to provide a clear picture of the situation and the evolution of an economy, lacking in essential information, such as those concerning the fixed capital, the material, financial and human resources, as well as the availability, sustainability and effectiveness of their utilization.
In cases when GDP is taken as a reference, one must not neglect the effects of distortion on other important derived indicators to which it relates, among them, for example, the calculations of productivity, the public debt and the annual service, the different components of the budget spending (defense, education, health, R&D), international investment position etc.
Arguing that GDP still remains the best indicator for measuring the performance of a market economy, a European Commission document published in 201038, recognizes explicitly the limits of GDP, especially in terms of its relevance in assessing the progress and social welfare.
36
Idem.
37
T. Piketty, Capital in the Twenty-First Century, Harvard University Press, 2014.
38
18
Moreover, it stated that some GDP components can be presumed to imply even a drop in citizens' wellbeing, such as, for example, increased defense spending, including the related investments, which absorb some of resources designed for infrastructure development, education and health.
In this regard, a classic example quoted in the literature, is the hypothetical case, in which a government decides to build a pyramid, the huge related costs concurring to the economic growth revealed by the GDP, but having no contribution to the increase in the population standard of living. On the contrary, it diverts funds that could have been allocated to activities associated with the wellbeing of citizens39.
Other criticisms of GDP refers to the fact that it does not take into account the impact of some important factors reflecting the economic and social progress, such as the depletion of natural resources, the environmental damages, the urban concentration, the rural depopulation, the social inclusion and, taken as such, it provides no perspective on the medium- and long-term dynamics40.
In a wider approach, in order to understand the sources of growth, as Nakamura showed41, the economic theory and the measurement of economic phenomena should be developed simultaneously, in a correlated and interdependent manner. Thus, the National Accounts analytical framework, originally built on the basis of industrial and production structures in the middle of the last century, in terms of consumer welfare too, should be developed with other indicators, able to reflect the sources of aggregate growth, and also the intangible assets, as part of individual wellbeing.
In this context, as mentioned by Nakamura, it should be understood that the GDP growth rate is totally inadequate for guiding the economic policies in this century, by far too complex to be guided by the dynamics of a single indicator42.
The work towards the improvement of macroeconomic tools and the development of new statistical standards, amid the transition from an analytical debate based on accounts to the one having philosophical connotations, focused on two major directions, namely that of complementing GDP with a series of other relevant indicators, reflecting better the wellbeing of citizens, as well as of building a composite indicator that integrates various aspects of the quality of life.
39
F. Shostack, What is up with the GDP?, Mises Institute Daily, August 23, 2001.
40
V. Voineagu, C. Mindricelu, D. Ștefanescu, Beyond GDP – through environmental accounts, Romanian Statistical Journal, No. 6 / 2010, p. 4.
41
L.I. Nakamura, Intangible assets and national income accounting, Review of Income and Wealth, Series 56, Special issue1, June, 2010, p. S153.
42
19 3. Addressing GDP deficiencies
3.1 Stiglitz-Sen -Fitoussi Commission and its recommendations
Starting from the GDP limitations, in February 2008, at the initiative of French President, Nicolas Sarkozy, a Commission for the measurement of economic performance and social progress, led by Joseph Stigliz, Amartya Sen and Jean Paul Fitoussi was set up, in order to assess the validity of alternative tools and the requirements for the coverage of statistical information needs, including to ensure the data sources reliability and to identify other indicators relevant to the progress of society.
In the Commission’ work, more than 20 experts from various international
organizations (UN, OECD, INSEE), and prestigious universities in the world (Harvard, Princeton, Stanford, Massachusetts, Chicago, Columbia, London School of Economics and other) were co-opted. The activity for almost two years of the Stiglitz-Sen-Fitoussi Commission has ended up in a 300-page report, released in September 2009, in Paris43.
This report presented, based on an extremely laborious analysis, the problems that the complex phenomena of contemporary society are facing with, ending with a series of recommendations that covers three major areas, as follows:
I. Developments / interpretations related to GDP
- Taking into account, in a larger extent, the income and consumption compared with production;
- Closer association of income and consumption with wellbeing; - More emphasis in terms of household’s perspective;
- Greater attention paid to income distribution, consumption and wellbeing;
- Implementing of tools for revenue measurement to non-market activities.
II. Life quality
- Inclusion, in the surveys conducted by statistical institutions, of questions on evaluations, experiences and priorities of citizens;
- Improved measurement of the public health, education, social connections, environmental conditions and social insecurity;
- Assessing inequalities, in a comprehensive manner, by indicators that reflect the quality of life;
43
20
- Structuring the surveys so as to allow the assessment of the connections between the different components of the quality of life at the level of each person and using this information in the policy designing in various fields;
- Providing the necessary information for the aggregation of various dimensions of quality of life and for building different indexes. |
III. Sustainable development and the environment
- Building a set of well-defined indicators, required by the assessment of development sustainability;
- Defining the components of this set to allow their interpretation in support of human wellbeing;
- Emphasizing the economic aspects of sustainability, even if a monetary index of sustainability would be appropriate in completing this set;
- Evaluating the environmental aspects of sustainability by monitoring separate indicators in their physical expression.
It can be concluded that the work of the Stiglitz-Sen-Fitoussi Commission, benefiting from a high scientific, analytical and credibility status, at the most prestigious level, demonstrated the need for a comprehensive approach of social wellbeing in relation to GDP, proving to be crucial in changing the manner of macroeconomic indicators interpretation.
The political reflection of this major change was that governments should pursue the social wellbeing and not, in an absolutist way, the GDP, which represented a turning point in the behavior of decision makers and the configuration of economic and social policies.
The European Union authorities, who have closely monitored the work of Stiglitz-Sen-Fitoussi Commission, have taken, at once, in discussion its recommendations, thereby promoting a series of debates with the aim of identifying the most appropriate formula to supplement GDP with other indicators. In 2009, the European Commission, along with the revision of the European System of Accounts (ESA 2010) previously mentioned, sent a communication to the European Council and the European Parliament44 concerning the need to extend National Accounts and to supplement it with social and environmental indicators, advancing the idea of creating a dashboard for monitoring the sustainable development. In November 2011, the European Statistical System Committee adopted a report launching a concrete action plan to implement the recommendations of Stiglitz-Sen-Fitoussi Commission, including the materialization of the idea of building a dashboard comprising a series of sustainable development indicators45.
44
European Commission, GDP and beyond – Measuring progress in a changing world, EC COM (2009) 433 final, Brussels, 2009.
45
21
This dashboard was conceived as an instrument of action for the operationalization of the Europe 2020 strategy, including issues of financing (budgets, sectoral programs), containing a total of 10 headline indicators, covering five priority objectives in the fields of employment, R&D, energy and climate change, education, poverty and social exclusion, on which depends the wellbeing of EU citizens, in all Member States and their regions (according to NUTS 2 classification), ensuring also the compatibility of the statistical systems for each level46.
A significant example of the multidimensional measure of quality of life is the population at risk of poverty or social exclusion, monitored as a key indicator under the Europe 2020 Strategy. The headline target set at the EU-28 level for this indicator is lifting at least 20 million people out of the risk of poverty or social exclusion by 2020 (compared to the 122 million people at risk in 2014, over 8 million people being in Romania).
At the level of OECD, a group of high level experts was set up in 2011 to continue the work of the Stiglitz-Sen-Fitoussi Commission47, focusing on further research on specific topics such as inequalities and gaps assessing, a work program on measuring wellbeing and progress being launched, based on the evaluation of quality of life and material conditions, as well as their sustainability, initiative on which we will return further. Along with these initiatives at the level of various international organizations aimed at reconsidering the GDP relevance and complementing it with other indicators that reflect the quality of life or environment, some advanced countries have built their own system of indicators.
A notable example in this regard is the United States. After a first attempt dating back from 2002, based on a law adopted in 2008 (The Key National Indicator Act), a National system of key indicators managed by a non-profit and non-partisan entity (composed of experts from the academic, scientific, statistical communities), independent of governance structures, was set up, with the associated website: State of the USA. This system, divided into 20 sub-indicators, has the mission to provide Americans, transparently, data and information to help them understand and assess the progress of the nation, under the most important aspects of it48.
As regards all these attempts to address the GDP deficiencies, based on complementary indicators, notable in fact and having indisputably positive effects amid improving the overall quality of macroeconomic analysis, but also of government policies, it should be noted that there remain at least two major inaccuracies of conceptual and methodological nature. On the one hand, the mix of indicators, no matter how well-articulated, is lacking, to a greater or smaller
46
Eurostat, Smarter, greener, more inclusive? Indicators to support the Europe 2020 Strategy, Eurostat Statistical Books, European Union, Luxembourg, 2015.
47
A. Gurria, Remarks delivered at the Conference Two Years after the release of Stiglitz-Sen-Fitoussi Report, Paris, 12 October, 2011.
48
22
extent, the real consistency imposed by the analytical and interpretive rightness of macroeconomic data. On the other hand, in the case of developing indicators systems at the national level, they may contradict the requirements of international comparability.
Some other attempts, more significant in our view, concerning the construction of synthetic indicators of social wellbeing or systems of alternative indicators that mitigate some of the shortcomings of GDP and of its complementary indicators are presented forwards.
3.2 Indicators and systems of alternative indicators of social wellbeing
Yet in the year 1970, Richard Easterlin has argued that in the US, as in other countries, despite the significant increase in the income per capita, the national average, in terms of wellbeing (happiness) and / or life satisfaction, seemed not to register a real growth on long-term, a phenomenon known as the "Easterlin paradox"49. Among the reasons of this paradox there are keeping
unchanged the relative position of the individuals’ social status, due to the
unbalanced distribution of benefits arising from the increased revenues, as well as the total or partial cancellation of such gains by the losses stemming from the deterioration of other important social factors (increased insecurity, lack of confidence in authorities etc.).
The first attempts to substitute GDP are attributed to William Nordhaus and James Tobin, who have defined the measurement of Net Economic Welfare (NEW) by amending the gross national product with the "negative" spin-offs (defense spending, public order), environmental damages, adding instead the non-market activities (as leisure and underground economy)50.
Since then, many studies on the consideration of various measures of welfare have been carried out, among others: the Index of Sustainable Economic Welfare (ISEW) developed by Herman Daly and John Cobb in 1980, which takes into account the links between the economy, society and the environment; the Genuine Progress Indicator (GPI) developed by Clifford Cobb, a version of ISEW that incorporates more aspects of unemployment, crime, leisure time, homework; the Genuine Savings (or Adjusted Net Savings) built by the World Bank, which measures the net investment in human capital, depreciation of fixed capital, depletion of natural resources, damages caused by pollution51.
49
R. A. Easterlin, Does Economic Growth Improve the Human Lot? in Paul A. David, Melvin W. Reder, eds., Nations and Households in Economic Growth: Essays in Honor of Moses Abramovitz, Academic Press Inc., New York, 1974.
50
W.D. Nordhaus, J. Tobin, Is Growth Obsolete?, Cowles Foundation Discussion Paper No. 319, Yale University, 1971.
51
23
Regarding alternative indicators, an internationally notable attempt dates back to 1990. Under the aegis of UNDP (United Nations Development Program) the economists Mahbub ul Haq and Amartya Sen launched the Human Development Index (HDI), a composite tri-dimensional indicator meant to reflect the human prosperity, built as geometric mean of three normalized indices of life expectancy, education and income per capita (at PPP), published starting with 1990, in the annual UNDP human development reports.
Since 2010, including as a result of the criticism that has been subjected, primarily because of disputable indicators which were considered52, the HDI has been adjusted by the aggregate level of inequality associated with each of its three dimensions (IHDI - Inequality-adjusted Human Development Index).
According to the report published in 2015, on top positions of the HDI global rankings, which includes 188 countries, were Norway, Australia and Switzerland (with HDI between 0.950 and 0.930, respectively IHDI between 0.890 and 0.860) while Romania stood on a modest 52 position (HDI 0.793, respectively IHDI: 0.711) behind all other EU Member countries, except Bulgaria53.
At the UN and World Bank levels, the concerns to assess various aspects of the economic and social conditions have resulted in the pursuit of well-being indicators, directly or by expanding various initiatives in this respect, carried on by governmental and / or non-governmental organizations.
For example, in 2002, the UN launched the MDG (Millennium Development Goals) platform, a global partnership for development having eight objectives, to which all Member States agreed, action plans with specific indicators in the areas of poverty, education, health, gender equality and the environment being elaborated.
In 2015, this platform has been updated and converted into 2030 Agenda for Sustainable Development (SDG - Sustainable Development Goals), which monitors 17 economic, social and environmental objectives, 169 targets and about 250 indicators54.
Also, in 2011, the UN General Assembly adopted a resolution55, in the explanatory statement arguing that GDP does not adequately reflect citizens' wellbeing, recommending to all Member States and international organizations to develop a new indicator reflecting the happiness of citizens, following the
52
The criticism focused on some HDI deficiencies both conceptual (the human development definition and its determinants) and methodological (the aggregation of various indicators, the perfect substitution of the three dimensions) such that, in time, the index suffered certain improvements, including by the calculation of IHDI (M. Kovacevic, Review of HDI Critique and Potential Improvements, Human Development Research Papers 2010/33, UNDP, New York, February, 2011, pp. 2-5).
53
United Nations, Human Development Report 2015, UNDP, New York, 2015, p. 216.
54
United Nations, Transforming our World: the 2030 Agenda for Sustainable Development, UN A/RES/70/1, New York, 2015.
55
24
model introduced many decades ago by the Kingdom of Bhutan, build on 4 pillars, 9 areas and 72 indicators56.
Thus, in 2012, the first annual report on the state of global happiness (World Happiness Report) has been published, under the coordination of a group of independent experts and the aegis of the UN. The report presents a global ranking based on the estimated level of happiness, including a number of more than 150 countries.
It is worth mentioning that the composite indicator of happiness is built based on six key variables (the GDP per capita at PPP, the social support in case of need, the healthy life, the freedom to make choices in life, the prevalence for generosity and the corruption perception at population and companies levels), one of the main data sources being the Gallup surveys (Gallup World Poll) focusing on the quality of life.
The World Happiness Report report on 201657, according to national scores of population happiness, as average of the period 2013-2015, witnessed on the global hierarchy top countries as Denmark, Switzerland and Iceland (scores between 7501 and 7526), Romania hovering barely the 71 position (score: 5528). Almost surprising appears the poor positions of Japan (53rd), South Korea (58th), Hungary (91th), Portugal (94th), Greece (99th), explained mainly by the unequal distribution of wealth and the determinants of the life quality, despite much higher levels of such positions in terms of GDP per capita at PPP.
The result of an inter-collaborative research project initiated in 2010 by several global leaders in social sciences, gathered in the multinational foundation Social Progress Imperative, which has gained increasing recognition from the scientific and international institutions, materialized in the development of the Social Progress Index (SPI). This composite indicator, constructed by the aggregation of 54 indicators, focuses on three dimensions of wellbeing e.g. the covering of basic human needs (food, water, shelter, safety), the access to wellbeing fundamentals (education, information, health, environment) and the opportunities for achieving individual goals and aspirations (rights, freedom of choice, freedom from discrimination and access to the most advanced information).
The Social Progress Index was redesigned in 2015 by Eurostat for the EU regions (NUTS2) focusing on the same three dimensions and including all twelve components. The composite index of regional EU-SPI is built on a set of 50 indicators (differing from the ones of the original SPI), according to the criterion of time series availability and the reliability of data sources. The purpose of building this indicator is to ease the assessment of how the targets of policies and programs pursued by the European Commission for 2014-2020 are
56
The GNH (Gross National Happiness) has a philosophical inspiration, containing many elements of spiritual, ethic and cultural nature.
57
25
achieved, in particular those relating to social and territorial cohesion, helping regions to identify and take best practices from other regions with similar levels of development. The publication of the final version of the EU-SPI for the 272 EU regions is foreseen by the end of 201658.
Following an analysis of the conceptual framework of wellbeing and the integrated approach to its multidimensional aspects, a group of Eurostat experts proposed in 2009 a methodology for calculating a composite indicator of wellbeing, called satisfied life expectancy, based on the concept of happy life expectancy introduced in 1996 by Ruut Veenhoven59, professor emeritus at the Erasmus University of Rotterdam.
The Eurostat experts recommended also a set of 44 indicators of wellbeing, grouped into five components, concerning psychological needs, security-safety, individual and relational activities, skills and self-confidence60.
As previously mentioned, at OECD level, more than a decade ago, researches on the measurement of wellbeing and progress have started, developing a methodological framework, updated in 2011 by the launch of the Better Life Initiative, that focuses more on aspects of life that are considered essential by citizens, as well as improving the information base, in a manner to enable a better understanding of welfare and its determinants trends, including for structuring the related policies. The framework of measurement the individual wellbeing is built on two dimensions (the quality of life, with eight areas, and the material conditions, with three areas) having associated more than 30 indicators, attempting also an evaluation of capital resources (natural, economic, human and social) needed to ensure the sustainability of improving the wellbeing of citizens.
The report for 2015 stated that, despite the progress of the OECD average compared with the crisis year 2009, in some countries (Spain, Portugal, Italy, Greece) several pressure factors on material conditions and quality of life have been felt, due to the decrease in real income of households, high unemployment and limited housing access. Also, an increase in the disparities, including at regional levels, has been revealed by many indicators (income distribution, access to services, employment opportunities, personal security, air pollution), which is affecting the resources for future improvements of wellbeing61.
In conclusion, despite many attempts to address the deficiencies of GDP, by methodological updating, using complementary indicators or substituting it with the composite or alternative indexes, of which those that seemed more relevant were presented in this chapter, one can say that, at least so far, the
58
European Commission, The EU Regional Social Progress Index: Methodological Note, EC, DG Regio, Economic Analysis Unit, Brussels, 2015, p. 3.
59
R. Veenhoven, Happy Life-Expectancy. A Comprehensive Measure of Quality-of-Life in Nations, Social Indicators Research, Vol. 39, 1996, Springer, pp. 1-58.
60
Eurostat, Feasibility Study for Well-Being Indicators. Task 4: Critical review, European Commission, 2009, pp. 33-40.
61