Munich Personal RePEc Archive
Generational Differences at Work in
Spain
Lasierra, Jose Manuel and Molina, Jose Alberto and Ortega,
Raquel
University of Zaragoza (Spain), University of Zaragoza (Spain) and
IZA (Germany), University of Zaragoza (Spain)
3 June 2015
Online at
https://mpra.ub.uni-muenchen.de/64768/
1. Introduction
In the research on job satisfaction and work organization, the age variable is normally included as an important factor in work performance and in the degree of job satisfaction. This hypothesis is based on the fact that the life cycle and its economic, social, and biological determining factors all have a clear impact on job satisfaction. We believe, however, that these economic, social, and demographic differences serve, in fact, to differentiate social groups. Furthermore, the differences between these
generational groups persist over time and do not simply correspond to the various phases that individuals go through over their working lives. Thus, these economic and social factors lead to differences in individual attitudes towards work and the way in which these attitudes are displayed (see Lyons and Kuron, 2014, for an updated survey on generational differences in the workplace; and see Molina, 2015, and Giménez-Nadal et al., 2013, for recent evidence on the work-life balance).
This paper aims to analyse generational differences in the organization of work and individual job satisfaction. Our starting point is the fact that differences between generations are shaped by certain values, the prevailing economic model, and the circumstances in which each social group lives. We maintain that these differences reach far beyond the normal processes that individuals go through in their life cycle, from youth to old age (Smola and Sutton, 2002).
In the case of Spain, two generations can be found from the mid-1950s to the 1990s: the Baby boomers, born between 1950 and 1970 (Baby boomers) and Generation X, born between 1970 and 1990 (Xers). It does not take much analysis of the past 50 years of Spain’s social and economic history to observe marked differences between these two generations in terms of the way they relate to work and workplace interactions. In research from Europe and the United States, the Babyboomer Generation is considered to begin at the end of the 1940s and end before the 1970s. In Spain, the demographic expansion came a bit later, as we indicated above.
dependent on foreign investment for its growth. In sociological terms, Spain’s customs were decidedly traditional and very much tied to the Roman Catholic Church. At the same time, class differences were highly pronounced, while work culture and training remained poor. Politically, there was a dictatorship under which, in terms of labour, job stability came in exchange for the absence of freedom for trade unions. In short, the country was highly underdeveloped economically, politically and socially, compared to other European countries.
Those born during the 1970s, and joining the workforce at the end of the 1980s, were to find a service-based country, open to the world and modern in its customs as well as both its social and personal relationships, with income levels that had increased significantly relative to the rest of Europe. Are these social and economic conditions determining factors in marking behavioural differences between different generations in the workplace?
The interest of this research lies first and foremost in the fact that, if there are truly differences between generations, then developing the same human resources and organizational policies for groups with different characteristics may trigger two different kinds of problem. First, if the social, cultural, and labour value systems of the two generations are different, then the same personnel policies, applied to both, could generate conflicts between the two groups, pitting the old against the young, to put it
simply. Second, certain psychological theories (Homer and Kahle, 1988) establish a hierarchy between values, attitudes, and behaviour. It would stand to reason that personnel policies should therefore be conscious of this sequence. Thus, for instance, if one group prefers free time to higher salaries, then salary incentives that involve reducing free time may not be very effective in terms of behaviour at work. Thus, not taking into account the mindset of each generation could lead to applying incongruous, relatively ineffectual, and even conflictive personnel management policies. Third, if different generations actually do behave differently, then personnel policy should take into account that values considered positive for one group do not have the same force for the other. An additional interest of this research ties in to these issues and lies in the
extension of working life in countries with an ageing workforce, specifically in Spain where the two generations will often find themselves working together.
el Trabajo - ECVT) from the years 2006 to 2010. The research that we examined published in the overseas literature uses smaller samples, predominantly from the public sector. In this paper, we refer only to salaried workers in the private sector. Furthermore, we have found no research on differences between generations at work in Spain, which makes this research, to the best of our knowledge, the first of its kind.
This article includes an introduction, where we first refer to Spain’s recent past, both social and political, to justify the research. This is accompanied by our motivations, grounded on a review of the current literature. We then establish our assumptions, elaborated in an explanatory model. Next, we present and analyse our results, and based on this analysis, we identify consequences for personnel management policy. Finally, we summarize our work, indicate our limitations, and briefly present potential avenues for future research.
2. Review of the Literature
The first issue addressed in the literature involves the existence and demarcation of two or more possible generations. Various authors provide indications of differences between generations. Sociologists, such as McMullin, et al. (2007) insist that individual attitudes and values stem from the economic, social, and political situations they have experienced. Schuman and Scott (1989) maintain that these differences can be observed based on selective memory of certain events that lead, not only to different individual attitudes, but also to different collective values.
These generational differences can be observed in a broad variety of social aspects such as family structure (Gans and Silverstein, 2006, and Alwin, 1990); social movements (Alwin and Krosnick, 1991); and cultural changes, such as the adoption of Western values in Asian countries (Hui-Chun and Miller, 2005). These differences even include biographical transformations, such as the breakage in Maslow’s hierarchy of needs, where it can be found that Generation X compresses and merges certain phases that the Baby boomers clearly differentiate (Shu, 1998). In the sphere of economics, major differences can be perceived in consumption and marketing (Yankelovich, 2000, Roberts and Manolis, 2000).
related to motivating factors at work. He does, however, find certain significant differences. Wallace (2006) found relatively insignificant differences, while Giancola (2006) speaks of these differences as more of a myth than a reality.
Other authors consider generational differences at work to be a reality. Smola and Sutton (2002) point to values at work being more heavily influenced by generational experiences than by age or maturity. They find, for instance, that as one ages, one idealizes work less. However, paradoxically, the X Generation initially approaches work with a less idealized vision Xers do not envisage a job for life in any given company, nor do they feel particularly committed to their employer. In addition, the Xers have had no chance to become “disenchanted”, so their attitude must therefore be one of a work situation perceived differently from that of the Baby boomers, with the possibility that attitudes are tainted by having analysed what happened to many boomers who gave their all to their employers, only to be given the sack. We believe, nevertheless that hard work and enjoyment of leisure are two variables that do, in principle, appear to set the two generations apart. From the very outset of their careers, the Xers seek to strike a balance between work and leisure. It could be said that they have ‘a life’ outside work, which is not as common among Baby boomers. This often shows its crude face upon retirement. Generally speaking, work played a relatively central role in Baby boomers’ lives. Regarding gender, we believe that that transformation in labour is clearly reflected in the difference between generations in terms of women being more present in the workforce, and that it is therefore a variable
to consider (Benson and Brown, 2011; Eckman, 2004). In Job Satisfaction (JS) studies, what is also observed is that women are generally more satisfied than men (Lydon and Chevalier, 2002; Sloane and Williams, 2000).
satisfaction (Sloane and Williams, 2000, Clark and Oswald, 1996, Groot and Massen, 1999). However, in Lasierra (2012) we observe that greater importance is attached to employer-employee relations and personal relationships at work, and in terms of the size of the company, a recognized factor in Job Satisfaction, according to Lydon and Chevalier (2002), we are unable to establish any hypothesis a priori.
With respect to Job Satisfaction and Identification with the Company, the variables marking our generational differences, Appelbaum et al. (2005) find the Xers to be less satisfied at work and to identify less with their companies than the Baby boomers. Daboval (1998) obtains the same result, while Benson and Brown (2011) observe few generational differences in terms of the level of commitment or identification, although they do perceive a greater level of job satisfaction among Baby boomers. Hui and Miller (2005) highlight that the Xers are more concerned about their profession than about their employer, and rather than advancing in the company, they prefer opportunities for further training.
Regarding leadership styles, Hui and Miller (2005) make an interesting contribution that is relatively close to our initial reflections. Their rationale regarding the productive system is that the productive structure determines organization systems. In these authors’ opinion, the Boomers adopt a type of leadership corresponding to the X leadership theory, while the Xers’s type of leadership corresponds to that of the Y leadership theory.
To put it concisely, the X leadership and work management theory corresponds to
the industrial economy. That is to say, it is a productive system of rather large companies, where technical changes take time and work management requires both supervision and monitoring. The Y theory applies in a service-based economy where interpersonal communication prevails, together with customer service and conflict resolution.
company is to be challenged, remunerated, and provided with freedom to undertake initiatives.
The Boomers, born in an industrial economy, have had to adapt to the service economy, and now again to the new knowledge-based economy, while the Xers never knew the industrial economy. Management styles have adapted to the various generational aspirations, and yet in their research, Hui and Miller (2005) observe that labour characteristics (values, attitudes, and expectations) vary from one sector and occupation to the next, as they do from one generation to the next. Observing both the education sector and a branch of the industrial sector, they find no appreciable differences between generations in education, while clear distinctions appear in industry. These authors conclude that workers’ labour characteristics are heavily marked by the sector. Following Hui and Miller (2005), we venture to say that it may be specific occupations themselves, rather than the sector, that lead to these differences. In other words, for instance, an accountant in an industrial company will behave more like an accountant in a service company in his or her dealings at work, while a secondary school teacher’s behaviour is clearly distinct from that of an industrial or even a white-collar worker. This leads us to postulate that if management styles should take into account both the company’s productive structure and its sector or branch, they should also take into account differences between generations. This is what we will pursue, without going further into other variables related to the productive structure. We believe that human resource policies currently pay scant attention to both these
issues, the productive structure and generational factors, and we contend that they have a significant bearing on both job satisfaction and worker identification with the company. Finally, Benson and Brown (2011) observe that personal relations and co-worker support, are both very much linked to job satisfaction and co-worker motivation.
3. Methodology: hypotheses and explanatory model
Our methodology first include our hypotheses, which are underpinned by the notion that the characteristics and circumstances in an individual’s social and economic environment shape the way in which he or she conceives of life and determines his or her behaviour at work. Our first general hypothesis is, therefore, that there are real and substantial differences between the two generations examined in this research.
conditions, but they also appear in certain personal variables that impact a worker’s motivations and identification with the company. Our analysis attempts to study the differences in these two variables, job satisfaction and identification with work, between the two generations.
Based on the existing literature, this general notion hinges on the following hypotheses:
A.1. Job Satisfaction is greater among Baby boomers than among Xers.
A.2. Worker identification with the job and the company is greater among Baby boomers than among Xers.
B.1. Salary and benefits are more important to job satisfaction and for identifying with the company among Xers than among Baby boomers.
B.2. Aspects related to work organization and working time impact job satisfaction and identification with work more among Xers than among Baby boomers.
B.3. The atmosphere at work and social and human relations (that is to say, work relationships in the company) have a more positive impact on job satisfaction and worker identification among Baby boomers than among Xers.
In short, these hypotheses convey the idea that Baby boomers’ idea of work and the company is less materialistic and instrumental than that of the Xers. For Baby boomers, work is not merely a means of obtaining income in order to develop a more satisfactory life, as the simplified version of the vision held by the Xers would have it.
The model establishes two dependent differentiating variables on behaviour in the
two generations (Kinicki et al, 2002; Benson and Brown, 2011). The first variable is
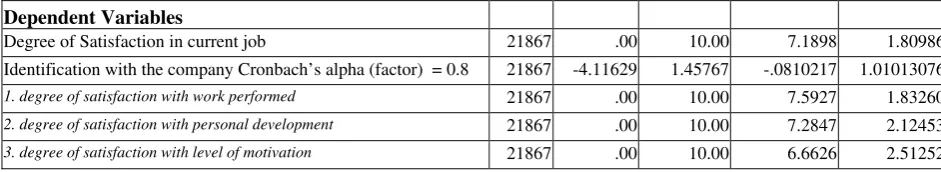
Job Satisfaction (JS) measured by a subjective question. The second is Worker Identification with the company, a factor obtained from three variables and also measured by a subjective question (Kanungo, 1982), Lasierra, 2007, 2012, Iverson and Buttigieg, 1999). Aspects such as the degree of satisfaction that the individual’s job generates, its contribution to his or her personal development, and the degree to which it generates a feeling of being favourably disposed towards the company (which we equate with Identification with the company) are all involved in the second variable. These ideas appear in the questionnaire in three different questions. An Analysis of the Main Components is then used to obtain the Identification factor, with a 0.8 alpha for reliability on the Cronbach scale.
Both variables are broadly correlated, but we believe they measure different aspects that may be pertinent (Kupperschmidt, 2000). Generally, as indicated in Lasierra (2012), development of JS is normally considered significant by the majority of individuals, making it advisable to examine other variables. Regarding the independent variables, we include six groups of , a descriptive table, including demographic and professional issues, work relations in the company, working time, and both remuneration and benefits.
Our data comes from the ECVT survey for the years 2006-2010, referring only to salaried workers in the private sector. Our aim when selecting salaried workers in the private sector is to work with the most homogeneous sub-sample possible, so that the independent variables selected could better show their impact on the generational aspect of the research. We therefore exclude other types of worker, such as the self-employed or public workers, whom we consider to have some labour characteristics that are clearly different from workers in the private sector. The existing literature does not purge samples to obtain the most homogeneous groups possible, which would enable us to most efficiently measure the impact of independent variables.
We also point to the fact that prior research has shown that there are no significant differences in the responses for each of the five years under consideration. Thus, in order to obtain a broad sample to which different cut-offs can be applied, we consider the pool data, which allowed us to obtain a sample of 21,867 individuals, of which 9,366 were baby boomers and 12,501 Xers (Table 2). This aggregation of the five years
of data is also justified by that fact that the cut-off for classifying individuals as Baby boomers (between the ages of 43 and 60) or Xers (between the ages of 25 and 42) is approximate and corresponds to the existing literature. We therefore believe, and have verified, that lumping together these five years produces no significant changes between the two generations.
(Table 2 about here)
4. Empirical results
job promotion than do the Baby boomers, although in the overall sample, this variable affects only around 4,000 of the 21,867 examined. Finally, Xers maintain better relations with workers at their own level, overall, than do Baby boomers, although not with managers. In the remaining variables, the Baby boomers have higher averages. What draws our attention in this first analysis is that, despite having a higher level of education and better occupations, the Xers’ average net monthly incomes are below those of the Baby boomers.
By applying the T-test for Equality of Means for independent variables, what can first be observed is that the Baby boomers and Xers are indeed two clearly distinct groups. In the Levene test, only 11 of the 28 variables lack statistically significant differences, while in bilateral significance these non-significant variables appear in a maximum of 7.
(Table 3 about here)
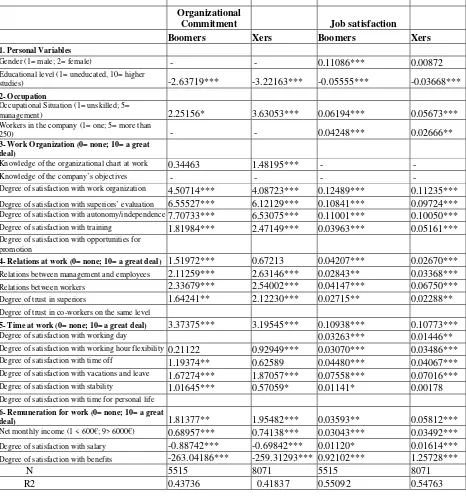
We then use the STATA program to run four linear regressions, two per group, with the dependent variables, job satisfaction, and with the Identification with the company factor. The salient results of these four regressions (Table 4) are:
1. Job Satisfaction, Baby boomers: The overall model attained 55% reliability. The other three regressions have a slightly lower R2, but are also high. Only two variables, both related to knowledge of work organization, do not appear to be significant.
2. Identification with the company, Boomers: Gender, company size, two
variables related to knowledge of aspects of the company, and one variable related to working time appear to be non-significant. Level of education and satisfaction with benefits appear with a negative sign.
3. Job Satisfaction, Xers: We find the same two variables related to organizational aspects, in addition to gender and degree of satisfaction with time available for one’s personal life to be non-significant.
4. Identification with the company, Xers: Gender, company size, one of the variables related to work organization, and another related to working time, appear to be non-significant.
have strong data in the descriptive analysis and in the T-test of equality of measurements. Generally, we can say that the data backs up hypothesis B1, that is, that Xers value remuneration more than do Boomers, both in terms of job satisfaction and in terms of identification with the company. We do however find variables in work organization and in work relations to which one generation attaches more importance than the other. Here, job satisfaction and identification at work are not the same. A more in-depth analysis would need to be done on each of the variables in both of these groups.
6. Regarding hypothesis B2, on working time, there are three variables: satisfaction with the working day, vacations and leave, and satisfaction with free time for one’s personal life, where the Xers scored higher coefficients than the Baby boomers.
(Table 4 about here)
In all cases, Educational Level is tied to unexpected behaviour in that the higher the level of education, the lower the level of Satisfaction. The remaining variables scored positive, with the exception of Satisfaction with benefits as a means of attaining Worker Identification. The level of education scored negative, which is ostensibly contradictory. This was also observed by Benson and Brown (2011), whose interpretation is that the higher the level of education, the greater the mobility, leading workers to identify less with the company. The higher the level of education, they observed, the less job satisfaction. We are not as certain of this in Spain, where the
market is more rigid because of higher unemployment. We believe that there may be a certain factor of over-qualification vis-à-vis the tasks and salary perceived, and this would lead to a certain degree of frustration.
Regarding the Job Satisfaction variable, there are two variables that are not significant for either of our two generations: knowledge of the company organizational chart, and knowledge of its business goals, both of which can be linked to modern management techniques. Interestingly, and this would reassert the theses put forward in the literature, one of these two variables is significant for Worker Identification with the company in the Xer generation, which had a high coefficient. This is something that we pointed to in Lasierra (2012) and that could justify the job turnover in work management.
as it did in the past, when the literature on job satisfaction indicated greater job satisfaction among women. Today, the feelings of men and women are perhaps converging.
The variables related to work organization and relations with co-workers and managers, which are soft variables, relative to the hard variable of salary, generally seem to be significant in the four regressions. Here we would highlight that Training is valued more by Xers than by Baby boomers in the two dependent variables, and this is in line with the existing literature.
Regarding remuneration, average net income is significant for both identification and Job Satisfaction, for both Boomers and Xers. Net monthly income is significant for Identification and Job Satisfaction for Baby boomers and Xers alike. The same occurs with the subjective variable Satisfaction with salary. Both of these variables have higher coefficients among Xers than among Baby boomers, which supports the hypothesis that Xers attach more value to salary than to the work itself. Benefits do not actually contribute to Job Identification, although they do have a positive bearing on Job Satisfaction. Insofar as worker identification is concerned, this result appears to contradict the rationale behind remuneration systems that considers that these practices, irrespective of ordinary salary, have a significant substitution effect that stimulates employee performance.
Finally, we observe that variables related to working time are important to job satisfaction and also to identification for both generations, although they are more
important in Job Satisfaction than in Identification, and weigh more heavily for Baby boomers than for Xers. This is probably because the Xers do not enjoy the best conditions in terms of benefits, although their occupations are better. This is in line with the existing literature, according to which the Xers are less united with their companies and are more committed to what they do, that is, to their occupations. Coefficients for the variable Occupation, which are higher among Xers than among Boomers in regressions for identification with the company, could confirm this conjecture.
feel less satisfied and motivated by the working day, flexibility in working hours, vacations and leave, and ‘personal’ time for than do Baby boomers.
5. Policy implications
The implications for management that we draw from this are the following. Regarding work organization, Xers attach value to knowledge of the company organizational chart. As a result, providing knowledge of these issues may constitute a significant tool for generating commitment among young workers, i.e. the Xers, and improving their performance. Management techniques in high-performance organizations, and particularly job rotation policies, are in line with this idea.
While salary, as a hard variable, serves to encourage worker involvement, there are other, more important variables. Soft variables, such as employer-employee relations and good work atmosphere (meaning good relations with co-workers and management, and a climate of confidence in one’s superiors) together with salary policy, meaning equity in salary, which would be reflected by the Satisfaction with salary variable, should be kept in mind as instruments for human resource management. These results can also be found in some of the existing research, such as Benson and Brown (2011) and Lasierra (2012).
The variables related to working time, and specifically to work hours and stability, appear to be the most important of the four regressions. Insofar as the working day is concerned, for some time now, a process of work intensification has been observed,
brought about by extending working hours, which may or may not follow the appropriate labour legislation, and by making working hours more flexible (extensive work intensification). In recent research, Brown (2012) indicates that this work intensification process is leading to a decline in Job Satisfaction in both generations. Certain of our variables come out to be not at all, or not very, significant, particularly those related to Identification with the company. Aspects related to using working time as a management tool should therefore be carefully thought out. Another issue stemming from this result is how to provide stability. Should it be through a ‘private’ contract or through protective labour legislation? To put this differently, one could ask whether a deregulated labour market leads to labour stability, or whether labour stability is lacking and arbitrary in that scenario.
particularly when it comes to knowledge of the company, in the case of the Xers. These aspects have great significance in light of the highly competitive environment in which companies now operate.
6. Summary, limitations and expansion of the research
A brief social and economic reflection on the labour situation in Spain prompted us to carry out this research on differences between the two generations in work-place behaviour. In our research, the initial sample was reduced to a subsample of the most homogeneous individuals in terms of their labour characteristics. (For example, we excluded public employees.) Subsequently, the T-test of equality of measurements resoundingly corroborated this procedure. The multivariate analysis based on two variables around which to centre the differences, Job Satisfaction and Identification with the company, yielded finer results from these two groups.
As a result, knowledge of the company’s organization (its objectives and organizational chart), its remuneration system, and personal or human relationships within the company, together with job stability, are some of the concepts that appear to be relevant in this analysis of generational differences. Xers attach more of value to salary and availability of time for their personal lives than do boomers, as indicated in our hypotheses. Baby boomers attach less weight to these factors, which leads us to believe that they find somewhat more in what the work itself provides for them and in human relations on the job.
Furthermore, more traditional behaviour is observed in work relations with the Baby boomers, compared to the Xers, particularly regarding aspects related to knowledge of the company’s organizational chart. Improvements in this area could foster a more active attitude on the part of workers in companies and thereby reinvigorate the labour factor as a tool for competitiveness, along the lines practices in high-performance organizations.
labour economy in Spain, a qualitative complement that has indeed been used very little, could be highly illustrative in this regard.
Another further avenue for research would be the observation of these generational differences during expansive cycles and during times of crisis, and the inclusion and examination of any additional generations that may arise.
References:
Alwin, D. (1990), “Cohort Replacement and Changes in Parental Socialization Value”,
Journal of Marriage and Family, Vol. 52, pp. 347–360.
Alwin, D., & Krosnick, J. (1991), “Aging, Cohorts, and the Stability of Sociopolitical
Over the Life Span”, The American Journal of Sociology, Vol. 97, pp. 169–195.
Appelbaum, S., Serena, M., and Shapiro, B. (2005), “Generation “X” and the Boomers:
An Analysis of Realities and Myths”, Management Research News, Vol. 28, pp. 1–
33.
Arsenault, P.M. (2004), “Validating Generational Differences: A Legitimate Diversity
and Leadership Issue”, The Leadership and Organization Development Journal,
Vol. 25, pp. 124–141.
Benson, J. & Brown, M.(2011), “Generations at work: are there differences and do they
matter?”, The International Journal of Human Resource Management, Vol. 22, pp.
1843-1865
Brown, M.(2012), “Responses to work intensification: does generation matter?”, The
International Journal of Human Resource Management, Vol. 23, pp. 3578-3595.
Clark, A.E. & A.J. Oswald (1996), “Satisfaction and comparison income”, Journal of
Public Economics, Vol. 61, pp. 359–381.
Clark, A.E. (1997), “Job satisfaction and gender: Why are women so happy at work?”,
Daboval, J. (1998), “A Comparison Between Baby Boomers and Generation X
Employees”, Bases and Foci of Commitment. Doctoral dissertation, Nova South
Eastern University, Fort Lauderdale, FL.
Eckman, E. (2004), “Similarities and Differences in Role Conflict, Role Commitment
and Job Satisfaction for Female and Male High School Principals”, Educational
Administration Quarterly, Vol. 40, pp. 366–387.
Gans, D., & Silverstein, M. (2006), “Norms of Filial Responsibility for Aging Parents
Across Time and Generations”, Journal of Marriage and Family, Vol. 68, pp. 961–
976.
Giancola, F. (2006), “The Generation Gap: More Myth than Reality”, Human
Resource Planning, Vol. 29, pp. 32–37.
Giménez-Nadal, J.I., Molina, J.A. & Ortega, R. (2012), “Self-employed mothers and
the work-family conflict”, Applied Economics, Vol. 44, pp. 2133-2148.
Groot, W. & Massen, H. (1999), “Job satisfaction of older workers”, International
Journal of Manpower, Vol. 20, pp. 343-360.
Homer, P.M. & Kahle, L.R. (1988), “A Structural Equation Test of the
Value-Attitude-Behavior Hierarchy”, Journal of Personality Social Psychology, 54, pp. 638–646
Hui-Chun Yu, & Miller, P. (2005), “Leadership style: The X Generation and Baby
Boomers compared in different cultural contexts”, Leadership & Organization
Development Journal, Vol. 26, pp. 35 – 50
Iverson, R., & Buttigieg, D. (1999), “Affective, Normative and Continuance
Commitment: Can the ‘Right Kind’ of Commitment be Managed?”, Journal of
Management Studies, Vol. 36, pp. 307–333.
Jorgensen, B. (2003), “Baby Boomers, Generation X and Generation Y: Policy
Jurkiewicz, C. (2000), “Generation X and the Public Employee”, Public Personnel
Management, Vol. 29, pp. 55–74.
Kanungo, R. (1982), “Measurement of Job and Work Involvement”, Journal of
Applied Psychology, Vol. 67, pp. 341–351.
Kinicki, A., McKee-Ryan, F., Schriesheim, C., Carson, K. (2002), “Assessing the
Construct Validity of the Job Descriptive Index: A Review and Meta-analysis”,
Journal of Applied Psychology, Vol. 87, pp. 14–32
Kupperschmidt, B. (2000), “Multigeneration Employees: Strategies for Effective
Management”, Health Care Manager, Vol. 19, pp. 65–76.
Lasierra, J.M. (2007), “Labour flexibility and Job market segmentation in Spain: A
perspective from the labour demand side”, The International Journal of Human
Resource Management, Vol. 18, pp. 1858-1880.
Lasierra, J.M. (2012), “Determinants of work organization in the modern firm: Change
and continuity in the Spanish labour relations”, The International Journal of
Human Resource Management, Vol. 23, pp. 71-90.
Lydon, R. & Chevalier, R. (2002), “Estimates of the effect of wages on job
satisfaction”, CEP-LSE Discusión Papers, 0531
Lyons, S. & Kuron, L. (2014), “Generational differences in the workplace: a review of
the evidence and directions for future research”, Journal of Organizational Behavior,
Vol. 35, pp. S139-S157.
McMullin, J., Comeau, T., Jovic, W. (2007), “Generational Affinities and Discourses
of Difference: A Case Study of Highly Skilled Information Technology Workers”,
British Journal of Sociology, Vol. 58, pp. 297–316.
Molina, J.A. (2015), “Caring within the family: reconciling work and family life”,
Roberts, J., & Manolis, C. (2000), “Baby Boomers and Busters: An Exploratory
Investigation of Attitudes towards Marketing, Advertising and Consumerism”,
Journal of Consumer Marketing, Vol. 17, pp. 481–499
Schuman, H., & Scott, J. (1989), “Generations and Collective Memories”, American
Sociological Review, Vol. 54, pp. 359–381
Shu, S.Y. (1998), The Influence of Managers' Leadership Styles on Job Satisfaction
and Organizational Commitment of Different Generation Cohorts, Master Thesis,
Tatung University, Taiwan. (in Chinese)
Sirias, D., Karp, H.B., Brotherton, T. (2007), “Comparing the levels of indiviudulism
and collectivism between boomers and genration X: Implications for teamwork”,
Management Research News, Vol. 30, pp. 849-861.
Sloane, P. & Williams, H. (2000), “Job satisfaction, comparison earnings and gender”,
Labour, Vol. 14, pp. 473-501.
Smith, T. (2007), “Job Satisfaction in the United States”, Working Paper, National
Opinion Research Centre, University of Chicago, April 17.
Smola, K. W. & Sutton, Ch. D. (2002), “Generational differences: revisiting
generational work values for the new millennium”, Journal of Organizational
Behavior, Vol. 23, pp. 363–382
Wallace, J. (2006), “Work Commitment in the Legal Profession: A Study of Baby
Boomers and Generation Xers”, International Journal of the Legal Profession, Vol.
13, pp. 137–151.
Table 1. Analysis of Main Components
Dependent Variables
Degree of Satisfaction in current job 21867 .00 10.00 7.1898 1.80986
Identification with the company Cronbach’s alpha (factor) = 0.8 21867 -4.11629 1.45767 -.0810217 1.01013076
1. degree of satisfaction with work performed 21867 .00 10.00 7.5927 1.83260
2. degree of satisfaction with personal development 21867 .00 10.00 7.2847 2.12453
Table 2. Descriptive Summary and Impact Hypotheses Variables and impact hypotheses of one generation over
another
Impact Hypotheses (< , > o =) according to the literature, between Boomers & Xers
Independent Variables N Min Max Mean Std. Dev.
1. Personal Variables
Gender (1= male; 2= female) 21867 1,00 2,00 1,4080 ,49147 Xers>Boomers (Benson &Brown,
2011;Eckman,2004, Lydon y Chevalier, 2002; Clark, 1997)
Educational level (1= uneducated, 10= higher studies) 21867 1,00 10,00 5,4449 2,08936 Xers>Boomers (Benson & Brown,2011; Iverson & Buttigieg, 1999, Camilleri, 2002)
2- Occupation
Workers in the company (1= one; 5= more than 250) 21867 1,00 5,00 3,4769 1,22937
Boomers=Xers, (Lydon y Chevalier, 2002)
Occupational Situation (1= unskilled; 5= management) 21866 1,00 5,00 2,2293 1,03495 Boomers>Xers. (Rose, 2003; Smith 2007)
3- Work Organization (0= none; 10= a great deal)
Knowledge of the organizational chart at work 21867 ,00 10,00 7,0107 2,83969
Boomers>Xers (Appelbaum et al. 2005) Knowledge of the company’s objectives 21867 ,00 10,00 6,9727 2,89078
Boomers>Xers (Appelbaum et al. 2005) Degree of satisfaction with work organization 21867 ,00 10,00 6,7986 2,30134
Boomers>Xers, (Appelbaum et al. 2005)
Degree of satisfaction with superiors’ evaluation 21041 ,00 10,00 7,0279 2,31830 Boomers=Xers (Appelbaum et al. 2005) Degree of satisfaction with autonomy/independence 21867 ,00 10,00 7,2010 2,31519
Xers>Boomers, (Jurkiewicz ,2000) Degree of satisfaction with training 17053 ,00 10,00 5,5029 3,25954
Xers>Boomers, (Sirias et al 2007) Degree of satisfaction with opportunities for promotion 4062 ,00 10,00 5,0911 3,21143
Xers>Boomers (Price & Mueller, 1981)
4- Relations at work (0= none; 10= a great deal)
Relations between management and employees
20961 ,00 10,00 7,0377 2,34049 Boomers=Xers (House 1981; Benson &Brown,2011; Appelbaum et al. 2005)
Relations between workers
20587 ,00 10,00 7,9006 1,78252 Boomers=Xers (House 1981, Benson &Brown,2011, Appelbaum et al. 2005)
Degree of trust in superiors
16698 ,00 10,00 7,0291 2,47851 Boomers=Xers (House 1981, Benson &Brown,2011, Appelbaum et al. 2005)
Degree of trust in co-workers on the same level
16081 ,00 10,00 7,7995 1,91965 Boomers=Xers (House 1981, Benson &Brown,2011, Appelbaum et al. 2005)
5- Time at work (0= none; 10= a great deal)
Degree of satisfaction with working day 21867 ,00 10,00 6,9523 2,29585
Xers>Boomers (Smola &Sutton, 2002) Degree of satisfaction with working hour flexibility 21867 ,00 10,00 6,2378 3,05293
Xers>Boomers (Smola &Sutton, 2002) Degree of satisfaction with time off 21867 ,00 10,00 6,4487 2,72541
Xers>Boomers (Smola &Sutton, 2002) Degree of satisfaction with vacations and leave 21867 ,00 10,00 7,2041 2,45311
Xers>Boomers (Smola &Sutton, 2002) Degree of satisfaction with stability 21867 ,00 10,00 7,2074 2,54095
Boomers>Xers (Meyer &Allen, 1997) Degree of satisfaction with time for personal life 21867 ,00 10,00 6,2236 2,46342
Xers>Boomers, (Smola &Sutton, 2002)
6- Remuneration for work (0= none; 10= a great deal)
Net monthly income (1 < 600€; 9> 6000€) 21867 1,00 9,00 3,1567 1,39679 Boomers=Xers ( Morris et al. 1993 Clark & Oswald , 1996)
Degree of satisfaction with salary
21800 ,00 10,00 5,9316 2,28403 Boomers=Xers ( Morris et al. 1993 Clark & Oswald , 1996)
Degree of satisfaction with benefits
Table 3. Test for Equality of Means
Statistics of the Group Levene’s
test T equality of the
means
AgeBoomers N Media F Sig t gl. Sig.
Bilateral
Gender Boomers 43- 9366 1,3716 361,993 ,000 -9,502 21865 ,000
Xers 25-42 12501 1,4352 -9,537 20437,828 ,000
Educational level Boomers 43- 9366 4,9805 9,972 ,002 -28,991 21865 ,000
Xers 25-42 12501 5,7928 -28,883 19885,508 ,000
Occupational Situation (1= unskilled; 5= management)
Boomers 43- 9365 2,1717 36,360 ,000 -7,132 21864 ,000
Xers 25-42 12501 2,2725 -7,136 20220,922 ,000
Workers in the company (1= one; 5= more than 250)
Boomers 43- 9366 3,4727 2,742 ,098 -,439 21865 ,661
Xers 25-42 12501 3,4800 -,438 20016,563 ,661
Degree of job satisfaction Boomers 43- 9366 7,2720 16,423 ,000 5,822 21865 ,000
Xers 25-42 12501 7,1281 5,799 19865,087 ,000
Degree of satisfaction with work organization
Boomers 43- 9366 6,9287 2,973 ,085 7,241 21865 ,000
Xers 25-42 12501 6,7012 7,240 20167,089 ,000
Knowledge of the organizational chart at work
Boomers 43- 9366 6,9789 29,213 ,000 -1,435 21865 ,151
Xers 25-42 12501 7,0346 -1,424 19564,926 ,154
Knowledge of the company’s objectives
Boomers 43- 9366 6,9016 70,421 ,000 -3,149 21865 ,002
Xers 25-42 12501 7,0259 -3,117 19377,667 ,002
Degree of satisfaction with opportunities for promotion
Boomers 43- 1771 4,8052 10,089 ,002 -5,003 4060 ,000
Xers 25-42 2291 5,3121 -4,976 3723,128 ,000
Degree of satisfaction with superiors’ evaluation
Boomers 43- 8908 7,0857 5,531 ,019 3,100 21039 ,002
Xers 25-42 12133 6,9854 3,087 18895,182 ,002
Degree of satisfaction working activities
Boomers 43- 9366 7,6640 1,347 ,246 4,984 21865 ,000
Xers 25-42 12501 7,5392 4,986 20194,626 ,000
Degree of saisfaction with personal development
Boomers 43- 9366 7,3968 ,405 ,525 6,759 21865 ,000
Xers 25-42 12501 7,2007 6,769 20277,331 ,000
Degree of satisfaction with autonomy/independence
Boomers 43- 9366 7,2953 1,311 ,252 5,219 21865 ,000
Xers 25-42 12501 7,1303 5,214 20110,597 ,000
Degree of satisfaction with level of motivation
Boomers 43- 9366 6,6745 8,505 ,004 ,602 21865 ,547
Xers 25-42 12501 6,6538 ,599 19824,913 ,549
Relations between management and employees
Boomers 43- 8879 7,1136 1,033 ,309 4,029 20959 ,000
Xers 25-42 12082 6,9819 4,038 19276,579 ,000
Relations between workers Boomers 43- 8714 7,8436 12,790 ,000 -3,931 20585 ,000
Xers 25-42 11873 7,9424 -3,915 18486,723 ,000
Degree of satisfaction with working day
Boomers 43- 9366 7,0680 16,504 ,000 6,460 21865 ,000
Xers 25-42 12501 6,8655 6,490 20505,117 ,000
Degree of satisfaction with working hour flexibility
Boomers 43- 9366 6,2930 1,798 ,180 2,315 21865 ,021
Xers 25-42 12501 6,1964 2,309 19978,278 ,021
Degree of satisfaction with time off Boomers 43- 9366 6,4940 1,631 ,202 2,128 21865 ,033
Xers 25-42 12501 6,4148 2,121 19910,281 ,034
Degree of satisfaction with vacations and leave
Boomers 43- 9366 7,3374 11,230 ,001 6,962 21865 ,000
Degree of satisfaction with stability Boomers 43- 9366 7,4141 41,071 ,000 10,436 21865 ,000
Xers 25-42 12501 7,0526 10,530 20793,792 ,000
Degree of satisfaction with training Boomers 43- 7174 5,5184 8,147 ,004 ,529 17051 ,597
Xers 25-42 9879 5,4916 ,527 15220,948 ,598
Degree of trust in superiors Boomers 43- 6944 7,1323 ,613 ,434 4,544 16696 ,000
Xers 25-42 9754 6,9556 4,548 15000,200 ,000
Degree of trust in co-workers on the same level
Boomers 43- 6676 7,8045 ,239 ,625 ,279 16079 ,780
Xers 25-42 9405 7,7960 ,278 14320,716 ,781
Degree of satisfaction with time for personal life
Boomers 43- 9366 6,2486 1,949 ,163 1,296 21865 ,195
Xers 25-42 12501 6,2049 1,298 20297,635 ,194
Degree of satisfaction with benefits Boomers 43- 8327 3,1618 18,569 ,000 1,410 19719 ,159
Xers 25-42 11394 3,0955 1,405 17685,629 ,160
Degree of satisfaction with salary Boomers 43- 7273 6,0183 ,091 ,762 2,604 17284 ,009
Xers 25-42 10013 5,9274 2,606 15712,121 ,009
Net monthly income (1 < 600€; 9> 6000€)
Boomers 43- 9366 3,2885 244,212 ,000 12,119 21865 ,000
Table 4. Results from Regressions
Organizational
Commitment Job satisfaction
Boomers Xers Boomers Xers
1. Personal Variables
Gender (1= male; 2= female) - - 0.11086*** 0.00872
Educational level (1= uneducated, 10= higher
studies) -2.63719*** -3.22163*** -0.05555*** -0.03668***
2- Occupation
Occupational Situation (1= unskilled; 5=
management) 2.25156* 3.63053*** 0.06194*** 0.05673***
Workers in the company (1= one; 5= more than
250) - - 0.04248*** 0.02666**
3- Work Organization (0= none; 10= a great
deal)
Knowledge of the organizational chart at work 0.34463 1.48195*** - -
Knowledge of the company’s objectives - - - -
Degree of satisfaction with work organization 4.50714*** 4.08723*** 0.12489*** 0.11235*** Degree of satisfaction with superiors’ evaluation 6.55527*** 6.12129*** 0.10841*** 0.09724***
Degree of satisfaction with autonomy/independence7.70733*** 6.53075*** 0.11001*** 0.10050***
Degree of satisfaction with training 1.81984*** 2.47149*** 0.03963*** 0.05161***
Degree of satisfaction with opportunities for
promotion
4- Relations at work (0= none; 10= a great deal) 1.51972*** 0.67213 0.04207*** 0.02670***
Relations between management and employees 2.11259*** 2.63146*** 0.02843** 0.03368***
Relations between workers 2.33679*** 2.54002*** 0.04147*** 0.06750***
Degree of trust in superiors 1.64241** 2.12230*** 0.02715** 0.02288**
Degree of trust in co-workers on the same level
5- Time at work (0= none; 10= a great deal) 3.37375*** 3.19545*** 0.10938*** 0.10773***
Degree of satisfaction with working day 0.03263*** 0.01446**
Degree of satisfaction with working hour flexibility 0.21122 0.92949*** 0.03070*** 0.03486***
Degree of satisfaction with time off 1.19374** 0.62589 0.04480*** 0.04067***
Degree of satisfaction with vacations and leave 1.67274*** 1.87057*** 0.07558*** 0.07016***
Degree of satisfaction with stability 1.01645*** 0.57059* 0.01141* 0.00178
Degree of satisfaction with time for personal life
6- Remuneration for work (0= none; 10= a great
deal) 1.81377** 1.95482*** 0.03593** 0.05812***
Net monthly income (1 < 600€; 9> 6000€) 0.68957*** 0.74138*** 0.03043*** 0.03492***
Degree of satisfaction with salary -0.88742*** -0.69842*** 0.01120* 0.01614***
Degree of satisfaction with benefits -263.04186*** -259.31293*** 0.92102*** 1.25728***