In-Situ
Raman Measurements of Silicate Glasses during Vickers Indentation
Satoshi Yoshida
+1, Thu Huyen Nguyen
+2, Akihiro Yamada and Jun Matsuoka
Department of Materials Science, The University of Shiga Prefecture, Hikone 522-8533, Japan
In-situstructural changes of glass under a sharp diamond indenter are evaluated by using a micro-Raman spectrophotometer coupled with a self-made indentation equipment. This set-up enables us to obtainin-situRaman spectra of glass under a Vickers indenter and to observe transient and permanent structural changes in glass. It is found thatin-situRaman spectra of silica glass under the Vickers indenter show distinct peak-broadening, which is not observed in thein-situRaman spectra of hydrostatically compressed silica glass, nor in those of soda-lime silicate glass. This suggests that the indentation-induced shear stress causes the glass structure to be deformed into a different one with a wider bond angle distribution. Such a shear-induced structural change could play a key role on the contact damage of glass, especially for glass with a high degree of polymerization, like silica glass. [doi:10.2320/matertrans.MD201901]
(Received August 22, 2018; Accepted October 10, 2018; Published November 16, 2018)
Keywords: glass, indentation, Raman spectroscopy
1. Introduction
In the last quarter of a century, the display market has undergone a drastic change from CRT (Cathode Ray Tube) display into FPD (Flat Panel Display). Since most FPD utilizes thin sheet glasses, much more attention is now paid than ever before to glass with higher crack resistance. Although so many important works on the controlling factor for cracking in glass13)or on less-brittleness glasses47)have
been published, most of the reports are based on post-observation of an indentation imprint left on glass. Therefore, it can be said that we lack information onin-situmechanical responses of glass during a contact event between glass and a foreign body. In order to get a deeper insight into brittleness of glass, or crack nucleation phenomenon, we should focus on mechanical properties and structure of glass during the contact event.
In the previous studies, the present authors prepared the indentation microscope, which enables us to determine the contact area between a glass specimen and the indenter during the indentation test, and evaluated true contact stress on loading, orin-situMeyer hardness of the glass.8)Using the indentation microscope, they also clarified that the amount of sinking-in during the indentation test depends on glass composition and on indenter geometries, and that crack morphology and timing of crack initiation can be affected by glass composition and by deformation mechanism of glass under the indenter.9) The sinking-in means the downward
deformation of glass around the contact region during indentation. For example, a decrease in the sharpness of indenter, or an increase in the tip angle of indenter, causes Meyer hardness of soda-lime glass to be decreased, and the amount of the sinking-in region to be increased. This different mechanical responses of glass under indenters are followed by different crack geometries. A blunter indenter prefers the edge crack, which is the crack along the edge of the contact region, whereas a sharper indenter does the radial/median crack. In this way,in-situobservation of glass during indentation is a unique technique to understand the
indentation response of glass, but we have still less information available on atomistic view of glass structure under the sharp diamond indenter.
Recently, some researchers developed in-situ Raman measurement system during indentation, and reported the spatial distribution of crystalline phases during pressure-induced transformations of crystalline silicon under a conospherical diamond indenter,10) and the spatial distribu-tion of five-fold coordinated silicon atoms in amorphous silicon under the indenter.11) Although these are important
pioneering works on in-situ structural changes in material under an indenter, there is no information on structural changes of oxide glass under a sharp diamond indenter.
In this study, a self-made indenter with a Vickers tip for
in-situRaman measurements is prepared, and Raman spectra of silica and soda-lime silicate glasses under the Vickers indenter are obtained during both loading and unloading.
In-situstructural changes of the glasses under the indenter are discussed in terms of effects of shear stress on glass structure.
2. Experimental Procedure
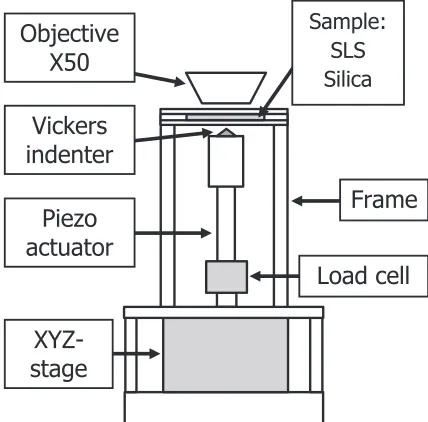
Figure 1 shows a schematic illustration of a self-made indenter for Raman measurements. The self-made indenter was composed of a Vickers tip, the load cell, the piezo-actuator, and the XYZ-stage. The indenter tip was attached to the piezo-actuator (PSt 150/10/60 Mess-Tek, Japan), which was driven by the piezo-driver (M-26118S, Mess-Tek, Japan). The indentation load was monitored with the load cell (LUX-B-50N-ID KYOWA, Japan). The load was increased in a stepwise manner using the piezo-actuator, and the maximum load was 5.0 N for both glasses. The XYZ-stage was used to align the XY-plane as well as to move the indenter tip close to the sample surface. The glass samples used were silica glass (MARUWA KE, Japan) and soda-lime silicate glass (Matsunami 0050, Japan). Their compositions and some physical properties of these glasses are shown in Table 1. The sample glass with a thickness of about 1 mm was sandwiched between two circular stainless plates with a diameter of 36 mm. The bottom plate had a 16-mm diameter hole through which the indentation can be performed from the bottom of the sample. The top plate had a 5-mm diameter +1Corresponding author, E-mail: yoshida@mat.usp.ac.jp
+2Undergraduate Student, The University of Shiga Prefecture
Special Issue on Recent Advances in Indentation Technique
hole so as to obtain Raman spectra of glass during the indentation test. The sandwiched sample was attached on the top of the frame of the set-up (Fig. 1).
The self-made indenter shown in Fig. 1 was placed in the commercial Raman spectrophotometer, NRS-5100 (JASCO Corporation, Japan) with 1800 lines/mm grating and with a dichroic mirror, in order to obtain in-situRaman spectra of glass during indentation. The excitation line was provided by a Green laser emitted at 532 nm, and irradiated from the top of the sample through the objective. The spot diameter of laser beam was estimated to be about 3 µm in diameter using an X50 objective (OLYMPUS LMPlanFLN, Japan) with a long working distance. The depth resolution can be estimated to be about 6 µm using the confocal aperture of 40 µm in diameter. The acquisition time was kept to be 30 s per run, and 20 runs were performed to obtain one spectrum at each measuring point. It has been reported that various types of inorganic glasses (oxide,12) chalcogenide,13) and metallic
glasses14)) exhibit the indentation creep even at room
temperature. In this study, however, any time evolution of Raman spectrum could not be observed during the holding time at a given load. This is probably because of limited spatial resolution of our Raman measurement set-up, and because of our experimental conditions. The measurement
point in which the Raman spectrum was obtained was the contact point between the glass specimen and the center of Vickers indenter tip. Although the Raman spectrum of glass was different at each point under the indenter, only the spectrum of the sample under the center of the Vickers tip was paid attention to in this study, because the spectral change of glass under the tip center was most remarkable as compared with those from other points. In-situ Raman mapping using an improved set-up will be our future plan to evaluate effects of indenter geometries (faces and ridges) on the spectral evolution.
Because of the depth resolution of this set-up, in-situ
Raman spectra of both glasses included the effect of fluorescence from the diamond indenter. Therefore, the baseline due to the fluorescence was subtracted from a raw spectrum to obtain a spectrum with aflat baseline. The baseline was assumed to be linear in the region from 400 to 1200 cm¹1. An example of the baseline subtraction is
shown in Fig. 2.
Piezo
actuator
XYZ-stage
Sample:
SLS
Silica
Vickers
indenter
Load cell
Frame
Objective
X50
[image:2.595.334.520.328.563.2]Fig. 1 Schematic illustration of a self-made indenter for in-situRaman spectroscopy. The object lens is mounted on the commercial Raman spectrophotometer.
Table 1 General compositions and physical properties of glasses used.
400 600 800 1000 1200
Raman shift,
k
/cm
-1Intensity (a.u. )
[image:2.595.61.275.383.594.2] [image:2.595.76.517.678.768.2]3. Results and Discussion
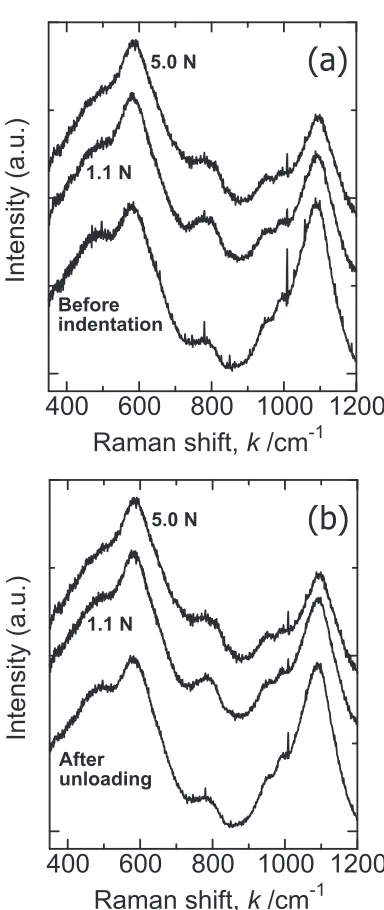
Figure 3 showsin-situRaman spectra of soda-lime silicate glass during both (a) loading and (b) unloading. It is known that the broad band between 400 and 700 cm¹1is associated
with the SiOSi rocking and/or bending motion.15) The
Raman scattering intensities shown in Fig. 3 are normalized with respect to the intensity of the 600 cm¹1peak. The peak at around 1100 cm¹1 is known to be assigned to symmetric stretching vibration between silicon and non-bridging oxygen (NBO) in Q3 unit,1518) which is the SiO4 tetrahedron unit
with one NBO. The superscriptn in the Qnunit denotes the number of bridging oxygens (BO) in the SiO4 tetrahedron.
In Fig. 3(a), the relative intensity of Q3band decreases with
increasing the indentation load. In the previous papers, this relative decrease in the intensity of Q3 band was also
reported for binary sodium silicate glass under hydrostatic
pressure.1921)The authors discussed that this spectral change
of the glass under hydrostatic pressure is due to the formation of five- or six-fold coordinated silicon under pressurization. In other words, NBO in one Q3 unit is converted into BO
to create five-fold coordinated silicon in glass, as shown in eq. (1),
Q3þQ4!VSiþQ4 ð1Þ
where Q4*represents a fully polymerized tetrahedral silicon species with one of its bridging oxygens bonded to a neighboringVSi, which is the SiO polyhedron withfive-fold coordinated silicon. The other reaction proposed is shown in eq. (2),
2Q3þQ4!VISiþ2Q4 ð2Þ
whereVISi is the SiO polyhedron with six-fold coordinated
silicon. Under the Vickers indenter, it is considered that similar structural changes occur in soda-lime silicate glass to formVSi andVISi units.
As for the Raman band between 400 and 700 cm¹1 in Fig. 3(a), the peak wavenumber is almost invariant regardless of the load. According to the central force model,22) this means that there is no change in the averaged bond angle of the SiOSi bond in soda-lime glass under the condition employed in this study. This is not the case for sodium silicate glass under hydrostatic pressure. Even under hydro-static pressure of 2.5 GPa, which is much lower than Meyer hardness of the glass, the peak at around 500 cm¹1 shifts
towards higher wavenumbers by³10 cm¹1.19)
During unloading, as shown in Fig. 3(b), the peak intensity of Q3 unit at around 1100 cm¹1 increases with decreasing
the load. The spectral change of soda-lime glass under the Vickers indenter is almost reversible during a loading and unloading cycle, and no permanent structural change can be observed. However, it has been reported that permanent structural changes, or permanent densification, in soda-lime glass can be confirmed in the Raman spectrum of the glass after Vickers indentation test at 20 N.23) This difference comes from the different size of the plastic zone under the imprint. After the Vickers indentation test at 5 N in this study, we can obtain the imprint with a half diagonal length of about 20 µm, since Vickers hardness of soda-lime glass is about 5 GPa. It was also reported that the plastic zone under the imprint is half-penny in shape, and that its radius is almost identical to the half diagonal length of the Vickers imprint.23,24) In the previous report,23) on the other hand,
the radius of the plastic zone under the Vickers imprint (20 N) is estimated to be 40 µm, which is as almost twice as that in this study. This is the reason why the previous authors could obtain the structural change in soda-lime glass under the Vickers imprint, even though the depth resolution was a little larger (9 µm) than ours. In addition, the permanent structural change in the plastic zone of soda-lime glass is very limited (The maximum change in density is about 5%.23,25)) as compared with silica glass (It is about 20%26)), and the amount of the structural change of the glass under the imprint decreases gradually with deeper down inside.23,25,26)This is
also the reason why the set-up used in this study could not detect the permanent structural changes of soda-lime glass after the indentation test.
(a)
(b)
400 600 800 1000 1200
Raman shift,
k
/cm
-1Before indentation
1.1 N 5.0 N
Intensity (a.u.)
400 600 800 1000 1200
After unloading
Raman shift,
k
/cm
-1Intensity (a.u.)
5.0 N
1.1 N
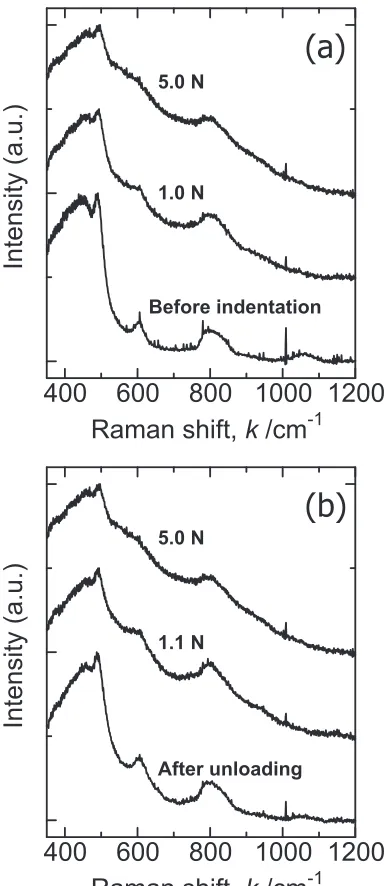
[image:3.595.72.264.61.516.2]Figure 4 showsin-situRaman spectra of silica glass during both (a) loading and (b) unloading. The spectrum of silica glass before indentation (The bottom in Fig. 4(a)) shows some characteristic Raman bands. The main Raman band at around 450 cm¹1is in general assigned to oxygen motion in
the plane bisecting the SiOSi linkage, or the SiOSi rocking motion. The two Raman peaks at 490 cm¹1(D
1band)
and 600 cm¹1 (D2 band) are assigned to vibrations of
breathing motions of the SiO four membered ring and the SiO three membered ring, respectively.27) The Raman scattering intensities shown in Fig. 4 are normalized with respect to the intensity of D1 band. The asymmetric Raman
band at around 800 cm¹1 is related to Si motion in an SiO4
tetrahedron.28)
From Fig. 4(a), the broadening of Raman bands can be observed with increasing the indentation load. In addition, the Raman intensity of D2band at around 600 cm¹1increases
with increasing the load. With decreasing the load, on the
other hand, the widths of Raman bands in the spectra are almost recovered as shown in Fig. 4(b). In the Raman spectrum of silica glass after complete unload (The bottom in Fig. 4(b)), it is found that the peak intensity of the D2 band
increases and the peak width of the main band (³450 cm¹1) decreases as compared with the spectrum before loading (The bottom in Fig. 4(a)). These spectral changes of silica glass after Vickers indentation are consistent with those in previous reports.26,29)It is known that indentation deformation of silica glass can be explained in terms of volume shrinkage, or permanent densification, rather than volume-conservative shear flow, which is another deformation mechanism in glass.30) Silica glass has an open and fully polymerized
network structure, whereas soda-lime glass has a dense and depolymerized structure. This structural difference between two glasses results in different responses under the Vickers indenter. A plausible mechanism of the permanent densifi-cation of silica glass is an increase in the number of smaller SiO rings, which is confirmed in the spectrum after unloading (The bottom in Fig. 4(b)). Not only the re-construction of the ring statics but the increase in the intermediate range order occurs in the glass under the indenter. This is evidenced by the decrease in the peak width of the main band at around 450 cm¹1 (The bottom in Fig. 4(b)). This peak sharpening of the main Raman band corresponds to a narrowing of the SiOSi bond angle distribution. These structural changes in an atomic scale have been already proposed based on the analysis of Raman spectra of silica glass before and after indentation.26,29)
Regarding in-situ structural changes in silica glass, the peak broadening in the spectra on loading shown in Fig. 4 is a unique feature of silica glass under the Vickers indenter. Soda-lime glass under the Vickers indenter (Fig. 3) and silica glass under hydrostatic pressure do not show such peak broadening in their Raman spectra. On the contrary, Hemley
et al. reported the peak sharpening for the main band of
in-situ Raman spectrum of silica glass under hydrostatic pressures below 10 GPa, which is threshold for permanent densification under hydrostatic pressure.31) Hemley et al.
discussed that the sharpening of the main band of Raman spectrum indicates an increase in intermediate range order as described above. This is not the case for silica glass under the Vickers indenter. The spectral changes shown in Fig. 4 suggest that Vickers indentation on silica glass causes a transient structural change accompanied with a widening of the SiOSi bond angle distribution.
Under the Vickers indenter, materials have to respond to shear stress, not only to hydrostatic stress.32)This may result
in different structural changes in glass under different loading conditions, such as hydrostatic pressure or indentation. In the case of silica glass, a fully polymerized and open network permits a highly distorted glass structure with a wider bond angle distribution, which may be allowed only under shear stress. Under hydrostatic pressure,31)however, a narrowing in the SiOSi bond angle distribution and a shift of the SiO ring statics towards smaller rings would be preferred due to space constraints on the volume, rather than a widening in the bond angle distribution.
Recently, Shcheblanov et al. reported the effects of pure
shear on the computed Raman spectrum of silica glass using a
(a)
(b)
400 600 800 1000 1200
Raman shift,
k
/cm
-1Intensity (a.u.)
Before indentation 1.0 N
5.0 N
400 600 800 1000 1200
Raman shift,
k
/cm
-1Intensity (a.u.)
After unloading 1.1 N
5.0 N
[image:4.595.73.265.68.511.2]semi-classical modelling.33) They have shown evidence of
a signature of plastic shear on Raman spectrum of silica glass. They reported that the plastic shear deformation in silica glass is caused by measurable structural changes, especially the increase in the number of low-order rings (D1and D2defects)
at a mesoscopic scale and the increased mobility of oxygen atoms along stretching vibrations. Although they did not show a clear broadening of Raman bands in lower frequency regions, the increase in the intensity of D2 band on loading
in this study is in good agreement with their calculation. The indentation-induced stress field is not simple but very complicated, and the mechanical responses to the stressfield should depend on glass composition, or on microscopic glass structure. Further experimental and modelling works on glass structure under various indenters will be indispensable to predict crack nucleation phenomenon in glass.
4. Conclusion
In this study,in-situRaman scattering spectra of silica and soda-lime glasses under a Vickers indenter were successfully obtained by using a self-made indentation set-up and a commercial Raman spectrophotometer. During the Vickers indentation test of soda-lime glass, the scattering intensity of Q3band decreases with increasing the indentation load. This suggests that the non-bridging oxygen in the Q3 unit is converted into a bridging oxygen to create five- or six-fold coordinated silicon in glass. For silica glass, on the other hand, the peak broadening in the spectra on loading can be observed, and it is accompanied with the increase in the scattering intensity of D2 band. These unique features of
Raman spectra of silica glass under the Vickers indenter stem from a fully polymerized and open network structure of the glass.
Acknowledgments
The author (S.Y.) would like to thank to the JSPS KAKENHI Grant Numbers 16K06730. This work is also financially supported by Nippon Electric Glass Co. Ltd.
REFERENCES
1) E.H. Yoffe:Philos. Mag. A46(1982) 617628.
2) S.S. Chiang, D.B. Marshall and A.G. Evans:J. Appl. Phys.53(1982) 298311.
3) R.F. Cook and G.M. Pharr:J. Am. Ceram. Soc.73(1990) 787817.
4) J. Sehgal and S. Ito:J. Am. Ceram. Soc.81(1998) 24852488. 5) T.M. Gross, M. Tomozawa and A. Koike: J. Non-Cryst. Solids355
(2009) 563568.
6) G.A. Rosales-Sosa, A. Masuno, Y. Higo and H. Inoue:Sci. Rep. 6
(2016) 23620.
7) K. Januchta, R.E. Youngman, A. Goel, M. Bauchy, S.L. Logunov, S.J. Rzoska, M. Bockowski, L.R. Jensen and M.M. Smedskjaer: Chem. Mater.29(2017) 58655876.
8) S. Yoshida, M. Kato, A. Yokota, S. Sasaki, A. Yamada, J. Matsuoka, N. Soga and C.R. Kurkjian:J. Mater. Res.30(2015) 22912299. 9) S. Yoshida, K. Wada, T. Fujimura, A. Yamada, M. Kato, J. Matsuoka
and N. Soga:Front. Mater.3(2016) 54.
10) Y.B. Gerbig, C.A. Michaels and R.F. Cook:J. Mater. Res.30(2015) 390406.
11) Y.B. Gerbig, C.A. Michaels, J.E. Bradby, B. Haberl and R.F. Cook: Phys. Rev. B92(2015) 214110.
12) R. Limbach, B.P. Rodrigues and L. Wondraczek:J. Non-Cryst. Solids
404(2014) 124134.
13) J.P. Guin, T. Rouxel, V. Keryvin, J.-C. Sangleboeuf, I. Serre and J. Lucas:J. Non-Cryst. Solids298(2002) 260269.
14) B. Wei, T. Zhang, W. Li, D. Xing, L. Zhang and Y. Wang:Mater. Trans.
46(2005) 29592962.
15) B.O. Mysen, L.W. Finger, D. Virgo and F.A. Seifert: Am. Mineral.67
(1982) 686695.
16) T. Furukawa, K.E. Fox and W.B. White: J. Chem. Phys.75(1981) 32263237.
17) D.W. Matson, S.K. Sharma and J.A. Philpotts:J. Non-Cryst. Solids58
(1983) 323352.
18) P. McMillan: Am. Mineral.69(1984) 622644.
19) G.H. Wolf, D.J. Durben and P.F. McMillan:J. Chem. Phys.93(1990) 22802288.
20) X. Xue, J.F. Stebbins, M. Kanzaki, P.F. McMillan and B. Poe: Am. Mineral.76(1991) 826.
21) D.L. Farber and Q. Williams:Am. Mineral.81(1996) 273283. 22) P.N. Sen and M.F. Thorpe:Phys. Rev. B15(1977) 40304038. 23) A. Kassir-Bodon, T. Deschamps, C. Martinet, B. Champagnon, J.
Teisseire and G. Kermouche:Int. J. Appl. Glass Sci.3(2012) 2935. 24) J.T. Hagan:J. Mater. Sci.15(1980) 14171424.
25) Y. Kato, H. Yamazaki, S. Yoshida, J. Matsuoka and M. Kanzaki: J. Non-Cryst. Solids358(2012) 34733480.
26) A. Perriot, D. Vandembroucq, E. Barthel, V. Martinez, L. Grosvalet, Ch. Martinet and B. Champagnon:J. Am. Ceram. Soc.89(2006) 596 601.
27) F.L. Galeener:Solid State Commun.44(1982) 10371040.
28) P. McMillan, B. Pirou and R. Couty:J. Chem. Phys.81(1984) 4234 4236.
29) A. Kailer, K.G. Nickel and Y. Gogotsi:J. Raman Spectrosc.30(1999) 939946.
30) S. Yoshida, J.-C. Sanglebœuf and T. Rouxel:J. Mater. Res.20(2005) 34043412.
31) R.J. Hemley, H.K. Mao, P.M. bell and B.O. Mysen:Phys. Rev. Lett.57
(1986) 747750.
32) G. Molnár, G. Kermouche and E. Barthel:Mech. Mater.114(2017) 18.