Munich Personal RePEc Archive
Conversion From Shadow Banking to
Regular Banking an Emperical Analysis
Dinc, Yusuf
Istanbul Sabahattin Zaim University
15 April 2015
Online at
https://mpra.ub.uni-muenchen.de/85333/
CONVERSION FROM SHADOW BANKING TO REGULAR BANKING; AN EMPERICAL ANALYSIS
Yusuf Dinc*
ABSTRACT
Shadow banking became a trendy topic of argument for restructuring the financial system
after the global financial crisis. Shadow banking is handled in conceptual manner in this
thesis, and the conversion of special finance houses in Turkey to participation banks as a more
important actor in the financial system is proved to be a shadow banking experience by an
empirical analysis. Moreover, the findings of the econometric model have shown that the
selected performance criteria were negatively affected after the conversion. The findings on
the negative effects of the conversion are also supported by the tendencies that are inclined
downwards.
Key Words: Shadow banking, perfect shadow banking, hidden shadow banking, special finance houses, participation banks, deposit banks, regression, comparative performance
analysis.
SHADOW BANKING
Shadow banking is known as a combination of financial instruments and non-banking
financial institutions. Definition of the shadow banking differs according to the viewpoints of
the researchers. Singh and Aitken defines shadow banking as non-banking institutions. This
definition does not tell us whether non-financial institutions are included or not?
So Singh and Aitken give some examples of institutions for shadow banking like hedge funds,
money market mutual funds, pension funds, Bank of New York and State Street, etc.1 Shadow banking itself is dynamic. It changes through regulatory arbitrage all the time. Static
definitions for shadow banking will be useless.
Pozsar and others defines shadow banking as market-based financial intermediation.2 Adrian
and Ashcraft describe shadow banking through activities; financial intermediation without
deposit and credit guarantees.3 In the same paper, Adrian and Ashcraft give the definition of
shadow banking as financial institutions that intermediate credit, maturity, and liquidity
without deposit insurance and no access to liquidity window of central bank. This definition is
very similar to the Financial Stability Board (FSB) of European Central Bank’s shadow
banking definition. FSB simply defines shadow banking as non-banking financial
intermediation.4 Shadow banking is a result of a need. The need for alternative funding channels and investment vehicles is the motive of shadow banking services. Shadow banking
uses alternative investment tools and funding channel services as competitive advantage. The
competitive advantages of shadow banking are service for shorter investment opportunities
and longer funding services. That means the same motive for the services of banking are also
true for shadow banking; maturity mismatch.
1 Singh, Manmohan, Aitken James, “The Sizable Role of Rehypothecation in the Shadow Banking System”,
IMF Working Paper, 172, 2010, p.6.
2 Pozsar, Z., Adrian, T., Ashcraft, A. B., Boesky, H., “Shadow Banking”, Federal Reserve Bank of New
York Staff Report, No. 458, Available at SSRN 1640545., 2010, p.4.
3 Adrian, T., Ashcraft, A. B., “Shadow Banking Regulation”, FRB of New York Staff Report, (559)., 2012,
p.2.
Shadow banking is an alternative for the investors that are looking for higher yield and also an
alternative for them who are looking for very short investment opportunities. FSB is
responsible for observing and regulating shadow banking in Europe. FSB defines shadow
banking as non-banking credit intermediation and activities in in the same 2011 Shadow
Banking Report.5 In the same report, FSB puts a frame for shadow banking. According to that, shadow banking includes credit intermediation institutes and activities beyond
conventional banking that offers leverage and risk transfer by maturity and liquidity match or
regulative arbitrage.6 FSB’s shadow banking definition may cause confusion on involving some institutions that are not shadow banks like leasing, factoring, forfaiting companies etc.7 European Commission (EC) refers to FSB’s definition for political analysis.8 EC includes
fund collection and utilization and widens definition. System approach for shadow banking
definition includes both institutions and instruments. Shadow banking system combines
institutions and activities for wider political analysis.
Ericco et al. considers FSB’s definition on shadow banking as shortly expressing definition as non-bank credit intermediation. Shadow banking is mostly referred to as market-based
financial figures on their paper. 9 Although Classens et al. express that shadow banking is beyond banking and financial markets when growing figures for shadow banking data in time
series is beyond banking and financial markets.10
Definitions with current shadow banking examples can never be enough for policy making.
Because shadow banking is an area for regulative arbitrage and this specification brings
dynamism to develop new instruments and activities and also new institutions.
5 FSB, Shadow Banking: Scoping the Issues, s.1. 6 FSB, Shadow Banking: Scoping the Issues, s.3.
7 Claessens, S., Ratnovski, L.,” What is Shadow Banking?”, IMF Working Paper, 2014, s.3. 8 European Commission Report, Shadow Banking, Brussels, 102 Final, 2012, s.3.
9 Errico, Luca, et al., “Mapping the Shadow Banking System Through a Global Flow of Funds Analysis.”,
Singh and Aitken define shadow banking as the institutions besides regular banking
institutions. Singh and Aitken count banking conglomerates as shadow banking, too.11 Researchers try to put a frame for shadow banking with a list of institutions. Even strictly
regulated investment banks are accepted as shadow banks. Hedge funds, money market
mutual funds, insurance companies are other shadow banks that are commonly included in
many researches. This approach is risky. Because the main motive of shadow banking is the
highly developing technology that easily creates new instruments and institutions.
Compared to regular banking, shadow banking services are diversified, discussable, and more
innovative. Regular banks have disadvantages in offering new services with a more
reasonable cost.12 Effective use of technology brings competitive advantage to shadow
banking. According to Langevoort, shadow banking has advantage of technology when
developing short-term instruments for money markets which are traditionally compensated by
conventional banks.13
Financial Crisis Inquiry Commission (FCIC), which is supported by Stanford Law School,
mentions shadow banking characteristics in their current reports as non-regulated or
less-regulated financial activities besides conventional banking.14
Another characteristics for shadow banking is regulative arbitrage that is offered by
deregulation.15 Regulative arbitrage reduces transaction costs and increases profit.16 Third characteristics of shadow banking is decentralization. Shadow banking spreads the risks and
eliminates intermediation of conventional banking.
11 Singh, Manmohan, Aitken James, “The Sizable Role of Rehypothecation in the Shadow Banking System.”, IMF Working Paper, 172, 2010, p.5.
12 Schwarcz, Steven L., “Regulating Shadow Banking.”, Review of Banking and Financial Law 31.1
(2012)., p.626.
13 Langevoort, Donald C., “Global Securities Regulation after the Financial Crisis.” Journal of International
Economic Law, 13.3: 799-815, 2010, s.799.
14 Fin. Crisis Inquiry Comm’n, Preliminary Staff Report: Shadow Banking and the Financial Crisis 7, 2010, available at http://fcicstatic.law.stanford.edu/cdn media/fcic-reports/2010-0505-Shadow-Banking.pdf (emphasis added).
These characteristics of shadow banking cause systemic risk.
Shadow banking’s function is completely same with conventional banking. Both of the financial actors intermediate credit and liquidity. The difference is hidden in the numbers of
institutions and activities that make the same function. Conventional banks make their
intermediation function as only one institute and with only one financial instruments; i.e. the
deposits. On the other hand, shadow banking runs the same function with a bunch of institutes
and financial instruments. The whole shadow banking system works like departments of a
conventional bank.
A systematical approach for shadow banking may bring better understanding for policy
makers. Systematical approach considers shadow banking as a whole system with institutions
and activities that contain financial instruments. System approach does not spare financial
activities from shadow banks, and does not count certain financial conduits as shadow
banking while the system easily develops new conduits for regulative arbitrage. These are the
advantages of the systematical approach.
Shadow banking is highly integrated with regular banking or vice versa. When a regular bank
is perfectly integrated to shadow banking, system approach may keep this probability beyond
policy making. This can happen when a regular bank invests only in shadow banking
instruments. Mainly, conventional banking converts deposits to credits; on the other hand,
shadow banking converts credits to securities.17 This is the main point that involves regular banking with shadow banking. Actually, Lehman Brothers’ case was an example of perfectly
integrated regular bank. This is the main disadvantage of the systematical approach.
Perfect Shadow Banking
There are perfect shadow banks besides modern shadow banking. Perfect shadow banks are
shadow banks that function like a perfect bank. Perfect shadow banks collect money and
intermediate credit and liquidity under only one institution. Modern shadow banking has the
17 England, R.S., Black Box Casino: How Wall Street’s Risky Shadow Banking Crashed Global Finance,
same function but operates the whole banking process with a collection of institutions and
financial instruments. On the other hand the differences of perfect shadow banks from
conventional banks are the legislative framework, deposit insurance and liquidity window of
the central banks. Claessens and Ratnovski highlights the need for public or special guarantee
for non-bank financial institutions.18
Generally, on institution side, definitions in literature put a frame for shadow banking. This
frame includes three characteristics for shadow banking institutions. Firstly, shadow banking
institutions perform banking function in a less regulated or unregulated environment.
Secondly, shadow banking as financial intermediaries, has no access to central banks’
liquidity window. Lastly, shadow banking has no public or private credit and deposit
guarantees.
SPECIAL FINANCE HOUSES OF TURKEY
Turkey has initial examples of perfect shadow banks. The First example of Turkish perfect
shadow banks are bankers that failed with a liquidity crisis in 1980s. Bankers were private
institutions mostly one person businesses without capital requirements and strict license
requirements. Bankers were financial intermediaries of 1980s that intermediated liquidity and
credit. The motive behind the need for bankers was the interest limitation of government in
the money markets. Governmental restriction on money markets produced bankers to satisfy
the need for high interest expectation of investors and the need for liquidity of firms as a
perfect shadow bank that collected money and allocated credits.
Bankers failed with a liquidity crisis in mid-1980s because of inappropriate legislation and
supervision.
Another important example of perfect shadow banking is the Turkish special finance houses.
Turkey's Special Finance Houses offered Sharia-compliant financial services based on a decree of December 1983 on the “Establishment of Special Finance Houses”.
Special Finance Houses (SFH) started to appear in the market in 1985. SFHs were
interest-free banks operating with Islamic finance principles which banned the interest. In the past
three decades, the Turkish financial sector developed with the help of liberalization, mergers,
technological innovations and new financial institutions. One of these important
developments is the SFHs. SFHs were providing financial products and services based on
Islamic principles.
Okumus (2005) defines SFHs as the institutions providing financial products and services
based on Islamic principles. Following the liberalization process of the Turkish economy in
the early 1980s, the financial sector was reconstructed through liberalization that also brought
in innovations to financial markets. In this context, the SFHs, providing financial products
and services based on Islamic principles, were introduced to the Turkish financial markets. This constituted a “dual banking” system in Turkey in which interest-based banking and interest-free banking run their operations side by side.
It has been suggested that the introduction of interest-free financial products and services to
the Turkish financial markets was more of a political strategy rather than an economic or
religious move at that time.19 Hanif mentioned that Islamic banking is not as foreign to business world as it is perceived by certain quarters.20 It is a business very much like conventional banking within certain restrictions imposed by Islamic law.
SFHs were nothing different from Islamic banks. The business model of SFHs was based on
profit sharing. Mainly, the pricing process is the biggest difference between the two banking
model. Islamic banks start the whole process of pricing of conventional banks from the end of
funding for deposits. Conventional banks first collect money and offer a certain interest rate
then create credits. Islamic banks first create credits then make profit, and then share a certain
percentage of the profit whatever they gain from funding with their depositors. Pricing the
collected funds at the end is very similar to modern shadow banking business model.
19 Okumus, H.S., Interest-free Banking in Turkey: A Study of Customer Satisfaction and Bank Selection
Criteria, Journal of Economic Cooperation, 26(4), 2005.
20 Hanif, M., Differences and Similarities in Islamic and Conventional Banking, International Journal of
As mentioned above the SFHs was founded based on a decree of December 16th, 1983 on the “Establishment of Special Finance Houses” and the number of the SFHs reached 6 till 2000, after the initial founding. Ihlas Finance House was founded in 1995 as the last SFH but soon
became the biggest in the market in a 5 years period.
Ihlas Finance House was founded based on a decree of November 1994 on the ‘Establishment of Ihlas Finance House’ and started its operations in April 1995. In the foundation, paid capital of the Bank was TRL 1 million, and 90% of the shares were belonging to Ihlas
Holding. Ownership structure was changed significantly over time. As of November 11th,
2000, 34.59 % of the total shares were publicly listed.
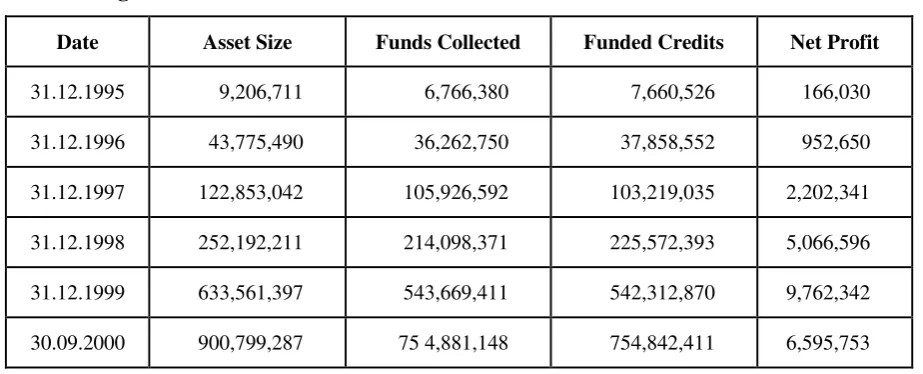
[image:9.595.68.530.376.563.2]Some major figures extracted from the announced financial statements are listed here below;
Table 1: Figures from Balance Sheet in TRL terms.*
Date Asset Size Funds Collected Funded Credits Net Profit
31.12.1995 9,206,711 6,766,380 7,660,526 166,030
31.12.1996 43,775,490 36,262,750 37,858,552 952,650
31.12.1997 122,853,042 105,926,592 103,219,035 2,202,341
31.12.1998 252,192,211 214,098,371 225,572,393 5,066,596
31.12.1999 633,561,397 543,669,411 542,312,870 9,762,342
30.09.2000 900,799,287 75 4,881,148 754,842,411 6,595,753
*Source: Independent Auditors Reports of Ihlas FH
As of September 30th, 2000 total asset size of the Ihlas reached TRL 901 million and total
collected funds increased to TRL 755 million in this period. Total assets rose by 42 % and
total collected funds increased by 39 % during nine month period December 1999 to
deteriorated and official authorization of the Ihlas was abolished based on authorities’ February 2001 decree.21
The given reasons behind this abolishment with the decree are here below;
‒ Levied on the EFT, swap account and blockade in the Central Bank of the Republic of Turkey, and day-by-day these foreclosures increased,
‒ Authority instituted legal proceedings according to the Law No. 6183 on the Procedure of Collection of Public Receivables because Ihlas Finance was not able to fulfill of its legal
obligations against Resource Utilization Support Fund (KKDF)
‒ Could not meet the withdrawals of the collected funds belongs to participation and current account holders.
‒ Limited ability to meet its commitments due to deterioration in the financial structure.
‒ Unsuccessful attempts to solve liquidity problems though precautions to reinforce financial structure.
‒ Funding Group firms over legal limits.
Balance sheet deterioration caused poor financial structure and a steady run started. Ihlas
could not meet the withdrawals and inevitably failed.
Ihlas’ sell off was subject to the Turkish Commercial Code because Banking Law did not cover it. The SFHs were the non-bank financial intermediaries that collect funds, give credits,
and use leverage like perfect shadow banks. It was important not to being subject to the
Banking Law for authorities because it meant limited ability for regulation.22
Banks were at the center of the Turkish financial system and regulative actions was mostly
focusing on them so the non-bank institutions were partially out of regulated environment and
21 Hayali, A., Sarili, S., Dinc, Y., Turkish Experience in Bank Shareholders’ Fraud and Bank Failure: Imar
Bank and Ihlas Finans Case, The Macrotheme Review, October 2012 1(1), p.125
22 Hayali, A., Sarili, S., Dinc, Y., Turkish Experience in Bank Shareholders’ Fraud and Bank Failure: Imar
were not covered by deposit insurance. The exact need was an overall regulative
implementation. There was one way to do an overall regulation; to convert SFHs as banks.
This action has taken with 5411 Banking Act in 2006.
Hidden Shadow Banking
As motioned in the first section, to consider an institution as a regular bank, it must perform
financial intermediation under banking legislative frame, must have access to liquidity
window of the central banks, and public or private credit and deposit guarantees. In other
words, financial intermediaries that do not meet all of these characteristics are considered as
shadow banking institutions. Special finance houses were not meeting any of the regular
banking characteristics. They were perfect shadow banks that were performing banking under
one institutional roof though they did not have access to liquidity window nor public or
private guarantees. Moreover, they were operating under a unique legislative frame that was
separate from regular banking. From 1985 to 2001, the operations of the SFHs were perfectly
shadow banking. In 2001, SFHs were included in the 4491 Turkish Banking Act but deposit insurance was not available for SFHs’ participation accounts. Because participation accounts were not considered as deposits in the Act.23
SFHs were meeting only one of the characteristics of regular banking with 4911 Banking Act
till 2006. In 2006, the 5411 Turkish Banking Act was enacted. 5411 is the current banking act
in Turkey now. SFHs changed their names as ‘participation banks’ with the 5411 Banking
Act. The same act brought deposit insurance and access to the liquidity window of the central
bank for participation banks. Since then, SFHs are accepted as regular banks under the name of “participation banks” in theory.
However, in practice, participation banks did not cover all the three characteristics of regular
banking. Participation banks had the exact legislative framework with regular banks and
deposit insurances offered for participation accounts same as bank deposits. The third
23 Yahşi, Fahrettin, Özel Finans Kurumları’nın Mevzuat Serüveni
characteristics for regular banking as liquidity window access was also brought for
participation banks with the regulation in theory, but in practice, the participation banks were
not able to access liquidity window.
From 2006 to 2012, participation banks experienced ‘hidden shadow banking’. Hidden
shadow banking occurs as a form of regular banking, when a regular bank in theory cannot
meet all the three characteristics of regular banking in practice.24
Liquidity window access of Turkish Central Bank is available if banks have bonds to
discount. Participation banks, successors of SFHs, had access with 5411 Banking Act to
liquidity window, but in practice, the situation was opposite. There were not Sharia-compliant
financial instruments that participation banks could invest. Since participation banks had no
bonds in their portfolio to discount, they could not have access to liquidity window.
In 2012, Turkish Treasury issued first Sukuk (rent certificate) as Sharia-compliant bond. Soon
participation banks invested in Sukuk. Sukuk opened access to liquidity window of the central
bank as a discountable bond. There were one more detail to access liquidity window and an
interest-free contract should be signed between Turkish Central bank and participation banks.
Soon after Sukuk issuance, Turkish Central Bank accepted to prepare and sign an interest-free
contract.
Since 2012, participation banks have been accepted as regular banks. There is no other
example that converts from shadow banking to regular banking. The transition of SFHs to
participation banks, from shadow banking to regular banking is important for policy making.
This unique case of transition can be proved with an econometric model while the
performance of shadow bank forms and regular bank forms can be compared.
This paper models the performance of SFHs and participation banks. The model also
compares SFHs and participation banks with conventional banks as control group.
24 Dinc, Yusuf, Gölge Bankacılıktan Regüler Bankacılığa Geçiş; Türkiye’deki Özel Finans Kurumları
METHOD AND ECONOMETRIC MODEL
There are many econometric researches on performance of banks.
No Writer Title Method Time/Place Results Year
1 Bashir, Abdel Hameed Risk and Profitability Measures in Islamic Banks;
The Case of Two Sudanese Banks
Panel Data Regression
Sudan, 1979-1993
*Increasing scale increasing profitability
*Increasing scale decreasing operational risk.
199925
2 Kunt, A., Huizinga Financial Structure and Bank Profitability Regression OECD, 1990-1997
*Developing financial system
decreasing profitability. 2000 26
3
Claessen, S., Kunt, Huizinga
How Does Foreign Entry Affect Domestic Banking Markets Regression 80 Countries, 1988-1995
*Foreign banks are less profitable in developed countries.
*Foreign banks are more profitable in developing countries.
200127
4
Boyd, J., H., Levine, Smith,
The Impact of Inflation on financial Sector Performance Simple Linear Regression 97 Countries, 1960-1995
*Banks and financial markets are inversely correlated with inflation.
*Inflation over %15 decrease performance of financial markets.
200128
25 Bashir, Abdel-Hameed M., "Risk And Profitability Measures in Islamic Banks: The Case Of Two Sudanese Banks." Islamic Economic Studies 6.2: 1-24, 1999.
26 Demirgüç-Kunt, Asli, and Harry Huizinga, "Financial Structure And Bank Profitability", World Bank Policy Research
Working Paper 2430, 2000.
27 Claessens, Stijn, Aslι Demirgüç-Kunt, Harry Huizinga, "How Does Foreign Entry Affect Domestic Banking
Markets?", Journal of Banking & Finance 25.5: 891-911, 2001.
28 Boyd, John H., Ross Levine, Bruce D. Smith, "The Impact Of Inflation On Financial Sector Performance." Journal of
No Writer Title Method Time/Place Results Year 5 Bashir, Abdel Hameed Assessing the Performance of Islamic Banks: Some Evidence from the Middle East
Regression
Middle East, 1993-1998
*High leverage and higher rates for credits brings higher profitability.
*Foreign banks are more profitable than domestic banks.
200129
6 Vennet, Rudi V.
Cost and Profit Efficiency of financial
Conglomerates and Universal Banks in Europe
Regression EU, 1990-1998
*Financial conglomerates are more income efficient than specialized competitors. *Multinational banks are more
cost and profit efficient than domestic banks. 200230 7 Hassan, K.,M., Bashir Determinants of Islamic Banking Profitability Regression 21 Countries, 1994-2001
*Profitability performance of Islamic banks is positive correlated with equities on the other hand correlation with credit ratios are negative.
*Consumers attitude, maturity and non-profit share income are indicators of
profitability.
*Tax are efficient, provisions are inefficient on
profitability of Islamic banks.
*Economic conjuncture effects higher profitability.
200331
29 Bashir, Abdel-Hameed M., "Assessing the performance of Islamic banks: Some evidence from the Middle East", Topics
in Middle Eastern and North African Economies, electronic journal, Volume 3, 2001.
30 Vander Vennet, Rudi, "Cost And Profit Efficiency Of Financial Conglomerates And Universal Banks in
Europe." Journal of Money, Credit, and Banking 34.1: 254-282, 2002.
31 Hassan, M. Kabir, Abdel-Hameed M. Bashir, "Determinants Of Islamic Banking Profitability", 10th ERF Annual
No Writer Title Method Time/Place Results Year
8 Naceur, Samy B. Determinants of The Tunisian Banking Industry Profitability: Panel Evidence Panel Data Regression Tunisia, 1980-2000
*Characteristics of bank explain interest margin and net profitability.
*Macro-economic indicators are ineffective on interest margin and profitability. *Concentration on financial
markets benefit less compared to competition of conventional banks. 200332 9 DeYoung, R., Rice, Noninterest Income and Financial Performance at U.S. Commercial Banks
Regression USA, 1989-2001
*Well governance causes focus on core banking business.
*Marginal increases in non-interest income do not require risky transactions.
200433 10 Berger, A., Hasan, Klapper, Further Evidence on the Link Between Finance and Growth: An International Analysis of Community Banking and Economic Performance Panel Data Regression 49 Countries, 1993-2000
*Small scale, private, domestic banks produce better economic performance.
*Relatively healthy small scale banks mostly depend on high GDP growth.
200434
32 Naceur, Samy Ben, "The Determinants Of The Tunisian Banking Industry Profitability: Panel Evidence." Universite
Libre de Tunis Working Papers, 2003.
33 DeYoung, Robert, Tara Rice, "Noninterest Income And Financial Performance At US Commercial Banks." Financial
Review 39.1: 101-127, 2004.
34 Berger, Allen N., Iftekhar Hasan, Leora F. Klapper, "Further Evidence On The Link Between Finance And Growth: An
International Analysis Of Community Banking And Economic Performance", Journal of Financial Services Research
No Writer Title Method Time/Place Results Year
11 Samad, Abdus
Performance of Interest-Free Islamic Banks vis-a-vis Interest-Based Conventional Banks of Bahrain
Financial Ratio Analysis Mean and t-test Bahrein, 1992-2001
*No significant difference between Islamic and
conventional banks’
profitability and liquidity. *Even Islamic banks last
comers to the market, they perform as well as conventional banks. *Islamic banks are subject to
less credit risks than conventional banks.
200435
12 Yudistira, Donsyah Efficiency in Islamic Banking: an Empirical Analysis of Eighteen Banks Data Envelopme nt Analysis 18 Banks, 1997-2000
*Islamic banks are less efficient compare to conventional banks as competitors.
*Islamic banks suffered in crisis but performed very well soon after the crisis. *Diseconomies of scale is true
for Islamic banks.
*Mergers should be supported.
200436
13 Haron, Sudin Determinants of Islamic Bank Profitability Panel Data Regression Islamic Banks
*Balance sheet factors is determining on profitability. *Market and scale value are
effective on profitability.
*Current accounts, equity and profit share ratio are effective on profitability.
200437
35 Samad, A., “Performance of Interest-free Islamic Banks vis-à-vis Interest-based Conventional Banks of Bahrain”, IIUM
Journal of Economics and Management12, no.2, 2004.
36 Yudistira, Donsyah, "Efficiency in Islamic Banking: An Empirical Analysis Of Eighteen Banks." Islamic Economic
Studies 12.1: 1-19, 2004.
No Writer Title Method Time/Place Results Year
14 Chantapong, Saovanee
Comparative Study of Domestic and Foreign Bank Performance in Thailand:The Regression Analysis Panel Data Regression Thailand, 1995-2000
*Foreign banks are
performing better compared to average domestic banks.
*Both foreign and domestic
banks’ performance
increased soon after the crisis. 200538 15 Bonin, John P., Hasan, Wachtel Privatization Matters: Bank Efficiency in Transition Economies Regression Transition Economies (Emerging EU), 1994-2002
*Foreign banks are more efficient.
*Public banks are less efficient.
200539
16 Berger, A., Patti,
Capital Structure and Firm Performance: A New Approach to Testing Agency Theory and an Application to the Banking Industry
Regression USA, 1990-1995
*High leverage and less capital adequacy ratio bring more profit.
*Shareholder structure determines profitability efficiency.
*Efficient profitability dominates agency problem.
200640
18 Hassan, Kabir M.
The X-Efficiency in Islamic Banks Data Envelopme nt Analysis 21 Countries, 1995-2001
*Islamic banks are less efficient than conventional banks.
*ROA and ROE ratios are highly correlated for calculating efficiency.
200641
38 Chantapong, Saovanee, "Comparative Study Of Domestic And Foreign Bank Performance in Thailand: The Regression
Analysis", Economic Change and Restructuring 38.1: 63-83, 2005.
39 Bonin, John P., Iftekhar Hasan, Paul Wachtel, "Privatization Matters: Bank Efficiency in Transition Countries", Journal
of Banking & Finance 29.8: 2155-2178, 2005.
40 Berger, Allen N., Emilia Bonaccorsi Di Patti, "Capital Structure And Firm Performance: A New Approach To Testing
No Writer Title Method Time/Place Results Year
20 Cihak, M., Hesse,
Islamic Banks and Financial Stability: An Empirical Analysis Regression 20 Countries, 1993-2004
*Small scale Islamic banks are financially stronger than small scale conventional banks.
*Large scale conventional banks are stronger than large scale Islamic banks.
*Small scale Islamic banks are financially stronger than large scale Islamic banks. *Islamic banks market share is
inefficient on conventional banks financial sustainability. 200842 22 Beck, T., Demirgüç -Kunt, Merrouche Islamic vs. Conventional Banking Business Model, Efficiency and Stability Panel Data Regression 141 Countries, 1995-2007
*There is very little significant differences between Islamic banking and conventional banking in business orientation, efficiency, asset quality or stability
*Islamic banks are more cost-efficient.
*Conventional banks are more cost-efficient but less stable in Islamic banking
dominated markets. *Strong equity structure of
Islamic banks support higher liquidity and brings better performance in crisis period.
201043
42 Cihak, Martin, Heiko Hesse, "Islamic Banks And Financial Stability: An Empirical Analysis." IMF Working Papers: 1-29, 2008.
1. Data and Methodology
In this study, SFHs and its successors, the participation banks, are compared as 1998-2006
and 2006-2014 periods to understand differences in performance. 1998-2006 period covers
shadow banking period for Turkish Islamic banks and 2006-2014 period covers regular
banking period. Also, for 1998-2014 period, Islamic banking group is compared to
conventional banking as control group, to prove transition of SFHs from shadow banking to
regular banking and to research significant differences.
There are researches in the summary literature table that use the same method for control
group. Iqbal used conventional banks as control group for his research on Islamic banking.
Beck et al. compared Islamic banks and conventional banks, too. Many research on Islamic
banking include Turkish banks. Some of the research are given in literature table.
In this research, the main point is the break in the time period in 2006 when 5411 Turkish
banking Act was enacted. 2006 is the year when SFHs became regular banks as participation
banks.
Banking performance analysis mostly use financial ratios for data sets. ROA and ROE ratios
are the common dependent variables for econometric models on bank performance. Almost
all of the researches on the given literature table use ROA and ROE as the key financial
performance criteria.
Bashir, Naceur, Hassan, Cihak, Hesse and Beck, Demirgüç-Kunt and Merrouche consider the
ROA and/or ROE as independent variables for financial performance criteria.
Petekkaya and Curuk found in their research on Turkish financial market that using ROA and
ROE as performance criteria for empirical researches on financial ratios was applicable. In
this research, ROA and ROE are selected as performance criteria and dependent variables.
Monthly balance sheet and income statement data were received from Banking Supervision
and Regulation Agency (BRSA) archives. 198 observation points cover July 1998 - December
198 observation points are regressed for SFHs and participation banks. ROA and ROE are
used as dependent variables and regressed separately. Boyd et al. used more than one
regression for their research on financial markets.
In this research, the least squares multi variable regression method has been applied. General
equality model that Haron referred in his research is diversified in this research. Haron used
dummy variable in his model while referring to Griffiths et al. Haron also used EQTA
(equities/total assets), TDTA (total deposit/total assets), and CoR (Cost of Risk) as other
independent variables. Same variables used in this research are, NPL (non-performing loans/total loans) and NPLCoverage (NPL/provisions) ratios from Beck et al’s research. Other independent variables, TLTA (total loans/total assets), LITA (liquid assets/total assets), and LITD (liquid assets/total deposit) are also used in Samad’s paper. The selected ratios used in 3 different researches explain profitability. Before setting the model, the SECTA
(securities/total assets) ratio was applied, because securities are mostly involved in shadow
banking in literature.44 To explain shadow banking with an econometric model securities ratio must not be excluded from the model.
44 Dinc, Yusuf, Gölge Bankacılıktan Regüler Bankacılığa Geçiş; Türkiye’deki Özel Finans Kurumları
Table 1: Table Showing the Variables Used in the Model
No Financial Ratio Group Source Formula
1 NPL Risk Balance Sheet Non-performing loans/Total Assets
2 NPL Coverage Risk Balance Sheet Non-performing loans/Provisions
3 Cost of Risk (CoR) Risk Balance Sheet Provisions/Total Credits
4 TLTA Risk Balance Sheet Total Loans/Total Assets
5 TDTA Liquidity Balance Sheet Total Deposits/Total Assets
6 EQTA Liquidity Balance Sheet Equities/Total Assets
7 LITA* Liquidity Balance Sheet Liquid Assets*/Total Assets
8 LITD Liquidity Balance Sheet Liquid Assets/Total Deposits
9 SECTA** Liquidity Balance Sheet Securities Portfolio**/Total Assets
10 ROA Profitability Balance Sheet Net Profit/Total Assets
11 ROE Profitability Balance Sheet Net Profit/Equities
12 Shadow Variable (D) Dummy 0 for SFHs
1 for participation banks
* Cash values, Receivables from CB, Interbank Money Mark. Op. Receivables, Receivables from Banks, Stocks and Bonds Ready to be Sold, Stocks and Bonds Receivables from Borrow Market, Reverse Repo Receivables are included in the calculation.
** Stocks and Bonds book, Receivables to be Sold, Fixed Assets, Stocks and Bonds to be Held at Hand until Due Time are included in the calculation.
Constants for variables are excluded from Haron’s model since Haron used the panel data
ROA and ROE ratios are dependent variables. For each dependent variable, the same model is
regressed and the results are reported. Symbols in the model represent;
α constant for the model β vector for the coefficients
σ coefficient for the dynamic variable
γ coefficient for the dummy variable (shadow variable) µ vector for the error vector.
Shadow variable (D) is also the dummy variable. Dummy takes ‘0’ value for July 1998 -
December 2005 and ‘1’ for January 2006 - December 2014 period. This method is used to
prove the transition from shadow banking to regular banking. The given periods represent
shadow banking and regular banking periods in theory. Results of the model will show
whether transition happened or not. Model set dynamic to reduce high correlation of
dependent variables. To regress the dynamic model, the dependent variable is included in the
model as with coefficient as independent variable. Same is done for ROE.
Regression 1: Islamic banking performance
The comparison of special finance houses and participation banks based on 1998-2005 and
2006-2014 data.
Regression 2: Conventional banking performance
Comparison of control group based on 1998-2005 and 2006-2014 data.
2. Estimations and Findings
Descriptive statistics, correlation matrixes, and regression results are driven. Descriptive
2.1. Definitive Statistics and Correlation Matrix
Descriptive statistics for participation banks are given above in the Table 2A. Standard
deviations of ratios are less than 10%. Applied normality test for variables shows that
variables are normally distributed except LITA and LITD ratios for participation banks.
Descriptive statistics for conventional banks are shown in Table 2B. Standard deviations are
less than 10% like participation banks. Normality test shows that the variables are normally
distributed except EQTA ratio.
Skewed and low values are between 0.172 and 0.355. Variables are slightly skewed left and
[image:23.595.67.551.133.316.2]squared mean for both regressions.
Table 2A: 1998-2014 Definitive Statistics For Participation Banks
NPL NPLCOV CoR TCTA TDTA EQTA LITA LITD SECTA ROA ROE
ROA (t-1)
ROE (t-1) N of cases 197 197 197 197 197 197 197 197 197 197 197 197 197 Minimum 0.028 0.329 0.016 0.453 0.614 0.043 0.048 0.059 0.014 -0.035 -0.809 -0.035 -0.809 Maximum 0.312 0.845 0.103 0.821 0.860 0.145 0.215 0.265 0.182 0.028 0.261 0.028 0.261 Mean 0.071 0.597 0.038 0.695 0.767 0.102 0.119 0.156 0.066 0.008 0.065 0.008 0.065 Standard
Dev 0.064 0.107 0.024 0.077 0.062 0.026 0.031 0.040 0.044 0.009 0.125 0.009 0.125 SE Skewness 0.173 0.173 0.173 0.173 0.173 0.173 0.173 0.173 0.173 0.173 0.173 0.173 0.173 Kurtosis(G2) 2.690 -0.361 0.444 0.827 -0.019 -0.733 0.154 -0.321 -0.091 4.632 17.431 4.652 17.402 SE Kurtosis 0.344 0.344 0.344 0.344 0.344 0.344 0.344 0.344 0.344 0.344 0.344 0.345 0.345 SW Statistic 0.642 0.956 0.736 0.905 0.914 0.944 0.991 0.993 0.903 0.877 0.679 0.876 0.678 SW P-Value 0.000 0.000 0.000 0.000 0.000 0.000 0.227 0.535 0.000 0.000 0.000 0.000 0.000
Table 2B: 1998-2014 Definitive Statistics For Deposit Banks
NPL NPLCOV CoR TCTA TDTA EQTA LITA LITD SECTA ROA ROE
ROA (t-1)
ROE (t-1) N of cases 197 197 197 197 197 197 197 197 197 197 197 197 197 Minimum 0.000 0.286 0.010 0.196 0.545 0.071 0.173 0.312 0.112 -0.112 -1.508 -0.112 -1.508 Maximum 0.373 0.909 0.195 0.620 0.681 0.146 0.420 0.696 0.516 0.035 0.406 0.035 0.406 Mean 0.074 0.734 0.05 0.415 0.617 0.112 0.286 0.462 0.284 0.009 0.080 0.009 0.080 Standard
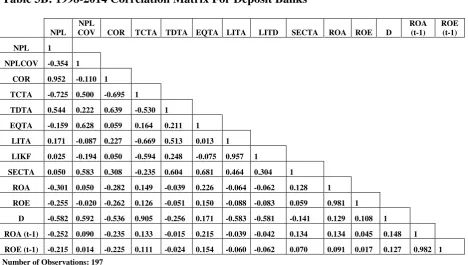
[image:23.595.70.549.348.525.2]Correlation matrices for participation banks and conventional banks are given below in Table
3A and Table 3B. Results show high correlation between ROA and ROE ratios. The results
are normal since the same denominator for calculation of ROA and ROE ratios is the same.
[image:24.595.66.541.220.451.2]Hassan had the similar results for ROA and ROE ratios in his work.
Table 3A: 1998-2014 Correlation Matrix For Participation Banks
NPL
NPL
COV CoR TCTA TDTA EQTA LITA LITD SECTA ROA ROE D
ROA (t-1)
ROE (t-1) NPL 1
NPLCOV -0.708 1 COR 0.956 -0.537 1 TCTA -0.869 0.539 -0.850 1 TDTA 0.297 -0.141 0.341 0.046 1 EQTA -0.151 0.190 -0.090 0.080 -0.312 1
LITA 0.398 -0.082 0.354 -0.458 0.026 0.341 1 LIKF 0.271 -0.026 0.214 -0.444 -0.295 0.408 0.945 1
SECTA 0.727 -0.424 0.795 -0.836 0.034 -0.104 0.048 0.027 1
ROA -0.461 0.365 -0.423 0.390 -0.068 0.505 0.025 0.039 -0.390 1 ROE -0.465 0.369 -0.447 0.347 -0.029 0.322 -0.022 -0.014 -0.339 0.928 1
D -0.566 0.308 -0.637 0.433 -0.664 0.574 0.140 0.342 -0.584 0.318 0.205 1 ROA (t-1) -0.498 0.392 -0.449 0.423 -0.064 0.494 -0.012 0.005 -0.397 0.844 0.798 0.340 1
ROE (t-1) -0.506 0.398 -0.471 0.394 -0.015 0.304 -0.096 -0.086 -0.346 0.809 0.870 0.219 0.927 1 Number of Observations: 197
Table 3B: 1998-2014 Correlation Matrix For Deposit Banks
NPL NPL
COV COR TCTA TDTA EQTA LITA LITD SECTA ROA ROE D
ROA (t-1)
ROE (t-1) NPL 1
NPLCOV -0.354 1 COR 0.952 -0.110 1 TCTA -0.725 0.500 -0.695 1
TDTA 0.544 0.222 0.639 -0.530 1 EQTA -0.159 0.628 0.059 0.164 0.211 1
LITA 0.171 -0.087 0.227 -0.669 0.513 0.013 1 LIKF 0.025 -0.194 0.050 -0.594 0.248 -0.075 0.957 1
SECTA 0.050 0.583 0.308 -0.235 0.604 0.681 0.464 0.304 1
ROA -0.301 0.050 -0.282 0.149 -0.039 0.226 -0.064 -0.062 0.128 1 ROE -0.255 -0.020 -0.262 0.126 -0.051 0.150 -0.088 -0.083 0.059 0.981 1
[image:24.595.68.537.485.750.2]NPL ratios for participation banks are negatively correlated with both of the dependent
variables. Negative correlation of NPL ratios with profitability ratios is comprehensible.
NPLCov ratio is positively correlated with dependent variables. Negative correlation of
NPLCov ratios with NPL ratio put across positive correlation of NPLCov with dependent
variables. It needs to be highlighted that the negative correlation of CoR ratio with dependent
variables is similar to the correlation results of NPL ratio.
TCTA ratio is positively correlated with both dependent variables. Results for TCTA
correlation of TCTA ratios is positively correlated for conventional banks, too. TDTA ratio
for participation banks and conventional banks is negatively correlated with dependent
variables.
Contrary to TDTA ratio, EQTA ratio is positively correlated with dependent variables for
both bank groups. LITA is also positively correlated with dependent variables for
conventional banks. On the other hand, LITA is positively correlated with ROA ratio while it
is negatively correlated with ROE ratio for participation banks. LITA is a ratio for idle
sources for participation banks that shows inactive assets. The situation for conventional
banks is opposite when LITA is on the table. LITA is positively correlated with dependent
variables for conventional banks because conventional banks invest short term securities as
liquid assets.
While liquid assets are idle for participation banks and less profitable for conventional banks,
LITD ratio is negatively correlated for both banking groups since total deposits are expensive
sources.
One of the reasons for high correlation of TCTA ratio with dependent variables for
participation banks is the negative correlation of the SECTA ratio. Because there were no
securities for participation banks to invest. The SECTA ratio is positively correlated for
2.2. Regression Findings
A two-Step process was followed in estimating the multi-variable regression models. Firstly,
the reference model that included all the variables was estimated, and then the variables that
produced meaningless coefficient estimations were eliminated one-by-one, and the model that
gave the most meaningful coefficient values was achieved. Since almost all of the models that
were estimated gave extremely high r-square values, it is observed that the explanation power
of them is high. High F values, and the F values at 1% significance level indicate that the
general significance of the models is also high. The first delay of the dependent variable was
used as the additional explanatory variables in order to consider the dynamic effects of the
time on profitability performance in the models. For this reason, the issue of whether the
successive autocorrelation is a problem or not was tested with Durbin-h Test instead of
Durbin-Watson Test. Although the results of this test show that there is a successive
regression problem in some models, this is not a problem in many other situations. However,
it was also observed that the coefficient estimations of the models with or without successive
regression problem were consistent at an important level. In this context, no drawbacks were
considered in estimating the meaningful model coefficients. The model which had the most
meaningful variables was used. The findings in Table 4 for Participation Banks reached the
meaningful model with similar variables for the ROA and ROE values, which were selected
as performance criteria. For the 1998-2014 period, the NPL and NPLCov ratios in the
regressions of both dependent variables were not at a meaningful level, and these two
independent variables were not included in the most meaningful model.
The regression results of these ratios could not be associated with the correlation results;
however, it is clear for the deposit banks that the effects of the negative correlation value in
NPL on the dependent variables is more limited than those of the Participation Banks. This
situation may be explained with the fact that the active distribution of the deposit banks
consists of less credits than the Participation Banks. Participation Banks are more willing to
convert their resources into credits because there are limited interest-free stocks and bond
access in the market. Deposit Banks canalizing their investments to fixed-yield securities in
an environment in which the inflation is decreasing ensures that the increase in the NPL is
Management Companies make it possible for them to decrease their losses that stem from
NPL. Until recently, this option has not been possible to implement for the Participation
Banks due to the ratification conditions. The positive correlation of the NPL Cov ratio with
dependent variables being lower for Deposit Banks may be explained with the Deposit Banks
traditionally allocating lower provisions for non-performing loans, and holding less idle
resources under this item. The CoR ratio, parallel to the NPL ratio, is negatively correlated
with dependent variables.
In the model that was established with the ROA dependent variable, the additional TDTA,
[image:27.595.72.535.340.708.2]LITA, and LITD ratios could not find a place in the most meaningful model.
Table 4: 1998-2014 Multi-variable Regression estimations of Participation Banks
Dependent Variables
ROA(t) ROE(t)
Independent Variables Coefficient t Test Coefficient t Test Coefficient t Test Coefficient t Test Constant 0.075 2.145 ** 0.085 2.822 *** 1.069 2.570 ** 1.346 3.720 ***
NPL 0.027 0.575 0.759 1.363
NPLCOV 0.005 0.645 0.110 1.138
COR -0.226 -2.184 ** -0.174 -3.450 *** -4.539 -3.563 *** -3.053 -4.623 *** TCTA -0.043 -1.730 * -0.044 -2.168 ** -0.531 -1.725 * -0.641 -2.564 ** TDTA -0.054 -1.396 -0.062 -1.695 * -0.882 -1.895 * -1.041 -2.362 ** EQTA 0.153 5.016 *** 0.146 5.124 *** 1.553 4.378 *** 1.365 4.212 *** LITA 0.290 1.273 0.344 1.634 * 5.145 1.900 * 6.420 2.546 ** LIKF -0.244 -1.418 -0.281 -1.750 * -4.002 -1.963 ** -4.932 -2.570 ** SECTA -0.068 -2.492 ** -0.069 -2.781 *** -0.514 -1.586 -0.602 -2.039 ** Shadow Val. -0.009 -3.946 *** -0.009 -4.158 *** -0.121 -4.619 *** -0.113 -4.583 *** ROA(t-1) 0.622 11.289 *** 0.621 11.537 ***
ROE(t-1) 0.697 14.408 *** 0.696 14.803 ***
R Square 0.761 0.760 0.803 0.801
Flat R Square 0.746 0.749 0.791 0.791
F Test 53.454 65.841 68.572 83.666
[0.000] [0.000]
[0.000] [0.000]
Durbin Watson Test 1.686 1.670 1.596 1.575
Std. Error (1) 0.005 0.005 0.057 0.057
Durbin-h Test 2.209 2.322 4.726 4.971
Observation Number 197 197 197 197 (1) Standard error of the delayed variable.
Meaningful t tests at (***) %1, (**) %5, (*) %10 levels.
Among the findings of the model, the effect direction of the Independent Variables for both
dependent variables is the same as negative or positive. For the most meaningful model, the
percentage change of the CoR ratio is negatively influential on both variables. 1% change in
CoR influences the ROA in -0,174%. The influence of the same variable on ROE is
-3,053%. The negative influence of the increase in the ratio of non-performing loans to total
credits being negatively influential on ROA and ROE is the expected result. The increase in
CoR ratio represents the increase in NPL ratio indirectly. The increase of the share of the NPL
ratio in total credits, on the other hand, means that the profitability of the participation banks
that will be obtained from the basic investment instrument will decrease. The negative
influence of the CoR ratio on profitability may not be merely presented indirectly. The
increase in CoR ratio also represents some of the idle funds of the bank. The funds that are
idle influence the profitability ratios directly by limiting the potential credit investment, and
show their influence with the decrease of the possible incomes that might have otherwise been
received from offering new credits and with the potential increase in the total credits.
According to the findings obtained from TCTA ratio, 1% change in the models established
with ROA Dependent variable have an extremely low influence with -0.044%. According to
the findings obtained, 1% change in the models established with ROE dependent variable of
the TCTA ratio has the value of -0.641%. The increasing values of the TCTA ratio having
negative values for participation banks although they are expected to produce positive results
in profitability ratios shown in the data obtained from the correlation matrix may be explained
with the reverse correlation shown in the correlation matrix of the TCTA ratio with NPL ratio.
In other words, the rate of the total credits to total active assets being negatively correlated
with the rate of the non-performing loans to total active assets is the result of the risk of the
increasing credit level and, parallel to this, having negative influence on profitability ratios.
The positive influence of the increase in the total credits in the correlation matrix of the
profitability of the participation banks is directly related with the working style of Islamic
banking system. The increase in total credits for participation banks, which influences the
profit share income profitability level of the participation banks, which invest mainly on
credits more than stocks and bonds, may explain the positive relation with the credit quality,
which is protected with low NPL level. It is expected that the increase in TCTA ratio
from credits being shared with participation pools explains the negative correlation between
the TDTA ratio and dependent variables. The increase in the participation funds gives rise to
an increase in profit share expenses and thus influences the profitability ratios. The realization
of high profits to participation pools in the decrease trend of the inflation also explains the
negative correlation with the increase in the participation funds and dependent variables.
According to the findings, it has been determined that the model results of the TDTA ratio
have negative influences on the profitability ratios that are selected as the performance
criteria. 1% change in the TDTA ratio has become -0.062% in the model that was established
with ROA dependent variable. This value produced the -1.041% value in the model that was
established with ROE dependent variable. The rate of the participation funds that are
evaluated as expensive resources to total active assets producing negative influences on
performance criteria as parallel to the negative influences on the performance criteria in
correlation matrix is a natural result.
1% change in the EQTA ratio which gives positive relation in the correlation matrix has an
influence in the same direction at a rate of 0.146% when compared with the ROA dependent
variable model results. According to the model findings that was established with ROE
dependent variable, 1% change in EQTA ratio shows an influence in the same direction at a
rate of 1.365%. In other words, 1% increase in EQTA ratio brings increase in profitability
ratios as well. The resources that are provided instead of participation funds being employed
as the source of the investment has a positive influence on profitability and give the Cheap
Resource Effect. The importance of the increase in the use of resources for participation banks
is revealed by the model results. Meanwhile, the increase in EQTA ratio will have a positive
influence on the capital adequacy ratio. The increase in the capital adequacy ratio will
strengthen the financial statement structure. The reinforcement of active growth by resources
rather than participation funds in the assets part will provide a strong relation between the
growth and profitability increase.
1% increase in LITA and LITD ratios influences the ROA dependent variable at 0.344% and
-0.281% levels, respectively. 1% of the same ratios influences the ROE dependent variable at
6.420% and -4.932% rates, respectively. The increasing share of the liquid assets in active
the elasticity they have and thus have positive influences on profitability ratios. This finding
is similar to the findings reported by Beck et al. which is given in the Literature Summary
Table. However, the increasing values of the rates of the liquid assets to total deposits have
negative influences on profitability ratios in a strong manner due to the expensive resources
being held in idle position. The liquid assets which are the most important factors supporting
the liquidity by decreasing the resource costs after providing product ratification in a wider
spectrum that will make it possible to employ participation fund alternative in the resources
part establishing the structure that will hold the profitability/liquidity balance at an optimal
level will produce positive influences. Participation banks whose major resources consist of
participation funds collect funds in participation in both the profit and loss method, i.e. the
Community of Interest Method. In present situation, the rate of the liquid assets in total active
assets may be increased by increasing current accounts, which are cheap assets, and
decreasing the share rates, which are applied to the participation accounts, in favor of the
bank; because the rate of liquid assets to total active assets is in a positive relation with
profitability ratios. In ideal situation, on the other hand, the diversification of resources with
new interest-free instruments and increasing the balance sheet share of the resource
employment will have a positive influence on profitability.
According to the model findings established with ROA dependent variable, the effect of 1%
change in the SECTA ratio is at -0.069%. The findings obtained from the model established
with ROE dependent variable are also in the negative direction. The influence of 1% change
in SECTA ratio on ROE dependent variable is at -0.602% rate. The acquisition of stocks and
bonds being new and some parts of the portfolio of participation banks not being reimbursed
are among the important reasons of the negative influence of this ratio. The weight of the
risks in calculating the capital adequacy ratio being lower for the government-exported stocks
and bonds brings an indirect positive influence.
The basic feeder of the growth is the high capital adequacy ratio. Another important factor
leading to the negative influence of the SECTA ratio is the fact that there are no interest-free
markets in which the participation banks in our country can make use of their stocks and
bonds portfolios in such a way that will bring yield in a relatively short period. This finding
banking practices that are mentioned with stocks and bonds in the world. This may be
considered as an evidence for the investment decision liberty which constitutes the basis of
shadow banking.
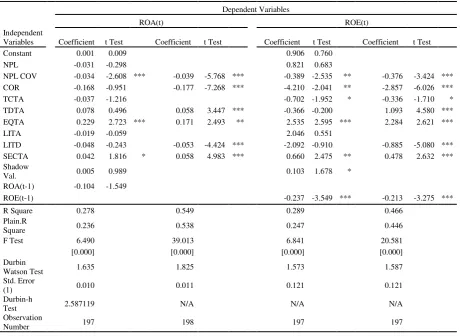
The model results of the Control Group banks are given in Table 5, respectively, for the wide
and narrow exemplification periods. Contrary to the model results obtained for participation
banks, the NPLCov ratio has found a place in the most meaningful models. However, the
constant variable like NPL has not been obtained at a meaningful level in the models. The
LITA ratio has not been detected in the most meaningful models. The TCTA ratio has not
given results at a meaningful level except for one of the models that were established with
[image:31.595.67.528.367.703.2]different variables.
Table 5: 1998-2014 Multivariable Regression Estimations of Deposit Banks
Dependent Variables
ROA(t) ROE(t)
Independent
Variables Coefficient t Test Coefficient t Test Coefficient t Test Coefficient t Test Constant 0.001 0.009
0.906 0.760 NPL -0.031 -0.298
0.821 0.683
NPL COV -0.034 -2.608 *** -0.039 -5.768 *** -0.389 -2.535 ** -0.376 -3.424 *** COR -0.168 -0.951 -0.177 -7.268 *** -4.210 -2.041 ** -2.857 -6.026 *** TCTA -0.037 -1.216
-0.702 -1.952 * -0.336 -1.710 * TDTA 0.078 0.496 0.058 3.447 *** -0.366 -0.200 1.093 4.580 *** EQTA 0.229 2.723 *** 0.171 2.493 ** 2.535 2.595 *** 2.284 2.621 *** LITA -0.019 -0.059
2.046 0.551
LITD -0.048 -0.243 -0.053 -4.424 *** -2.092 -0.910 -0.885 -5.080 *** SECTA 0.042 1.816 * 0.058 4.983 *** 0.660 2.475 ** 0.478 2.632 *** Shadow
Val. 0.005 0.989 0.103 1.678 *
ROA(t-1) -0.104 -1.549
ROE(t-1) -0.237 -3.549 *** -0.213 -3.275 ***
R Square 0.278 0.549
0.289 0.466
Plain.R
Square 0.236 0.538 0.247 0.446
F Test 6.490 39.013
6.841 20.581
[0.000] [0.000]
[0.000] [0.000] Durbin
Watson Test 1.635 1.825 1.573 1.587
Std. Error
(1) 0.010 0.011 0.121 0.121
Durbin-h
Test 2.587119 N/A N/A N/A
Observation
Number 197 198 197 197
(1) Standard error of the delayed variable.
Meaningful t tests at (***) %1, (**) %5, (*) %10 levels.