Munich Personal RePEc Archive
Assessing greenhouse gas emissions in
Estonia’s energy system
Halkos, George and Tzeremes, Panagiotis
Department of Economics, University of Thessaly
August 2015
Online at
https://mpra.ub.uni-muenchen.de/66105/
and
halkos@uth.gr
tzeremes@uth.gr
This paper investigates Estonia’s prospects in meeting the new European Union climate commitments to reduce greenhouse gas (GHG) emissions till 2030 by 40% and 2050 by 80)95% compared to 1990 emission levels. The contribution of this study is twofold. In a first stage, based on organizations reports and using the Long range Energy Alternatives Planning system (LEAP) it constructs seven long)term scenarios to examine Estonia's energy system till 2050. In a second stage, using the Data Envelopment Analysis (DEA) nonparametric approach it evaluates the efficiency of renewable energy commitments in reducing GHG emissions. The findings show that the main challenge for the Estonia policy makers will be the energy policies associated with the renewable energy usage. It appears that under the seven different energy policy scenarios the higher the participation of renewable energy the higher the reduction of greenhouse gas emissions.
: LEAP software; Renewable energy sources; Scenarios analysis; Data Envelopment Analysis; Estonia.
! "
Officially the Estonian Republic restored its independence on 20 August 1991.
In 1992 Estonia signed the United Nations Framework Convention on Climate
Change, ratified it in 1994 and signed the Kyoto Protocol to the UNFCCC in 1998
and ratified it in 2002. Became a member of the North Atlantic Treaty Organization
(NATO) in 2004 and the same year became a member of the European Union (EU). It
joined the Organization for Economic Co)operation and Development (OECD) in
2010, adopted the euro in 2011, and applied for International Energy Agency (IEA)
membership in the same year (Koskela et al., 2007; IEA, 2013).
According to Kyoto Protocol and in the first period of 2008)2012 Estonia had
to mitigate 8% of its greenhouse gas (hereafter GHG) emissions in comparison to
1990 levels. This target has been attained mainly due to considerable restructuring
and reorganization of industry, energy and agriculture sectors. Estonia does not use
the Clean Development Mechanism as it is not a developing country but uses the
other Kyoto Protocol flexible mechanisms, the Joint Implementation and the
International Emissions Trading. Having achieved Kyoto’s target Estonia acts also as
a seller within these two mechanisms (EFNC, 2013).1
As a former member of the Soviet Union, Estonia inherited energy sectors
with a good technical structure. At present, in Estonia, being one of the largest
producers of oil shale in the world, almost all electricity is generated by power plants
using oil shale, which is found in north)eastern Estonia with almost all of country’s
GHG emissions coming from oil shale (Miskinis et al., 2006; IEA 2013). This oil
shale as main natural resource provides Estonia with independence but it is associated
with negative environmental effects (EFNC, 2013). Having electricity production
1
relying mainly on oil shale this requires modernization and more environmental
friendly production methods. In this situation, the Ministry of Economic Affairs and
Communications (MEAC) is responsible for developing energy policy and the
National Development Plan of the Energy Sector till 2020.
In February 2011 the European Commission (EC) reconfirmed EU's long)term
target of abating GHG till 2050 by 80)95% (25% by 2020, 40% by 2030 and 60% by
2040) compared to 1990 emission levels (European Commission, 2011). Under this
decision the ministry started reviewing the National Development Plan, preparing its
energy strategy towards 2030 with an outlook to 2050 (IEA, 2013).
In these lines we aim to construct seven scenarios for the time period 1990)
2050 to assess Estonia’s energy system (demand and supply). Our target is to rely on
official organizations’ reports and propose and compare various energy scenarios for
Estonia meeting the targets of the European Commission in reducing GHG emissions
40% by 2030 and 80)95% by 2050. To achieve this target, we first forecast energy
demand and supply derived from renewable energy sources together with the
associated GHG emissions using the Long range Energy Alternatives Planning system
(LEAP)2. Furthermore in a second stage our study applies a nonparametric estimator
relying on the mathematical method of Data Envelopment Analysis (DEA) to assess
the efficiency of proposed seven scenarios for renewable policies under the European
targets set in 2030 and in 2050.
The structure of the paper is the following. Section 2 summarizes the existing
relative literature while section 3 presents the background of Estonia’s energy system.
2
Section 4 analyzes the proposed scenarios and section 5 discusses the structure of
LEAP software and the proposed nonparametric methodology of Data Envelopment
Analysis. Section 6 presents the derived empirical results and the last section
concludes the paper and discusses the policy implications.
#! $ %
2.1. Relevant studies
There are not many studies related with Estonia’s energy system (demand or
supply). Koskela et al. (2007) model the Estonian electricity supply until 2020 using
the life cycle assessment (LCA) methodology. Three different scenarios are
constructed under the aims of the national energy policy. Lund et al. (2000) aimed to
improve Estonian energy system’s efficiency by replacing the oil shale power
stations. Furthermore, Merikull et al. (2012) examined the oil shale energy associated
with the labor force and offer scenario forecasts in labor demand for the Estonian
energy sector till 2020.
There are various studies concerning the energy systems in the Baltic States
(Lithuania, Latvia and Estonia). Miskinis et al. (2006) examined the role of renewable
energy sources (RES) in the primary energy supply for Baltic countries. Similarly,
Streimikiene and Klevas (2007) considered the use of RES in the Baltic States and
Klevas et al. (2007) presented a review of policies associated with the Baltic States
and evaluated the use of RES. Roos et al. (2012) considered the energy system of
Baltic States under the ground of energy efficiency, renewable consumption and GHG
emissions abatement and Streimikiene and Roos (2009) assessed GHG emissions for
the Baltic States.
Additionally, Streimikiene et al. (2007) presented an overview of results from
relation among the trends, setting energy policy goals and monitoring progress
towards these goals for Baltic States. Finally, Streimikiene (2007) examined the
activities of BASREC (Baltic Sea Region Energy Cooperation) in the Baltic Sea
region for eleven countries (Denmark, Estonia, Finland, Germany, Iceland, Latvia,
Lithuania, Norway, Poland, Russia, and Sweden).
2.2. LEAP studies
LEAP is a modelling tool permitting assessment of the effect of different
energypolicies on energy generation and consumption, together with their associated
emissions (Heaps, 2002). Furthermore, LEAP supports various modelling approaches
which for the demand)side range from bottom)up, end)use accounting techniques to
top)down macroeconomic modelling (Connolly et al., 2010).
Moreover, it is often used to examine national energy systems (demand and/or
supply). Many studies have been published for energy systems. Papagiannis et al.
(2008) analyzed the economic and environmental effects of applying the Energy
Consumption Management System (ECMS), an intelligent demand side management
system, in the European countries. Phdungsilp (2010) presented a study on the options
for energy and carbon development for the city of Bangkok. Kim et al. (2011)
summarized the recent trends in the Republic of Korea’s energy sector.
For the Japanese energy sector, Takase and Suzuki (2011) described the
current trends, including energy demand and supply by fuel and by sector. For China,
Wang et al. (2011) provided insights into the latest development of energy production,
energy consumption and energy strategic planning and policies. Yophy et al. (2011)
overviewed energy supply and demand in Taiwan. For the Greek energy system,
environmental and energy efficiency terms. Another study for Greece by Halkos et al.
(2014) refer to the significant role of lignite in electricity generation stating that the
decline in Greek lignite stations will offer environmental benefits and will help
towards climate change mitigation.
Many researchers using the LEAP software have investigated energy demand
and its effects. For instance, Morales and Sauer (2001) investigated the use of
demand)side management (DSM) measures that might lead to reduction in fossil fuel
demand and thus would mitigate greenhouse gas emissions (GHGs) for Ecuador.
Technical and economic assessments were carried out through the construction of two
scenarios for the residential sector covering the period from 1995 to 2025. Chedid and
Ghajar (2004) examined the effect of energy sector on the Lebanese economy, and
evaluated the possibility of imposing appropriate energy efficiency options in the
building sector for the period 1994)2040. Davoudpour and Ahadi (2006) evaluated the
twin effects of efficiency programs and price reform on energy carriers’ consumption
and GHG emissions reduction in the housing sector of Iran.
Limmeechokchai and Chaosuangaroen (2006) carried out an assessment of
energy savings potential in the Thailand residential sector. Kadian et al. (2007) using
LEAP modeled total energy consumption and the resulting emissions from the
household sector of Delhi. Another research effort for Delhi by Bose and
Srinivasachary (1997) investigated policies to decrease energy use and emissions but
this time for the transport sector. Zhou and Lin (2008) using a comprehensive End)
Use energy model assessed the effect of a number of scenarios of growth in GDP,
energy elasticity, and energy)efficiency progress on energy consumption in Chinese
Mustonen (2010) investigated household energy demand patterns and the
development of electricity demand in a rural village in Lao People’s Democratic
Republic. Wang et al. (2007) using LEAP developed a model to produce three
different CO2 emission scenarios for industry for the time period 2000 to 2030.
Gomez et al. (2014) examined the energy demand (Households, Industry, Services,
Transport and Agriculture) of Kazakhstan. For the densely populated Mexico City
Metropolitan Area (MCMA), Manzini (2006) described three future scenarios up to
the year 2030 for the possible mitigation of CO2 emissions and the resulting costs
when (a) biogenic ethanol blends and oxygenates were replaced with gasoline, and (b)
hybrid, flex fuel and fuel cell technologies were initiated in passenger automobiles,
including sport)utility vehicles and pickups.
From the supply side, the evolution of the energy sector in Mexico for the
period 1996)2025, Islas et al. (2003) examined three scenarios which were subjected
to a cost)benefit analysis. These three scenarios had in common the structure of
electrical power plants in the period 1996)2000. Shin et al. (2005) using LEAP and
the “Technology and Environmental database” examined the costs and effects of
landfill gas electricity generation on energy market and the associated GHGs
emissions in Korea.
Furthermore a study for Korea by Lee et al. (2008) estimated future abatement
potential and costs of CO2 mitigation options for electricity generation facilities. To
assess CO2 emissions reduction potentials of China’s electricity sector, Cai et al.
(2007) employed three scenarios to simulate the different development paths in this
sector. Again for China, Zhang et al. (2007) calculated external costs of electricity
In addition, Mulugetta et al. (2007) constructed power sector scenarios for
Thailand to signify the variety of opportunities and constraints related to conflicting
set of technical and policy options. Wijaya and Limmeechokchai (2009) examined
utilization of geothermal energy scenarios for future electricity supply expansion in
Java)Madura)Bali (Jamali) system which was the largest electricity consumer in
Indonesia. Dagher and Ruble (2011) evaluated possible future paths for Lebanon’s
electric sector. Finally, Pagnarith and Limmeechokchai (2015a, b) considered
electricity supply of Cambodia, Laos, Thailand and Vietnam and the way it could
reduce CO2 emissions under different energy scenarios.
&! ' (
3.1. Overview
In 2013 Estonia’s Total Final Consumption (TFC) was 2870.4 thousand toe
(tonnes of oil equivalent). The residential sector is the largest consumer of energy
with about 32% (934.8 thousand toe) of TFC. The transport sector has almost 27%
(762 thousand toe) share of TFC and industry has approximately 22% (644.5
thousand toe) share of TFC. Services have around 15% (419 thousand toe) and
Agriculture/Forestry and Fishing have almost 4% (110.2 thousand TOE) share of TFC
(Figure 1) (source: Eurostat database).
In Estonia the domestic fuels play an important role in final energy
consumption; the liquid fuels (heavy fuel oil, light fuel oil, motor fuels) represented
32% of fuel in final consumption, with 23% of energy consumption accounted by
heat. Electricity accounted for 21%, solid fuel (coal, coke, oil shale, peat, firewood,
wood chips, wood waste) accounted for 18% and gaseous fuels (natural gas, liquefied
) * Final Energy Consumption by sector (thousand toe) 0,0 1.000,0 2.000,0 3.000,0 4.000,0 5.000,0 6.000,0
1990 1992 1994 1996 1998 2000 2002 2004 2006 2008 2010 2012
I ndus try Tra ns port Re s i de nti a l Agri cul ture /Fore s try a nd Fi s hi ng Se rvi ce s
) #* Final Energy Consumption by Energy
0 10 20 30 40 50 60 70 80 90 100 1 9 9 0 1 9 9 1 1 9 9 2 1 9 9 3 1 9 9 4 1 9 9 5 1 9 9 6 1 9 9 7 1 9 9 8 1 9 9 9 2 0 0 0 2 0 0 1 2 0 0 2 2 0 0 3 2 0 0 4 2 0 0 5 2 0 0 6 2 0 0 7 2 0 0 8 2 0 0 9 2 0 1 0 2 0 1 1 2 0 1 2 2 0 1 3
Sol i d fue l s Li qui d fue l s Ga s e ous fue l s El e ctri ci ty He a t
In 2013, the Total Primary Energy Supply (TPES) in Estonia was 236692 TJ
(tera joules), with oil shale dominating and accounting for about 77% (182549 tera
joules) of TPES. Firewood (including wood chips and wood waste, briguette and
pellets) is the second largest energy source with a 18% TPES. Other fuels (including
black liquor, biogas, municipal waste and other biomass) accounted for 3% (6201 tera
joules) of TPES, and hydro)wind energy and Peat accounted for about 1% each (1996
and 2748 terajoules respectively) of TPES (Figure 3) (source: Statistics Estonia).
3.2. Renewable energy consumption
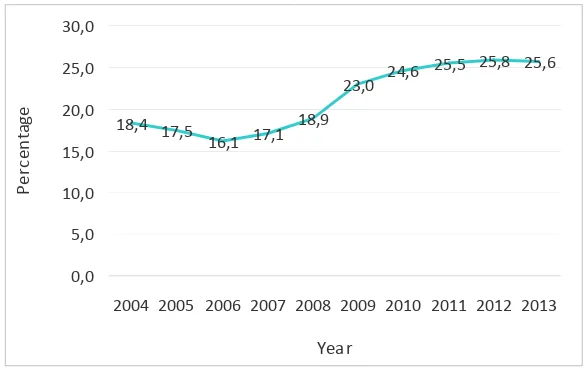
In 2013 renewable energy provided 25.6% of Estonia’s TPES. The changes of
the share of renewable energy sources in gross final energy consumption are shown in
Figure 4. The share of participation of RES in Estonia’s energy balance for 2013 is
22.1% in primary energy production, 15.3% in gross final energy consumption and
13.2% in electricity generation (using wind parks, small hydropower plants and
biomass)woodchips). Heating and cooling (in the residential sector) has the biggest
share of RES with 43.1%, industry has a 10% and transport only a 0.2% (biofuels)
(sources: Eurostat database; Statistics Estonia).
) +* Share of renewable energy in gross final energy consumption
18,4 17,5
16,1 17,1 18,9
23,0 24,6 25,5
25,8 25,6
0,0 5,0 10,0 15,0 20,0 25,0 30,0
2004 2005 2006 2007 2008 2009 2010 2011 2012 2013
Year
P
e
rc
e
n
ta
g
[image:11.595.91.383.572.758.2]3.3 Greenhouse gas emissions in Estonia
In 2012, the total emissions of GHG in CO2 equivalent were 16974.4 thousand
CO2 equivalent tons. The carbon dioxide (CO2) accounted for 88% (14858.2 thousand
CO2 equivalent tons) of GHGs, nitrous oxide (N2O) for 6% (1016.2 thousand CO2
equivalent tons), methane (CH4) for 5% (930.7 thousand CO2 equivalent tons), and the
F)gases (hydrofluorocarbons, perfluorocarbons and sulphur hexafluoride) for 1%
(169.3 thousand CO2 equivalent tons) (Figure 5). The energy sector is the main source
of GHG emissions in Estonia with 77% (16873.83 thousand CO2 equivalent tons).
The significant amount of energy related emissions is caused by the share of oil shale,
which is about 67% of the energy sector total GHG emissions (sources: Eurostat
database; Statistics Estonia).
) ,* Greenhouse gas emission by gas and year
Greenhouse Gas Emissions
0,00 5.000,00 10.000,00 15.000,00 20.000,00 25.000,00 30.000,00 35.000,00 40.000,00 45.000,00
1990 1992 1994 1996 1998 2000 2002 2004 2006 2008 2010 2012
Total emissions
Energy
Manufacturing Industries and Construction Transport
Other Sectors
+!
-In the lines of Halkos and Tzeremes (2015) we propose seven different
scenarios constructed in LEAP under dissimilar options. Namely,
1. Relying on historical trends our first scenario is the !" # " $!# %
&' Following the European Commission (2009)3 our second scenario is ( &) )
' Relying on the assumptions of IEA (2012) our third scenario is * # &) )
4. Based on the assumptions of Greenpeace/EREC (2012)+ our fourth scenario is
&) )
+' , - . the assumptions of European Commission (2011)/ our fifth
scenario is ( &)+)
6. Based on the assumptions of EREC (2010)0 our sixth scenario is ( &)+)
0' Following the assumptions of SEI (2009) the seventh scenario is 1 * &)+)
Apart from the BAU scenario the other proposed scenarios rely on official
organizations’ reports. Three scenarios have as target the year 2030 (EC 2030, IEA
2030, Greenpeace 2030) while the other three scenarios have as target the year 2050
(EC 2050, EREC 2050, SEI 2050). The basic assumptions and all policy options are
presented in Table 1.9
3
http://ec.europa.eu/clima/policies/package/docs/trends_to_2030_update_2009_en.pdf 4
https://www.iea.org/publications/freepublications/publication/ETP2012_free.pdf 5
http://www.greenpeace.org/eu)unit/Global/eu)unit/reports)briefings/2012%20pubs/Pubs%203%20Jul )Sep/E%5BR%5D%202012%20lr.pdf
6
http://www.roadmap2050.eu/attachments/files/Volume1_ExecutiveSummary.pdf 7
http://www.erec.org/fileadmin/erec_docs/Documents/Publications/ReThinking2050_full%20version _final.pdf
8
http://sei)us.org/Publications_PDF/SEI)EuropeShareOfClimateChallenge)09.pdf
9
*Policy options and assumptions for scenario generation
Scenarios Policy options Main assumptions
BAU ) Historical trends continue
EC 2030 Report on . 2
&) ) by EC (2009)
) 36% RES in Electricity ) 12.5% RES in Transport ) 21.3% RES in H&C
) 22.2% RES in Final Demand
IEA 2030 Report on . .
3 by IEA (2012)
) 48% RES in Electricity ) 14% RES in Transport ) 19% RES in H&C
) 27% RES in Final Demand
Greenpeace 2030 Report on .
4 5 " "
by Greenpeace/EREC (2012)
) 61% RES in Electricity ) 17% RES in Transport
(with electricity providing 12%) ) 51% RES in H&C
) 18.5% RES in Industry ) 42.6% RES in Final Demand
EC 2050 Report on . 2
&)+) by EC (2011)
) 97% RES in Electricity ) 65% Electricity in Transport ) 36–39% Electricity in final energy demand
) 55% RES in Final Demand
EREC 2050 Report on 6 7 . &)+)8
9)): - .
"
by EREC (2010)
) 100% RES in Electricity ) 10% Biofuels in Transport ) 41% RES)Electricity in final energy demand
) 45% RES)H&C
) 90)95% RES in Final Demand
SEI 2050 Report on " ; 1
( ( . by SEI
(2009)
) 75% RES in Electricity
) 100% RES, Electricity and H&C in Households and Services ) 60% RES, Electricity and Heat in Industry
) 50% Electricity in Transport
,! .
5.1. LEAP dataset structure
+'9'9' 2 1
In the case of Estonia LEAP’s “tree” consists of a demand dataset illustrating
and demographic indicators. The sources of energy demand data are Statistics of
Estonia10 and Eurostat11.
Table 2 refers to energy demand structure with various activities like number
of households, economic output, fuel shares and energy intensities. More analytically,
it includes sectors, sub)sectors and fuel categories and the data sources. Demand
consists of six sectors. Namely, households, Agriculture and Fishing, Services,
Industry, Transport, Non Specified and the Non)Energy Fuel Use.12
LEAP permits each technology within the seven sectors of demand and supply
by the various sectors to be directly associated with emission factors in the
Technology and Environmental Database (hereafter TED). In this way the constructed
model estimates emissions coming from energy demand relying on various emission
factors and technical characteristics as provided by TED (SEI, 2011).
+'9'&' 2"
The fuel supply part or transformation module of the dataset is separated into
five transformation modules. Namely, and as shown in Table 3, transmission and
distribution losses, own use, electricity generation, heat production and bio)fuel
production. The most important sub)sector of transformation is the “Electricity
generation” which has many functions and features such as capacities, efficiencies,
availabilities and merit orders.
10
http://www.stat.ee/en
11
http://epp.eurostat.ec.europa.eu/portal/page/portal/eurostat/home/
12
#*Energy Demand Structure
- /
"
- 0 )
-Households coal, oil, natural gas,
solar, biomass, heat, peat electricity, Agriculture and
Fishing
coal, oil, heat, natural gas, electricity,
biomass
Services coal, oil, heat, peat,
solar, electricity, biomass, natural gas Industry Iron and Steel, Chemical
and Petrochemical, Non Ferrous Metals, Non
Metallic Minerals, Transport equipment, Paper
Pulp and Printing, Wood and Wood Products, Textile
and Leather, Construction, Mining and Quarrying, Non
Specified
oil, coal, electricity, natural gas, biomass,
heat, peat
Transport Road, Rail, Domestic Air Transport, Transport Inland
Water, Pipelines, Non Specified
oil, coal, electricity, natural gas, biofuel
Non Specified oil, coal, electricity,
natural gas, heat, biomass Non Energy
Use
oil,coal, natural gas, solar
Statistics Estonia, Eurostat
&*LEAP’s fuel supply dataset of Estonia
. 1 )
Transmission and Distribution
Losses
Process Electricity, natural gas
Own Use Process Electricity
Output Fuels Electricity
Electricity
Generation Process Biomass, Wind onshore, Wind offshore,
New Nuclear, Oil, Natural gas, Oil Shale, Peat, Biogas, Small Scale Hydro, Municipal Solid Waste, Oil Shale CHP,
New Oil Shale, Firewood CHP, Solar
Output Fuels Heat
Heat Production
Processes Coal, Natural gas, Oil, Biomass, Oil Shale, Peat, Biogas
Output Fuels Biofuel
Biofuel
Production Processes Biomass
5.2. Data Envelopment Analysis
To assess Estonian energy system’s efficiency it is required to calculate also
the capacity to mitigate GHG emissions under the seven energy policy scenarios
presented earlier (BAU, EC 2030, IEA 2030, Greenpeace 2030, EC 2050, EREC 2050
and SEI 2050). More analytically, it is necessary to assess under the seven proposed
scenarios constructed in LEAP for the period 1990)2050 the calculated energy usage
of RES in the main sectors (demand and supply) of Estonia together with the
associated GHG emissions. This can be achieved by constructing a composite
performance index comparable among both the proposed scenarios and the sectors
into examination for the examined time period 1990)2050. In this way we are able to
assess the renewable energy policy efficiency (REPE) relying on future predictions as
calculated by using LEAP.13
To do so we use the nonparametric approach data envelopment analysis
(DEA), mathematical programming method allowing us to assess a particular method
relying on the calculation of a benchmark frontier – a virtual frontier against which
decision making units (DMUs) are evaluated, using specific inputs and outputs for
each DMU (Daraio and Simar, 2007). Then the efficiency is estimated together with
the distance of each DMU from the calculated (‘efficient’) frontier. In our analysis we
treat as DMU each year which reflects the outcome of the renewable energy policies
adopted among the sectors.
Characteristically, DEA is used in a production framework examining the
efficiency of specific inputs to result to specific outputs. Nevertheless, in our case we
apply a similar method to the one used in Kuosmanen and Kortelainen (2005) and
13
recently Halkos et al. (2015). Kuosmanen and Kortelainen (2005) propose an eco)
efficiency indicator entailing the estimation of the ratio of value added (i.e. good
output/GDP) to environmental degradation or a kind of pressure index (i.e. bad
output/pollutant), coming close to environmental efficiency from a social aspect
rather than from a managerial viewpoint. In this way their proposed index eliminates
primary production factors although they are significant cost factors in carrying out a
technical and economic efficiency analysis (Kuosmanen and Kortelainen 2005, p. 64).
In our analysis the value added to the Estonian energy system (from the
renewable energy policy perceptive) is the energy consumption (measured in millions
Gigajoules) derived from renewable sources. In contrast bad output is Greenhouse
emissions (CO
2, CH4 and N2O) to be released in the future from the Estonia energy
system as predicted by LEAP according to the proposed scenarios. These may be
considered as the result of bad policy designs and lack of adoption and
implementation of renewable energy policies.
Relying on the method by Koopmans (1951) we may classify renewable
energy policy efficiency in a multiple dimensional Euclidean space. In our study we
assume < pollutants (Greenhouse emissions ) CO
2, CH4 and N2O) measured by a set
of variables==
(
=1,...,=)
. Also -denotes energy demand of the sectors consideredderived only from RES (measured in millions Gigajoules). Thus we may identify
pollution generating technology set as:
( )
1, the energy consumption derived from renewable sources w
can be generated also with damage z derived from non)renewable energy sources
<
- = ++
∈ℜ
=
(1)
Expression (1) entails that although and under the specific energy scenarios there is a
our analysis REPE employed by the Estonia energy system will aim to decrease
generated pollution. This efficiency may be symbolized as:
( )
> 3
?
= (2)
In ratio (2) stands for the degradation (damage) function of pollutants <in a
weighted average index of the form:
( )
= = 1 1= + 2 2= + +... = (3)As the problem of proper weighting
( )
on pollutants is important we rely onKuosmanen and Kortelainen (2005) proposing that 2 " weighting
scheme. This applies weights maximizing relative REPE of the industry and the year
under consideration in comparison with the maximum feasible REPE. It can be
estimated as14:
1 1 2 2
1
1 11 2 12 1
2
1 21 2 22 2
1 1 2 2
1 2
max
...
. .
1
1
1.
, ,..., 0
< <
< <
< <
@
@ @ < @<
<
> 3
? ? ?
>
? ? ?
>
? ? ?
>
? ? ?
=
+ + +
≤
+ +
≤
+ +
≤
+ +
≥
⋮
(4)
As a result weights
(
=1,...,<)
are applied to maximize REPE ratiosubject to the condition that the highest achievable efficiency score does not go above
the maximum index value of one when same weights are applied across all other
14
industries and years. It is worth mentioning that weights are not negative, efficiency
score can take values between 0 and 1 with values of 1 indicating efficient renewable
energy policies and values less than implying inefficient policies.
Moreover, the mathematical set)up in (4) is fractional and difficult to be
solved. But following Charnes and Cooper (1962) and Charnes et al. (1978) we are
able to convert the fractional program presented in (4) into a linear program as:
1 1 2
1 2
11 12 1
1 2
1 1 1
21 22 2
1 2
2 2 2
1 2
1 2
1 2
min ...
. .
... 1
... 1,
... 1
, ,..., 0.
< <
< <
< <
@ @ @<
<
@ @ @
<
? ? ?
3
> > >
? ? ?
> > >
? ? ?
> > >
? ? ?
> > >
− = + + +
+ + + ≥
+ + + ≥
+ + + ≥
≥
⋮
(5)
For the purpose of our analysis we apply the distance function approach as
proposed by Shephard (1970) allowing also for variable returns to scale)VRS (Banker
et al. 1984). Since our study relies on a large time period (1990)2050) variations
entailed among pollutants generated from the use of non)RES and in energy demand
from RES are anticipated. In accordance with several researchers the assumption of
VRS is more appropriate when examining the effect of changing energy use over time
2! 1 $
6.1. LEAP results
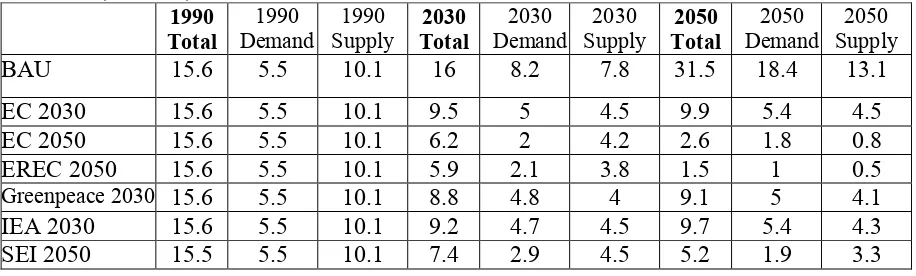
Figure 6 illustrates the reduction of GHG emissions of Estonia’s energy
system by each scenario. Moreover, figure 7 represents the energy demand (sub)
figure 7a) and supply (sub)figure 7b) in the seven scenarios. The best choice for the
target 2030 is Greenpeace 2030 scenario with a 43.6% reduction of GHG emissions
(from 15.6 MtCO2e in 1990 to 8.8 MtCO2e in 2030) and follow the IEA 2030 and EC
2030 scenarios. The reductions are 41% (from 15.6 MtCO2e in 1990 to 9.2 MtCO2e in
2030) and 39.1% (from 15.6 MtCO2e in 1990 to 9.5 MtCO2e in 2030) respectively.
The Greenpeace 2030 scenario and IEA 2030 achieve the target while the EC 2050
scenario almost achieve the target. For 2050, the best scenarios are EREC 2050 and
EC 2050 with 90.4% (from 15.6 MtCO2e in 1990 to 1.5 MtCO2e in 2050) and 83.3%
(from 15.6 MtCO2e in 1990 to 2.6 MtCO2e in 2050) respectively. The SEI 2050
scenario will not achieve the target. The reduction is 66.6% (from 15.6 MtCO2e in
1990 to 5.2 MtCO2e in 2050) (see Table 4).
+* GHG emissions for Estonia’s energy system, demand and supply by
scenario (MtCO2e)
334 1990
Demand
1990 Supply
#4&4 2030 Demand
2030 Supply
#4,4 2050
Demand
2050 Supply
BAU 15.6 5.5 10.1 16 8.2 7.8 31.5 18.4 13.1
EC 2030 15.6 5.5 10.1 9.5 5 4.5 9.9 5.4 4.5
EC 2050 15.6 5.5 10.1 6.2 2 4.2 2.6 1.8 0.8
EREC 2050 15.6 5.5 10.1 5.9 2.1 3.8 1.5 1 0.5
Greenpeace 2030 15.6 5.5 10.1 8.8 4.8 4 9.1 5 4.1
IEA 2030 15.6 5.5 10.1 9.2 4.7 4.5 9.7 5.4 4.3
[image:21.595.84.542.526.664.2]) 2* GHG emissions for Estonia’s energy system by scenario (MtCO2e)15
) 5* Energy demand and supply emissions for Estonia (MtCO2e)
A b
15
/'9'9' ( " 2" . A
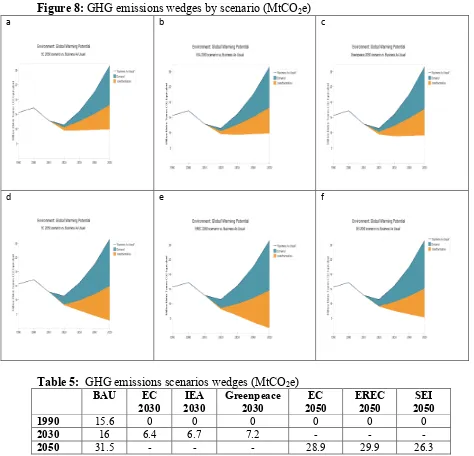
Figure 8 (and Table 5 as summary) illustrate the evolution of emissions in
relation to the business as usual (BAU) scenario. The top line on this chart shows the
BAU scenario for GHG emissions reduction. Below that, a series of “wedges” is
displayed showing the contribution of each scenario to reducing the BAU emissions
down to the final level.
) 6*GHG emissions wedges by scenario (MtCO2e)
a b c
d e f
,* GHG emissions scenarios wedges (MtCO2e)
' 7 8
#4&4 " #4&4
1 #4&4
8 #4,4
$ 8 #4,4
- " #4,4
334 15.6 0 0 0 0 0 0
#4&4 16 6.4 6.7 7.2 ) ) )
#4,4 31.5 ) ) ) 28.9 29.9 26.3
Each scenario plays an important part in the reduction, but the largest
[image:23.595.53.527.236.692.2]7.2 MtCO2e (sub)figure 8c) reducing 44.9% in relation to BAU scenario, followed by
the IEA 2030 scenario with 6.7 MtCO2e (sub)figure 8b) reducing 42% and EC 2030
scenario with 6.4 MtCO2e (sub)figure 8a) and an associated reduction of 40.4%. For
the 2050 year the largest reduction comes from EREC 2050 scenario with 29.9
MtCO2e (sub)figure 8e) reducing 95%, followed by EC 2050 scenario with 28.9
MtCO2e (sub)figure 8d) reducing 91.6% and finally the SEI 2050 scenario with 26.3
MtCO2e (sub)figure 8f) with 83.3% reduction.
6.2. DEA results
Figure 9 shows efficiency estimates under the seven scenarios for the sectors
under examination. When analysing the “Demand 2030” (subfigure 9a) we realise that
the efficiency of the renewable energy policies adopted under the BAU will decrease
over the years. That is their ability to decrease GHG emissions over the examined
period will be weak and for the EC 2030 and IEA 2030 scenario (same line) the
efficiencies are in similar levels. As a result this indicates that the assumptions
especially for BAU will be not sufficient to tackle the increased GHG emissions.
Under the Greenpeace 2030 it appears that the REPE will increase.
Moreover, subfigure 9b represents the efficiency levels for the "Supply 2030".
It appears that under the BAU the REPE will decrease over the examined period
indicating that under this scenario the assumptions of BAU will not succeed on
reducing efficiently the GHG emission in the "Supply 2030". Under the EC 2030 and
IEA 2030 the efficiency will increase over the examined period and only under the
Greenpeace 2030 the efficiency of the Estonia policy scenarios will be efficient in
a Demand 2030 0 0,1 0,2 0,3 0,4 0,5 0,6 0,7 0,8 0,9 1
1990 1992 1994 1996 1998 2000 2002 2004 2006 2008 2010 2012 2014 2016 2018 2020 2022 2024 2026 2028 2030
Ye a rs
E ff ic ie n cy S co re
Bu s i n e s s As Us u a l EC 2030 s ce n a ri o
I EA 2030 s ce n a ri o Gre e n p e a ce 2030 s ce n a ri o
b Supply 2030 0 0,1 0,2 0,3 0,4 0,5 0,6 0,7 0,8 0,9 1
1990 199 2 199 4 199 6 199 8 200 0 200 2 200 4 200 6 200 8
2010 201 2
2014 2016 2018 2020 2022 2024 202 6
2028 203 0
Ye a rs
E ff ic ie n cy S co re
Bu s i n e s s As Us u a l EC 2030 s ce n a ri o
I EA 2030 s ce n a ri o Gre e n p e a ce 2030 s ce n a ri o
c Demand 2050 0 0,05 0,1 0,15 0,2 0,25 0,3 0,35 0,4 0,45 1 9 9 0 1 9 9 3 1 9 9 6 1 9 9 9 2 0 0 2 2 0 0 5 2 0 0 8 2 0 1 1 2 0 1 4 2 0 1 7 2 0 2 0 2 0 2 3 2 0 2 6 2 0 2 9 2 0 3 2 2 0 3 5 2 0 3 8 2 0 4 1 2 0 4 4 2 0 4 7 2 0 5 0
Ye a rs
E ff ic ie n cy S co re
Bu s i n e s s As Us u a l EC 2050 s ce n a ri o
EREC 2050 s ce n a ri o SEI 2050 s ce n a ri o
d Supply 2050 0 0,2 0,4 0,6 0,8 1 1 9 9 0 1 9 9 3 1 9 9 6 1 9 9 9 2 0 0 2 2 0 0 5 2 0 0 8 2 0 1 1 2 0 1 4 2 0 1 7 2 0 2 0 2 0 2 3 2 0 2 6 2 0 2 9 2 0 3 2 2 0 3 5 2 0 3 8 2 0 4 1 2 0 4 4 2 0 4 7 2 0 5 0
Ye a rs
E ff ic ie n cy S co re
Bu s i n e s s As Us u a l EC 2050 s ce n a ri o
EREC 2050 s ce n a ri o SEI 2050 s ce n a ri o
) 3Efficiency plots based on the seven scenarios ( )demand 2030, )
Furthermore, subfigure 9c illustrates the efficiency level for the “Demand
2050”. The BAU scenario will decrease over the years, and the other three (EC 2050,
EREC 2050 and SEI 2050) scenarios will increase over the examined period. From
the “Supply 2050” side, the BAU scenario will decrease slightly over the years, the
SEI 2050 scenario will increase modestly over the period. Under the EC 2050
scenario it appears that the REPE will increase and only under the EREC 2050 the
efficiency of the Estonia policy scenarios will be efficient in reducing the projected
GHG emissions (subfigure 9d).
5! 8
Our paper analyses seven long)term renewable energy scenarios using LEAP
software for Estonia’s energy system. The main aim is to examine and compare
scenarios based on organizations reports and seek a forecast to the 2030 and 2050
horizon in terms of GHG emissions abatement scenarios, in such a way as Estonia to
attain the objectives of abating 40% of GHG emissions by 2030 and 80)95% by 2050
as set by the European Commission. The results show that for the 2030 horizon all
scenarios (EC 2030, IEA 2030 and Greenpeace 2030) with their assumptions achieve
the target (abating 40% compared to 1990 emission levels). Conversely, for 2050
target two of the four scenarios achieve the target for abating 80)95% reduction with
BAU and SEI 2050 failing in satisfying the target.
In a second stage analysis we use DEA methodology and compare for each
scenario the energy demand and the energy supply in order to evaluate the efficiency
of renewable energy commitments on decreasing GHG emissions. The results imply
that efficiency of RES under each scenario will be sufficient to reduce systematically
demand 2050. From the supply side, for 2030 all scenarios will be efficient and for
2050 only EREC 2050 and IEA 2050.
Obviously, Estonia requires energy efficiency and further use of RES as more
than 90% of power is produced by conventional fuels (fossil fuels – oil shale).
Estonian electricity sector demands substantial changes as the external effect of
electricity generation has to be tackled and reduced. Following EERC (2013), the use
of oil shale has to be done in a more sustainable way with expansion of combined heat
and power production and significant increase in the capacity of wind turbines
(onshore and offshore wind farms). The plans consider even the construction of a
nuclear power plant. Use of flue gas abatement methods16 in oil shale pulverized
combustion are also needed (EERC, 2013).
Following EPDC (2012), RES is mainly produced by smaller hydroelectric
power plants and wind farms. Hydroelectric power has modest potential with no
opportunities for larger plants, solar energy potential is small and with no thermal
waters geothermal energy potential is poor. In contrast, Estonia has a great potential
for energy production using biomass and especially wood)based fuels. Additionally,
wind power generation potential in the coastal zone is high (EPDC, 2012).
Economic instruments like energy taxation may be used to internalize external
effects with excise duties and pollution charges to have a serious effect on GHG
emissions. Electricity fuel and electric excises and other energy production and fuel
taxes may be a source of revenues17 to be used in encouraging the various efforts
towards sustainability and implementation of various National Development Plans.
16
For details on abatement methods see Halkos (1993, 1996). 17
$ (
Banker R., Charnes A., Cooper C. (1984).Some Models for Estimating Technical and
Scale Inefficiencies in Data Envelopment Analysis. < . 1 30,
1078) 1092.
Bose R.K. and Srinivasachary V. (1997). Policies to reduce energy use and environmental emissions in the transport sector: A case study of Delphi city.
. 3 25, 1137)1150.
Cai W., Wang C., Wang K., Zhang Y. and Chen J. (2007). Scenario analysis on CO2
emissions reduction potential in China’s electricity sector, . 3 , 35,
6445)6456.
Charnes A. and Cooper W. (1962). Programming with linear fractional functionals.
@ . , 9, 181)186.
Charnes A., Cooper W. and Rhodes E. (1978). Measuring the efficiency of decision
making units. " B " 2, 429)444.
Chedid R.B. and Ghajar R.F. (2004). Assessment of energy efficiency options in the
building sector of Lebanon. . 3 , 32, 647)655.
Connolly D., Lund H., Mathiesen B.V. and Leahy M. (2010). A review of computer tools for analysing the integration of renewable energy into various energy
systems. # 2 . , 87(4), 1059)1082.
Dagher L. and Ruble I. (2011). Modeling Lebanon’s electricity sector: Alternative
scenarios and their implications, . , 36, 4315)4326.
Daraio C. and Simar L. (2007). #2 2 " 2 2
. Springer Science, New York.
Davoudpour H. and Ahadi M.S. (2006). The potential for greenhouse gases mitigation in household sector of Iran: cases of price reform/efficiency improvement and
scenario for 2000–2010. . 3 , 34, 40)49.
EERC (2013). " " $&% 2 & )C&)) C (8 3 2
< " 2 " 3 D . Complied by Estonian Environmental Research Centre and supported by Estonian Environmental Investment Centre Accessible at: http://www. envir.ee/sites/default/files/report
_pursuant_ to_art_3_2_of_mmd_est_15032013.pdf
EFNC (2013). E 1 F @ ( " . The Ministry of
EPDC (2012). . - !1 ( " &)9&8 1 2 (
( . ' Energy Policy and Development Centre, National and
Kapodistrian University of Athens. Report published in the frame of PROMITHEAS)4 EU FP7 Project.
EREC (2010). 6 7 . &)+)8 9)): - . "
. European Renewable Energy Council. Brussels. 76 pp.
http://www.erec.org/fileadmin/erec_docs/Documents/Publications/ReThinking2 050_full%20version_final.pdf
European Commission (2009). . 2 &) ). Luxembourg. 184 pp.
http://ec.europa.eu/clima/policies/package/docs/trends_to_2030_update_2009_e n.pdf
European Commission (2011). # 2 .
-&)+) (08 Mar 2011).
Eurostat database. Accessible at: http://appsso.eurostat.ec.europa.eu
Fang C.Y., Hu J.L. and Lou T.K. (2013). Environment)adjusted total)factor energy
efficiency of Taiwan's service sectors. . 3 63, 1160)1168.
Gómez A., Dopazo C. and Fueyo N. (2014). The causes of the high energy intensity
of the Kazakh economy: A characterization of its energy system. . , 71, 556)
568.
Greenpeace/EREC (2012). . 4 5 " " . Greenpeace/
European Renewable Energy Council, Brussels. 128 pp. Accessible at:
http://www.greenpeace.org/eu)unit/Global/eu)unit/reports)briefings/2012%20 pubs/Pubs% 203%20Jul)Sep/E%5BR%5D%202012%20lr.pdf
Halkos, G. (1993). An evaluation of the direct costs of abatement under the main desulphurisation technologies, MPRA Paper &#,66, University Library of
Munich, Germany. Accessible at: https://ideas.repec.org/p/pra/mprapa/32588.
html
Halkos, G. (1996). Evaluating the direct costs of controlling NOx emissions in Europe, MPRA Paper &&#,&, University Library of Munich, Germany. Accessible at: https://ideas.repec.org/p/pra/mprapa/33253.html
Halkos G. (2014). The Economics of Climate Change Policy: Critical review and future policy directions, MPRA Paper ,26+ , University Library of Munich, Germany.
Halkos G. and Tzeremes N. (2014a) The effect of electricity consumption from renewable sources on countries׳ economic growth levels: Evidence from
advanced, emerging and developing economies, - 2 1"
. - 39, 166)173.
Halkos G. and Tzeremes N. (2014b) Measuring the effect of Kyoto protocol
agreement on countries’ environmental efficiency in CO2 emissions: an
application of conditional full frontiers. B " 3 2" # , 41, 367)
382.
Halkos G., Tzeremes N. & Tzeremes P. (2015). A nonparametric approach for evaluating long)term energy policy scenarios: An application to the Greek energy
system, B " 1 " " 4:3.
Halkos G, and Tzeremes P. (2015). Scenario analysis on greenhouse gas emissions reduction in Southeast Balkans' energy system, MPRA Paper 2,#64, University Library of Munich, Germany.
Heaps C. (2002). Integrated Energy)environment Modelling and LEAP, SEI
Bostonand Tellus Institute, Boston, MA. Available at: http://www.energy
community.org/default.asp?action=47
Honma S. and Hu J.L. (2013). Total)factor energy efficiency for sectors in Japan.
. 1 " 3 ! 8, 130–136.
IEA (2012)' . . 3 . International Energy Agency, Paris.
688 pp. https://www.iea.org/publications/freepublications/publication/ETP 20
12_free.pdf
IEA (2013). Estonia 2013. International Energy Agency, Paris. https://www.iea.org/ publications/freepublications/publication/Estonia2013_free.pdf
Islas J., Manzini F. and Martinez M. (2003). Cost)benefit analysis of energy scenarios
for the Mexican power sector. . , 28, 979)992.
Kadian R., Dahiya R.P. and Garg H.P. (2007). Energy)related emissions and
mitigation opportunities from the household sector in Delhi. . 3 , 35,
6195)6211.
Kim H., Shin E.S. and Chung W.J. (2011). Energy demand and supply, energy
policies, and energy security in the Republic of Korea. . 3 , 39, 6882)
6897.
Klevas V., Streimikiene D. and Grikstaite R. (2007). Sustainable energy in Baltic
States. . 3 , 35(1), 76)90.
Koopmans T.C. (1951). An Analysis of Production as an Efficient Combination of
Koskela S., Seppälä J., Lipp A., Hiltunen M.R., Pold E. and Talve S. (2007). Estonian electricity supply scenarios for 2020 and their environmental performance.
. 3 , 35(7), 3571)3582.
Kuldna P., Peterson K. and Kuhi)Thalfeldt R. (2015). Knowledge brokering on emissions modelling in Strategic Environmental Assessment of Estonian energy
policy with special reference to the LEAP model. *
# -, 54, 55)60.
Kuosmanen T. and Kortelainen M. (2005). Measuring Eco)efficiency of Production
with Data Envelopment Analysis. B " * 2" . 9, 59)72.
Lee S., Park J.W., Song H.J., Maken S. and Filburn T. (2008). Implication of CO2
capture technologies options in electricity generation in Korea. . 3 ,
36, 326)334.
Limmeechokchai B. and Chaosuangaroen P. (2006). Assessment of Energy Saving Potential in the Thai Residential Sector: Long)range Energy Alternatives
Planning Approach. & 2 B * ( G1"
. 2 $1 &))/%H, 21)23, 1)6.
Lund H., Hvelplund F., Ingermann K. and Kask Ü. (2000). Estonian energy system
proposals for the implementation of a cogeneration strategy. . 3 ,
28(10), 729)736.
Manzini F. (2006). Inserting renewable fuels and technologies for transport in Mexico
City Metropolitan Area. * B " A 2 . . , 31, 327)
335.
Meriküll J., Eamets R., Humal K. and Espenberg K. (2012). Power without
manpower: Forecasting labour demand for Estonian energy sector. .
3 , 49, 740)750.
Miskinis V., Slihta G. and Rudi Y. (2006). Bio)energy in the Baltic States: Current
policy and future development. . 3 , 34(18), 3953)3964.
Morales C.A. and Sauer I.L. (2001). Mitigation of greenhouse emissions originating
from energy consumption by the residential sector in Ecuador. .
1" 3, 47)59.
Mulugetta Y., Mantajit N. and Jackson T. (2007). Power sector scenarios for
Thailand: An exploratory analysis 2002–2022. . 3 , 35, 3256)3269.
Mustonen S.M. (2010). Rural energy survey and scenario analysis of village energy
consumption: A case study in Lao People’s Democratic Republic. .
3 , 38, 1040)1048.
Pagnarith K. and Limmeechokchai B. (2015a). Integrated Resource Planning for Long)term Electricity Supply in Selected GMS Countries, Part 1: Energy
Pagnarith K. and Limmeechokchai B. (2015b). Integrated Resource Planning for Long)term Electricity Supply in Selected GMS Countries, Part 2: Environmental
and Economic Impacts. . 1 " 3 !, 10(4), 340)347.
Papagiannis G., Dagoumas A., Lettas N. and Dokopoulos P. (2008). Economic and environmental impacts from the implementation of an intelligent demand side
management system at the European level. . 3 , 36, 163)180.
Phdungsilp A. (2010). Integrated energy and carbon modeling with a decision support
system: Policy scenarios for low)carbon city development in Bangkok. .
3 38, 4808)4817.
Roinioti A., Koroneos C. and Wangensteen I. (2012). Modeling the Greek energy
system: Scenarios of clean energy use and their implications. . 3 , 50,
711)722.
Roos I., Soosaar S., Volkova A. and Streimikene D. (2012). Greenhouse gas emission reduction perspectives in the Baltic States in frames of EU energy and climate
policy. - 2 1" . - 9/(4), 2133)2146.
SEI (2009). , 2 ' " E 1 ( ( . . Stockholm
Environment Institute Stockholm. 68 pp. http://sei)us.org/Publications_PDF/
SEI)EuropeShareOfClimateChallenge)09.pdf
Shepard R.W. (1970). ( 2 3 2" ," , Princeton University
Press, Princeton.
Shin H.C., Park J.W., Kim H.S. and Shin E. (2005). Environmental and economic assessment of landfill gas electricity generation in Korea using LEAP model.
. 3 , 33, 1261)1270.
Statistics Estonia. Accessible at: www.stat.ee
Streimikiene D. (2007). Monitoring of energy supply sustainability in the Baltic Sea
region. . 3 , 35(3), 1658)1674.
Streimikiene D. and Klevas V. (2007). Promotion of renewable energy in Baltic
States. - 2 1" . - , 11(4), 672)687.
Streimikiene D., Ciegis R. and Grundey D. (2007). Energy indicators for sustainable
development in Baltic States. - 2 1" . - ,
11(5), 877)893.
Streimikiene D. and Roos I. (2009). GHG emission trading implications on energy
sector in Baltic States. - 2 1" . - , 13(4), 854)
Wang K., Wang C., Lu X. and Chen, J. (2007). Scenario analysis on CO2 emissions
reduction potential in China’s iron and steel industry. . 3 , 35, 2320)
2335.
Wang Y., Gu A. and Zhang A. (2011). Recent development of energy supply and
demand in China, and energy sector prospects through 2030. . 3 , 39,
6745)6759.
Wijaya M.E. and Limmeechokchai B. (2009). Optimization of Indonesian Geothermal Energy Resources for Future Clean Electricity Supply: A Case of Java)Madura)
Bali System. * B " - . , 4, 13)24.
Yophy H., Jeffrey Y.B. and Peng C.Y. (2011). The long)term forecast of Taiwan’s
energy supply and demand: LEAP model application. . 3 , 39, 6790)
6803.
Zhang Q., Weili T., Yumei W. and Yingxu C. (2007). External costs from electricity
generation of China up to 2030 in energy and abatement scenarios. .
3 , 35, 4295)4304.
Zhou N. and Lin J. (2008). The reality and future scenarios of commercial building