Measurement of Potential Drop Distribution by Scanning the Closely Coupled
Probes Sensor for Sensitive NDE of Shallow Surface Cracks
Hironori Tohmyoh
*1, Takuma Suzuki
*2, S. Reaz Ahmed and Masumi Saka
Department of Nanomechanics, Tohoku University, Sendai 980-8579, JapanHighly sensitive nondestructive evaluation of shallow surface cracks is realized through the distributions of d-c potential drop obtained by scanning the closely coupled four-point-probes sensor around the crack. A methodology is developed for evaluating the depth and length of a three-dimensional surface crack from the potential drop profiles measured across and along the crack, where the experimental result is compared with the corresponding prediction of finite element analysis. The highly sensitive characteristic of the measured profiles is also extended to the potential drop imaging for identifying the location of cracks in a clear pictorial form. It is verified that the method is a powerful tool for characterizing very small fatigue cracks (sub-millimeter depth) on the surface of metallic structures.
[doi:10.2320/matertrans.I-MRA2007841]
(Received August 29, 2006; Accepted February 14, 2007; Published May 25, 2007)
Keywords: nondestructive evaluation, sub-millimeter surface cracks, d-c potential drop, closely coupled probes sensor, finite element analysis
1. Introduction
Nondestructive evaluation (NDE) of cracks is needed for integrity assessment of structures based on fracture mechan-ics, and many techniques, for example, the ultrasonic techniques,1–3) the eddy current techniques,4,5) the electric potential drop techniques,4,6–12)etc., have been reported for NDE of cracks. The electric potential drop techniques are basically classified into two categories—direct current method6–9) and alternating current method,4,10–12) and have been widely used for materials evaluation as well as the quantitative NDE of cracks. Usually, the potential drop techniques use four probes: a set of two probes for current input and output, and another set of two probes for measuring the potential drop. In some special cases, the current induction10,12)and also the measurement of potential drop9)
are performed in a non-contacting manner by utilizing the electromagnetic phenomena. In the case of usual method of evaluation, the potential drop is measured near the crack, and the current input and output probes are located at a large distance from the crack to make a uniform current flow in the region far from the crack; see the work of Johnson as a typical example.6)
The closely coupled probes potential drop (CCPPD) technique using four probes, which are in close proximity to each other, has been proposed by Sakaet al.7)to enhance
the sensitivity of d-c potential drop technique. The technique measures the surface potential drop between the two measuring probes, where the objective crack is located at the center of the four probes, and has been successful for quantitative NDE of smaller 3-D fatigue cracks using a calibration equation derived by the finite element (FE) analysis.8) Recently, the industrial demand of developing
highly sensitive NDE technique, which is capable of accurately characterizing sub-millimeter cracks on the sur-face of structural components, is realized to be quite strong, especially for the early detection of defects. The early
detection of shallow cracks and their quantitative evaluation enable us to remove such small cracks or to repair them in optimum way thereby providing significant economic, reli-ability, and safety benefits.
The present paper describes a scanning approach of d-c potential drop method of testing for realizing sensitive detection as well as precise evaluation of shallow surface cracks in metallic structures. The measurement of potential drop distribution around a crack is performed by scanning the CCPPD sensor, in which both the current supplying and measuring probes are in close proximity to each other. The potential drop profiles across the cracks having various depths and lengths are first obtained by FE method, and then analyzed to develop a suitable methodology for accurately evaluating the depth and length of surface cracks from the potential drop profiles measured across and along the crack. It is found that the method is capable of enhancing the sensitivity to a great extent, especially for the sub-millimeter shallow surface cracks, which, in turn, ensures accurate quantitative characterization of the cracks. The reliability as well as superiority of the present evaluation technique is verified by conducting experiments on simulated 2-D cracks and also on 3-D sub-millimeter fatigue crack together with the potential drop image of the cracked surface.
2. Procedure for Numerical Analysis
The problem of current flow in a material is governed by the Laplace equation, which is given by,
r2¼0; ð1Þ
whereis the electrical potential andr2is the 3-D Laplace operator. The Laplace equation can be solved by FE analysis, andis numerically determined. The region concerned was discretized with the 8-noded isoparametric 3-D solid ele-ments. Very fine meshes are used around the region of the crack as well as around the scanning region; the minimum pitch used for the present discretization was 0.05 mm. Consider the problems of measuring the potential drops at the surface of the cracked block by the conventional potential
*1Corresponding author, E-mail: [email protected]
*2Graduate Student, Tohoku University
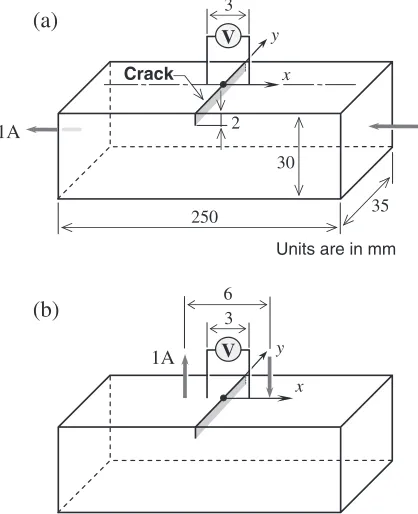
drop technique with uniform current flow and by the CCPPD technique, as illustrated in Figs. 1(a) and (b), respectively. The dimensions of the tested block were 250 mm (length) 35 mm (width) 30 mm (thickness). The block was as-sumed to be isotropic and made of austenitic stainless steel, AISI304. The electrical resistivity of the material was71:5 108m. The shape of the crack was assumed to be 2-D, and the depth of the crack,b, was assumed to be 2 mm. The crack surfaces were assumed to be electrically insulated, and the associated gap between the crack surfaces,w, was set to be zero. In the case of uniform current flow technique, as illustrated in Fig. 1(a), the current probes were fixed at the center of the two opposing lateral surfaces with a separation distance of 250 mm, and the surface potential drops were measured by a set of potential drop measuring probes. On the other hand, in the case of the CCPPD technique, the current probes were located symmetrically external to the potential drop measuring probes, where the distance between the current probes was 6 mm, see Fig. 1(b). In both the tech-niques, the applied current was kept constant at 1 A, and the potential drop measuring probes were separated by a distance of 3 mm. A rectangular coordinate system (x;y) was intro-duced, with an origin located at the center of the crack. In this paper, the surface potential drop measured as a function of probe position is denoted by Vðx;yÞ, where (x;y) is the coordinate at the center of the potential drop measuring probes, and the units ofx,yare in mm. The surface potential drops obtained for the un-cracked block are denoted byV0for both the techniques of interest. The profiles of the surface potential drop in thex-direction aty¼0,Vðx;0Þ V0, were obtained by employing the 3-D FE analysis using MARC,13) where only the potential drop measuring probes were moved along thex-direction for the case of the uniform current flow technique; on the other hand, for the case of the CCPPD
technique, both the potential drop measuring probes and the current probes were moved along the x-direction on the measuring surface.
In order to establish the methodology for evaluating the real cracks by the CCPPD technique, the 3-D cracks having various values of crack length,2a, and crack depth,b, were considered, and the corresponding potential drop distribu-tions around the 3-D cracks were obtained by the 3-D FE analysis.
3. Results of Numerical Analysis
3.1 Potential drop profiles across the surface crack The potential drop profiles along the x-direction,
Vðx;0Þ V0, for both the cases of the CCPPD technique and the conventional potential drop technique with uniform current flow are shown in Fig. 2. As appears from the figure, the profiles of both the potential drop techniques are sym-metric about the center of the crack (x¼0). The potential drops corresponding to five different sensor positions with respect to the crack, denoted by the points, A, B, C, D and E, as shown in Fig. 2, are identified in the profile obtained by scanning the CCPPD sensor, and the corresponding positions of the current and measuring probes are schematically illustrated in the same figure. The point A is obtained when the sensor is located at the positionð0;0Þ, at which the current and potential drop measuring probes are symmetric to the crack, and this value of potential drop,Vð0;0Þ, can be used for evaluating the crack depth.8)The precise measurements of
the potential drops at the points B, C, D and E may be difficult because these are obtained at the positions where a potential drop measuring probe or a current probe is very close to the crack. On the other hand, the profile of the usual technique with uniform current flow has only three peaks A0, B0and C0, which are shown as inset within the graph of Fig. 2. The
(a)
Crack
V
x y
250 35
2 3
Units are in mm
30 1A
V
x y
3 6
1A
(b)
Fig. 1 Schematic of the potential drop technique with uniform current flow (a) and the CCPPD technique (b).
Crack
2 3 3 1
2 3 1
2 3 1
2 3 1 2 3 1
−10 −5 0 5 10
−60
−30 0 30 60 90
−5 0 5
−1 0 1 2
x / mm
V
(
x
, 0)
−
V0
/
µ
V
A B
C D
A' B'
C'
Uniform current Closely coupled
probes flow
E
1: Current input probe, 2: Current output probe,
3: Potential drop measuring probes 3
3
3 3
Fig. 2 The potential drop profiles along thex-direction,Vðx;0Þ V0, for
[image:2.595.64.273.76.333.2] [image:2.595.321.535.76.302.2]value ofVð0;0Þat the point A0may be used for determining
the crack depth, but the associated magnitude of Vð0;0Þ is very small than that at point A obtained by the CCPPD technique. The above comparison reveals that the CCPPD technique is more suitable for the evaluation of cracks than the uniform current flow technique, and it enables us to realize the sensitive NDE of small cracks. Furthermore, the potential drops observed between the points C and D of the CCPPD profile have the possibility to be used for NDE of small cracks, because, in this region, neither the potential drop measuring probes nor the current probes are located very close to the crack, and thus the corresponding potential drops can be stably obtained. In this paper, the potential drop,
Vð0;0Þ, at the point A obtained by the CCPPD technique is denoted byV1, and that obtained at a probe position between the points C and D,Vð2:5;0Þ, is denoted byV2. It is noted that in the earlier studies, only the values ofV1andV0were used for the evaluation of crack depths.7,8) As observed from the
potential drop profile across the crack,V2 is more attractive for the evaluation of small cracks, because the difference in the potential drop, V0V2 is much larger than that of V1V0. Note that no such stable potential drop V2 is appeared in the potential drop profile obtained by the conventional technique with uniform current flow.
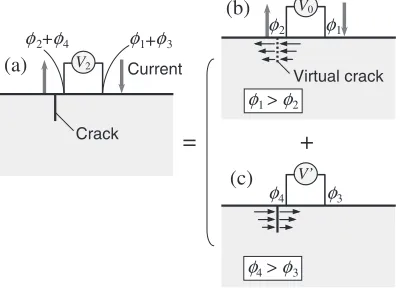
In an attempt to explain the reason whyV2 takes a lower value thanV0, let us consider the 2-D problem of measuring the potential drop,V2, on the surface of a cracked material by the CCPPD sensor, where the crack is located between the current output and a potential drop measuring probe, as shown in Fig. 3(a). The electric crack problem can be divided into two sub-problems as shown in Figs. 3(b) and (c). For the problem of Fig. 3(b), the same constant current as Fig. 3(a) is applied to the un-cracked material and the potential dropV0 (¼12) is obtained at the corresponding positions of the virtual crack, where1and2are the surface potentials of the current input and output sides, respectively (1 > 2). Next, the problem of Fig. 3(c) is treated. The same amount of current density as that obtained from the problem of Fig. 3(b) is passed in the opposite direction from the crack surface, and the potential drop V0 (¼
43) is obtained, where the surface potentials at the right and left potential drop measuring probes are denoted by 3 and4 (4> 3). The potential drop observed in Fig. 3(a), is given by
V2¼ ð1þ3Þ ð2þ4Þ
¼ ð12Þ ð43Þ
¼V0V0<V0: ð2Þ
In this way, it is found thatV2<V0. It is thus realized from eq. (2) that the potential drop obtained for the position of the sensor, for which the crack is located in between a current and a potential drop measuring probes, always takes a lower value than that of a crack free position.
3.2 Methodology for evaluating 3-D cracks
In this section, the 3-D cracks havingwof 0 are considered on the surface of the tested block. The differences of the potential drops for the 3-D cracks of2a¼20mm,V1V0, V0V2andV1V2, are shown in Fig. 4 as a function ofb. The values ofV0V2are larger than those ofV1V0for the range ofbshown in Fig. 4. The slope@ðV0V2Þ=@bis larger than the slope @ðV1V0Þ=@b up to the range ofb<1mm. This means that more accurate and reliable evaluation ofb
can be performed by usingV2 compared to that of V1. On the other hand, the slope @ðV0V2Þ=@b becomes smaller than the slope @ðV1V0Þ=@b for the cracks of b>1mm. However, the slope @ðV1V0Þ=@b shows an increasing characteristic with respect to b for the entire range of interest. Therefore, the value of V1V2 promises the sensitive detection and also the accurate evaluation ofbfor a wide range of interest.
The differences of the potential drops for the 3-D cracks of
b¼0:5mm, V1V0, V0V2 and V1V2, are shown in Fig. 5 as a function of2a. The values ofV0V2andV1V2 are quite larger than that ofV1V0for the range of2ashown in Fig. 5. The values of V1V0, V0V2 andV1V2 are found to be affected by the crack length in the range of 2a<3mm. On the other hand, for the range of2a>3mm, the values of V1V0, V0V2 and V1V2 are almost independent of2a. This fact indicates that the measurements of bothband2awould be possible for very short cracks,i.e., the cracks of2aless than 3 mm in the case ofb¼0:5mm, by using the value ofV0V2and that ofV1V2. On the other hand, the values of2afor long cracks,i.e., for example, the cracks having2a>3mm forb¼0:5mm, should be deter-mined from the potential drop distributions along the crack,
i.e.,y-axis.
The differences in the potential drops along the y-axis,
Vð0;yÞ V0 and Vð2:5;yÞ V0, for the 3-D crack having
2a¼20mm and b¼0:5mm are shown in Fig. 6(a), and (a)
(b)
Virtual crack 1
φ2 φ
φ1 > φ2
φ3
φ4
φ4 > φ3
+
=
(c) Crack
Current
V2
V0
V’
1+ 3 2+φ
φ 4 φ φ
Fig. 3 Superposition in the electric crack problem. Problem (a) is divided into two sub-problems (b) and (c).
0 0.5 1 1.5 2
0 15 30 45 60 75
b / mm
µ
V
V1− V2
V0− V2
V1 − V0
b 20mm
w = 0
Fig. 4 The values ofV1V0,V0V2andV1V2as a function ofbfor
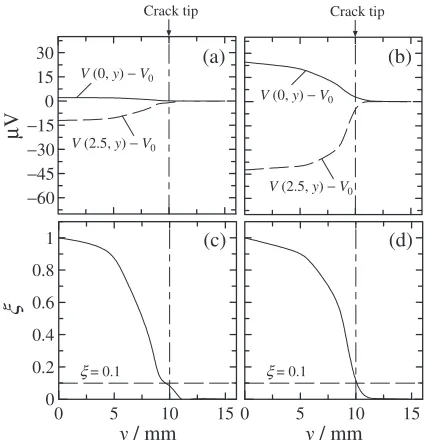
[image:3.595.321.537.75.191.2] [image:3.595.70.272.76.220.2]those for the 3-D crack having 2a¼20mm and b¼2mm are shown in Fig. 6(b). In both the cases of Figs. 6(a) and (b), the crack tip was located aty¼10mm, and at the crack tip, the values ofVð0;10Þ V0andVð2:5;10Þ V0are positive and negative, respectively. Here, let us introduce a parameter defined as follows:
¼Vð0;yÞ Vð2:5;yÞ
V1V2
: ð3Þ
Figures 6(c) and (d) show the variations ofalong the crack length for the potential drop profiles shown in Figs. 6(a) and (b), respectively. Now if we set a value¼0:1, the values of
ain the cases ofb¼0:5and 2 mm are determined as 9.6 and 10.1 mm from Figs. 6(c) and (d), respectively. The accuracy of this methodology for evaluating2awas 4% for the case of
b¼0:5mm, and 1% for the case ofb¼2mm, which shows good agreement with the actual value of2a. If a calibration equation of the difference in the potential drop, preferably in terms ofV1V2, is derived by the FE analysis as a function ofband2a, the value ofbcan readily be obtained from the equation provided that the value of2ais known in advance.
4. Experimental Verification
4.1 Experimental procedure
Two types of cracks, namely, 2-D simulated cracks and 3-D fatigue crack were introduced into the specimens that were machined from austenitic stainless steel, AISI304. Two 2-D cracks were introduced into the plate specimens by electrical discharge machining (EDM); the dimensions of the plate specimens were 250 mm (length)35 mm (width)30 mm (thickness), as shown in Fig. 1(a). The values ofbof the 2-D cracks were 0.5 and 2.0 mm, respectively, and w was 0.1 mm. Figure 7 shows the initial shape and dimensions of the notched sample used to introduce the 3-D fatigue crack. The fatigue crack was developed from the tip of the starter notch [30 mm (length), 3 mm (depth) and 0.5 mm (width)], which was introduced by EDM, by cyclically loading the plate in four-point bending (tension-to-tension) in a dynamic testing machine. The stress ratio defined as the ratio of minimum to maximum loads was 0.1, where the maximum load used was 120 kN. After introducing the fatigue crack, the specimen was machined and polished to remove the initial notch, thereby leaving the fatigue crack in the plate specimen of final dimension (2505016) mm. After the potential drop measurements on the fatigue cracked speci-men were performed, the specispeci-men containing the crack was heat treated using an electric furnace for clearly observing the fatigue crack. Finally, in order to observe the fatigue crack on the fractured surface, the specimen was broken by subjecting cyclic fatigue loading once again with a stress ratio different from that used for preparing the crack.
The photograph of the CCPPD sensor used for measuring the surface potential drop, and the details of the probe arrangements are shown in Figs. 8(a) and (b), respectively. A constant direct current of 1 A was applied to the specimens through the current input and output probes. Potential drops were measured by the measuring probes within the positions of the current input and output probes. The distance of the current probes and the potential drop measuring probes were 6 and 3 mm, respectively, as shown in Fig. 8(b). The CCPPD sensor is small and easy to deal with, which, in turn, enables us to scan the cracked surface to measure the potential drop as a function of sensor position. The contact of every probe to the specimen surface was kept under constant pressure by using springs. Every probe was made of tungsten so that defacement of the probes was prevented.
0 5 10 15 20
0 3 6 9 12 15
2a / mm
µ
V
V1− V2
V0− V2
V1− V0
0.5mm 2a
w = 0
Fig. 5 The values ofV1V0,V0V2andV1V2as a function of2afor
3-D cracks (b¼0:5mm).
−60
−45
−30
−15 0 15 30
µ
V
V (2.5, y) − V0
V (0, y) − V0
Crack tip
V (2.5, y) − V0
V (0, y) − V0
Crack tip
0 5 10 15
y / mm
ξ = 0.1
0 5 10 15
0 0.2 0.4 0.6 0.8 1
y / mm
ξ
ξ = 0.1
(a) (b)
(c) (d)
Fig. 6 The differences in the potential drops along they-axis,Vð0;yÞ V0
andVð2:5;yÞ V0, for the 3-D crack having2a¼20mm andb¼0:5mm
(a), and those having2a¼20mm andb¼2mm (b). The variations of
for (a) and (b) are shown in (c) and (d), respectively.
EDM notch
250 50
Units are in mm
33 30 3
SUS304
16
[image:4.595.326.525.74.187.2] [image:4.595.63.277.245.465.2]4.2 Experimental results of 2-D simulated cracks The measured results of the change in potential drop,
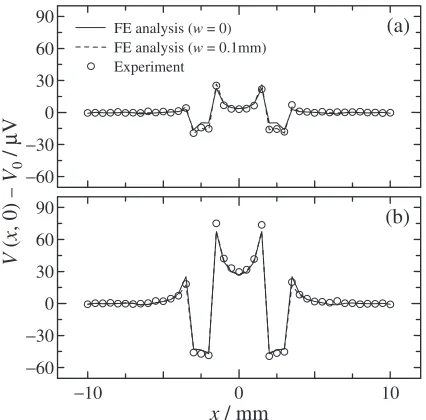
Vðx;0Þ V0, obtained for the simulated 2-D cracks are compared with the corresponding results of FE analysis in Fig. 9. The comparison for the crack, b¼0:5mm and
b¼2mm are shown in Figs. 9(a) and (b), respectively. Here, to investigate the effect ofwon the potential drop profile, the FE analysis was performed for two different conditions of the crack surfaces,i.e.,w¼0andw¼0:1mm. The FE results of the shallow crack (b¼0:5mm), as shown in Fig. 9(a), indicate that the potential drop profiles across the cracks are affected byw, and the profile corresponding tow¼0:1mm shows larger change in the potential drops for the region in between the points B and E than that ofw¼0. On the other hand, the difference between the potential drop profiles of
w¼0:1mm andw¼0 was found to be negligible for the case of relatively deep crack (b¼2mm). These results of FE analysis suggest that the width effect should be taken into account for the NDE of shallow cracks. The potential drop profile measured across the crack for b¼0:5mm and
w¼0:1mm was in good agreement with the FE result of
w¼0:1mm [Fig. 9(a)]. The measured results of the crack,
b¼2mm and w¼0:1mm, were also in good agreement with the corresponding FE results [see Fig. 9(b)], and thus
the reliability and accuracy of the present FE analysis were verified.
4.3 Experimental results of 3-D fatigue crack
The tested 3-D fatigue crack was very difficult to be identified on the plate surface, and the observation of the crack was realized by the penetrant testing. The tested fatigue crack might be tightly closed.14)It is well-known that crack
closure causes a significant problem in NDE of cracks, especially with ultrasonic inspection, and the trials to overcome the crack closure problem are needed for realizing the reliable NDE of cracks.3,15)The photograph of the fatigue crack identified by the penetrant is shown in Fig. 10(a). The potential drop distribution around the fatigue crack obtained by scanning the CCPPD sensor is presented as an image of the cracked surface in Fig. 10(b). Here, the scanning pitch of the sensor was 0.5 mm in both x- and y-directions. Figure 10(b) clearly shows the fatigue crack lying in they -direction. The measured potential drop profile in the x -direction aty¼0for the fatigue crack is shown in Fig. 11(a). The value ofV1,i.e.,Vð0;0Þ, was 101.9mV. And the value of V2 was 89.8mV, which was the average of Vð2:5;0Þ [¼90:1mV] andVð2:5;0Þ[¼89:5mV]. The value ofV1V2 was thus found to be 12.1mV. Figure 11(b) shows the measured potential drop profiles in the y-direction, Vð0;yÞ and Vð2:5;yÞ, for the fatigue crack. Here the profile of
Vð2:5;yÞ is the average of the profiles of Vð2:5;yÞ and
Vð2:5;yÞ. The variation of determined from the profiles
Vð0;yÞandVð2:5;yÞis also shown in Fig. 11(b). Based on the method of determining the crack length given in Section 3.2, the value of 2a for the present fatigue crack was estimated as 14.0 mm from Fig. 11(b).
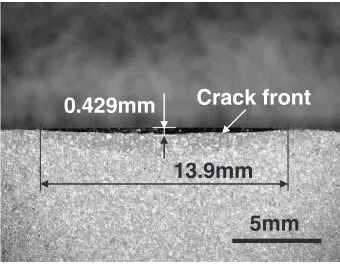
Figure 12 shows the relationship between the potential drop,V1V2andbobtained by FE analysis. In obtaining the relation, the used value of 2a was 14.0 mm as evaluated by the preset technique. Moreover, the value ofwwas set zero in an attempt to simulate the condition of mating surfaces of the fatigue crack. The value of V1V2 obtained from the experiment was 12.1mV, and the corresponding value ofbof the fatigue crack was evaluated as 0.43 mm from the calibration curve shown in Fig. 12. The photograph of the fractured surface of the fatigue cracked specimen is shown in Fig. 13. The value of2aof the tested crack was measured as 13.9 mm. The value of2aevaluated by the present technique (14.0 mm) and that measured were judged to be in good
V 1A
3mm
6mm
Spring CCPPD sensor
(a)
(b)
φ0.4mm
Fig. 8 Photograph of the CCPPD sensor used in the experiments (a), and the details of the probe arrangements (b).
−60
−30 0 30 60 90
−10 0 10
−60
−30 0 30 60 90
x / mm
V
(
x
, 0)
−
V0
/
µ
V
Experiment FE analysis (w = 0) FE analysis (w = 0.1mm)
(a)
(b)
Fig. 9 The comparisons of the values of Vðx;0Þ V0 between the
experimental results and the corresponding results of FE analysis for the simulated 2-D cracks ofb¼0:5mm (a) andb¼2mm (b).
5mm 88.3
µV 111.1
5mm
y
x
0 Fatigue
crack
[image:5.595.313.539.73.184.2](a)
(b)
[image:5.595.55.281.74.175.2] [image:5.595.64.277.228.438.2]agreement because the scanning pitch of the experiment was 0.5 mm. The value of b at the crack center, deepest penetration point, was found to be 0.429 mm on the fractured surface, and thus the value of b evaluated by the present technique was in very good agreement with the direct measurement.
In the present study, to realize the quantitative NDE of shallow cracks, the sensor used has narrow spacing between the probes, for example, the current probes and the potential drop measuring probes distances were 6 mm and 3 mm, respectively. Wider space of the four-point probes achieves deeper penetration depth of current,16)and in contrast, the
micron-scale four-point probes, which have been recently fabricated,17,18)focus the current on the surface. The present
NDE technique based on the potential drop profiles measured by the four-point probes is applicable for NDE of wide range of cracks, micron-scale to several millimeter, provided that the suitable distances of four-point probes are selected.
As far as the inspection of surface cracks in actual structures is concerned, in addition to the typical vertical cracks, obliquely oriented cracks may also be encountered. However, in most of the cases, the shallow cracks are generally found to be vertical to the surface of a material because the surface containing the crack is basically free from shearing stress and is considered as a plane of principal stress, from where the crack starts to grow in a plane perpendicular to the surface. In some special cases, the cracked surface may not be free from shearing stresses, which would lead to obliquely oriented cracks. The present method of imaging would be equally effective for realizing sensitive detection of the oblique cracks as well as predicting the associated crack length on the surface. The crack depth evaluated by the present method will be equivalent to the projected depth, which would be slightly smaller than the actual depth of the oblique crack depending on the inclination angle.
5. Conclusions
A d-c potential drop technique is proposed for highly sensitive detection as well as accurate quantitative evaluation of both the depth and length of shallow surface cracks. In the present approach, the surface potential drop distributions are measured around the crack by scanning the closely coupled four-point probes sensor. It was found from the results of finite element analysis that the variation of potential drop profiles across and along a crack was very sensitive, especially to the sub-millimeter depth cracks. The superiority of the present technique was verified by conducting the quantitative testing of a 3-D fatigue crack on the surface of a stainless steel plate. The fatigue crack was very difficult to be identified by the visual observation, but the potential drop image obtained by scanning the closely coupled probes sensor on the plate surface clearly showed the fatigue crack. The length and depth of the fatigue crack were evaluated by the present technique as 14.0 and 0.43 mm, respectively, and the associated errors of which were found to be less than 0.8%.
Acknowledgments
The authors wish to acknowledge Prof. T. Yonezawa of Tohoku University for his thankful discussion, Prof. T. Hashida for providing the universal testing machine and Mr. T. Sho˜ji for his technical assistance. This work was partly supported by the 21st Century COE Program, ‘‘The
−10 −5 0 5 10
45 60 75 90 105 120
0 1 2
y / mm
V
(0,
y
),
V
(
±
2.5,
y
) /
µ
V
V (0, y)
V (±2.5, y)
ξ = 0.1
ξ ξ
−10 −5 0 5 10
60 75 90 105 120 135
x / mm
V
(
x
, 0) /
µ
V 101.9µV
90.1µV 89.5µV
(a)
[image:6.595.64.274.72.289.2](b)
Fig. 11 The measured potential drop profile in thex-direction aty¼0(a), and those in they-direction,Vð0;yÞandVð2:5;yÞ, (b). The variation of
is also shown in (b).
0 0.2 0.4 0.6 0.8 1
0 6 12 18 24 30 36
b / mm V1
−
V2
/
µ
V FE analysis
Experiment (12.1µV)
0.43mm
b 14mm
[image:6.595.66.276.356.470.2]w = 0
Fig. 12 The relationship between the values ofV1V2andbobtained by
FE analysis for 3-D cracks (2a¼14mm).
0.429mm
5mm
Crack front
13.9mm
[image:6.595.83.253.527.661.2]Exploration of the Frontiers of Mechanical Science Based on Nanotechnology’’.
REFERENCES
1) O. Buck and B. R. Tittmann:Advances in Crack Length Measurement, ed. by C. J. Beevers, (Wasley, West Midlands, UK, 1982) pp. 413–446. 2) K. Date, H. Shimada and N. Ikenaga: NDT Int.15(1982) 315–319. 3) M. Saka and M. A. S. Akanda: J. Nondestr. Eval.23(2004) 49–63. 4) A. M. Lewis, D. H. Michael, M. C. Lugg and R. Collings: J. Appl. Phys.
64(1988) 3777–3784.
5) D. Placko and Dufour: IEEE Trans. Magn.29(1993) 3192–3194. 6) H. H. Johnson: Materials Research and Standards5(1965) 442–445. 7) M. Saka, A. Oouchi and H. Abe´: J. Press. Vess. Tech.118(1996) 198–
202.
8) M. Saka, D. Hirota, H. Abe´ and I. Komura: J. Press. Vess. Tech.120
(1998) 374–378.
9) M. Saka, I. Sato and H. Abe´: NDE&E Int.31(1998) 325–328. 10) R. E. Beissner, C. M. Teller, G. L. Burkhardt, R. T. Smith and J. R.
Barton: ASTM STP772(1981) 428–446.
11) W. D. Dover and L. J. Bond: NDT Int.19(1986) 243–247. 12) Y. Sato, Y. Takeda and T. Shoji: Fatigue Fract. Engng. Mater. Struct.
24(2001) 885–893.
13) MSC.Marc User’s Guide, (MSC.Software Corporation, Santa Ana, CA, 2003).
14) W. Elber: Eng. Fract. Mech.2(1970) 37–45.
15) H. Tohmyoh, M. Saka and Y. Kondo: J. Press. Vess. Tech.129(2007) 103–108.
16) F. Takeo, M. Saka, S. R. Ahmed, S. Hamada and M. Hayakawa: J. Press. Vess. Tech.129(2007) 205–210.
17) M. Nagase, H. Takahashi, Y. Shirakawabe and H. Namatsu: Jpn. J. Appl. Phys.42(2003) 4856–4860.