Dynamic Substance Flow Analysis of Aluminum and Its Alloying Elements
*1Hiroki Hatayama
*2, Hiroyuki Yamada
*3, Ichiro Daigo, Yasunari Matsuno and Yoshihiro Adachi
Department of Materials Engineering, Graduate school of Engineering, The University of Tokyo, Tokyo 113-8656, Japan
Aluminum demand in Japan has grown significantly during the last few decades. For most uses, small amounts of other metals are added to the primary aluminum to make harder alloys, which are classified by the nature and concentrations of their alloying elements. Aluminum scraps from end-of-life products, which are used as raw materials for secondary aluminum, are often mixtures of several alloys. Therefore, not only the amount of scrap but also the concentrations of their alloying elements must be taken into account when assessing the maximum recycle rate of aluminum scraps.
This paper reports a dynamic substance flow analysis of aluminum and its alloying elements in Japan, focusing on the alloying elements Si, Fe, Cu and Mn. We devised eight categories of aluminum end uses and 16 types of aluminum alloys. The amount of each alloy in each end-use category was estimated from statistical data. We then estimated future quantities of discarded aluminum in each of the eight categories using the population balance model. At the same time, we calculated the concentrations of the alloying elements in each of the end uses.
It was estimated that the amount of aluminum recovered in Japan would be about 1800 kt in 2050, which is 2.12 times that recovered in 1990. Calculated concentrations of alloying elements in aluminum scraps showed good correlation with those of the measured data.
[doi:10.2320/matertrans.MRA2007102]
(Received May 1, 2007; Accepted July 3, 2007; Published August 22, 2007)
Keywords: material flow analysis, substance flow analysis, aluminum alloy, alloy content, aluminum scraps, population balance model
1. Introduction
Increasing public concern for environmental protection and resource conservation has generated interest in the recycling of materials. In Japan, technological development and legislation that protects the environment have increased the recycling of various materials such as aluminum, steel, concrete and wood from end-of-life products. Therefore, materials in the products accumulated in a society will become raw materials for recycling in the future. Kleijn et al.1)and Van der Voetet al.2)developed a dynamic approach for estimating the material outflow (as end-of-life products) from in-use stock. Using similar approaches, previous research has estimated the amount of discarded material likely to be recovered in the future, in particular focusing on steel (Kakudateet al., Daigoet al.),3,4)construction minerals (Hashimotoet al.),5)consumer durables (Tasakiet al.)6)and TVs (Yamadaet al.).7)
This paper focuses on the recyclability of aluminum, which is one of the most widely used metals in Japan. Aluminum is a versatile metal, owing to various properties such as its light weight, high corrosion resistance and good formability. These properties are fostered by adding alloying elements; Si, Fe, Cu, Mn, Mg, Zn, and so on. R ecycling of aluminum is important as the energy consumed in producing secondary aluminum is much less than that used in producing primary aluminum. In producing secondary aluminum from scraps, the alloying elements in the scraps are usually reused into the recycled alloys and at the same time some alloying elements are newly added in order to satisfy standards on chemical composition. On the other hand, excess presence of the alloying elements would require additional primary aluminum for dilution because some alloying elements
cannot be removed at secondary smelters. Therefore the chemical composition of scraps should be taken into account in assessing the recyclability of aluminum. These features of aluminum recycling require MFA/SFA (material flow analy-sis/substance flow analysis) to be conducted for each of the respective alloys. A material flow analysis studying the limitations caused by the presence of contaminants in recycling has been conducted for Cu in steel (Kakudate et al., Daigo et al.)3,4) and for Ni and Cr in stainless steel (Igarashiet al.).8)
A static material flow analysis of aluminum, which shows annual aluminum flow in Japan, has already been conducted by Umezawa et al.9)However, there has been no dynamic analysis conducted because of the lack of data on such factors as product lifetime and demand for each end use. The objective of this paper was to analyze dynamically the substance flow of aluminum and its alloying elements. In order to do this, statistical data were analyzed in advance, as there were insufficient data for the analysis.
2. Data Preparation
2.1 Consumption by end use
Published statistics10) provide information about alumi-num demand in Japan classified into about 30 end uses. In this paper, end uses were aggregated into eight categories, and demand data on these eight end uses from 1960 to 2003 were prepared (Table 1).
These data took into account the indirect trade of aluminum and industrial scraps, after allocation (described in 2.3). The indirect trade is the difference between statistical domestic demand and actual consumption in Japan, as goods are manufactured in Japan and consumed in other countries and vice versa. In this study, automobile export was taken into account because it is supposed to have much larger impact than other indirect trades. We calculated the amount of aluminum included in exported automobiles as follows. First, the average consumption of aluminum in an automobile *1This Paper was Originally Published in Japanese in J. Japan Inst. Metals
70(2006) 975–980.
*2Graduate Student, The University of Tokyo
*3Graduate Student, The University of Tokyo, Present address: New
was calculated by dividing the statistical demand for aluminum in the automobile category by the annual auto-mobile production.11)Actual domestic consumption was then calculated by multiplying the average consumption of aluminum by the annual registration of new automobiles.11) And this study did not take into account other indirect trades. In other end uses (e.g. electric communication machinery), there are many kinds of products (e.g. TV, refrigerator, washing machine), therefore it is difficult to estimate the average aluminum consumption in each end uses.
Industrial scraps were also taken into account for mill products, which are manufactured from wrought alloy. Fabricating mill products generates industrial scraps as either mill ends or irregular products. The amount of industrial scrap was calculated by multiplying the demand for mill products by the yield rate of scraps from milling processes. We assumed that the industrial scraps were generated in the processing year. The yield rates for industrial scraps from various end-use manufacturing processes were obtained from the literature.12)
It should be also noted that all the statistical data in this study related to the fiscal year.
2.2 Production by alloy
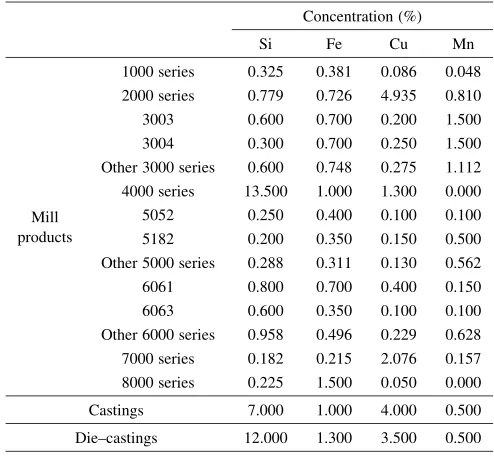
Aluminum alloys include many kinds of alloying ele-ments. Four of these alloying elements, Si, Fe, Cu, and Mn, were considered in this study because they each have the potential to restrict aluminum recycling. The production of 42 types of aluminum alloys in mill products, castings and die-castings can be obtained from published statistics.10)We prepared data on production according to alloy type from 1974 to 2003 by aggregating some alloy types that have similar chemical compositions or that have relatively small production (Table 2). It was assumed that the concentration of every alloying element was equal to the upper limit described in the industrial standards.13)The components of aggregated alloy types were calculated as the weighted average according to production volume. The compositions of wrought alloys calculated from data obtained in 2003 are shown in Table 2. Alloy compositions were calculated from data obtained in 1974 to 2002 using the same method, and little fluctuation was found compared with those of 2003. Therefore, the compositions of wrought alloys from 1960 onwards were represented by those of 2003. As for aluminum castings, their composition was assumed to be equal to that of AC2Balloy because it is the most widely used casting alloy.
The composition of die-castings was assumed to be equal to that ofADC12alloy for the same reason.14)
2.3 Data development — demand by both end use and alloy
Data on demand according to end use and on production according to alloy were obtained from the available statistics. Data on demand by both end use and alloy were determined from these two sets of data using the following procedure.
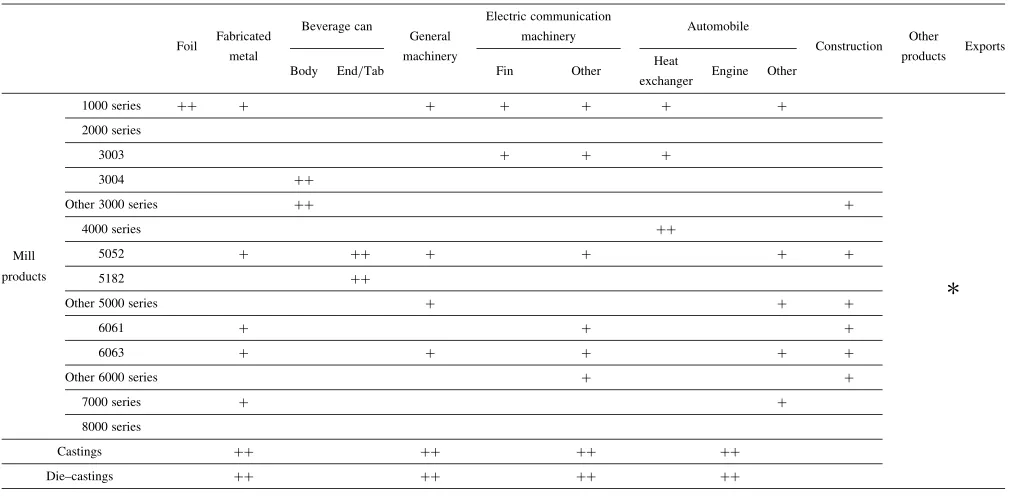
[image:2.595.49.290.82.218.2]Table 3 is a matrix representing the relationship between various end uses and the alloys used for them. The X (row sum) and Y (column sum) values in the matrix can be obtained from statistics, where X is the demand by alloy and Y is the demand by end use. The value of each matrix element was determined by demand by end use (column) and demand by alloy (row), estimated by the variables X and Y. As the first step in this estimation, the alloy types used for each end use were determined from the literature.15) The matrix elements were then classified into two types, ‘‘identifiable elements’’ and ‘‘inferable elements’’. An iden-tifiable element was an element whose value could be identified because there was a reliable relationship between end use and alloy. For example, only 1000 series alloys were used in products in the ‘‘Foil’’ end-use category. In this case, the elementa1000 series Foilwas an identifiable element and the value was defined as being equal to YFoil, while the other elements in that column were set to 0. An inferable element was an element whose value could not be identified, as the alloy used in the end use was only assumed. Values of the
Table 1 End-use classifications for aluminum.
End use Examples
Foil foil
Fabricated metal household utensils, furniture Beverage can beverage cans
General machinery machinery for agriculture and fishery Electric communication
machinery
home electronics appliances, audio machinery
Automobile automobiles (engines, heat exchangers etc.)
Construction window frames, doors
Other products precision machinery, ships, aircraft
Table 2 Chemical compositions of aluminum alloys (2003 fiscal year).
Concentration (%)
Si Fe Cu Mn
1000 series 0.325 0.381 0.086 0.048 2000 series 0.779 0.726 4.935 0.810 3003 0.600 0.700 0.200 1.500 3004 0.300 0.700 0.250 1.500 Other 3000 series 0.600 0.748 0.275 1.112 4000 series 13.500 1.000 1.300 0.000
Mill 5052 0.250 0.400 0.100 0.100
products 5182 0.200 0.350 0.150 0.500
Other 5000 series 0.288 0.311 0.130 0.562 6061 0.800 0.700 0.400 0.150 6063 0.600 0.350 0.100 0.100 Other 6000 series 0.958 0.496 0.229 0.628 7000 series 0.182 0.215 2.076 0.157 8000 series 0.225 1.500 0.050 0.000
Castings 7.000 1.000 4.000 0.500
[image:2.595.302.549.84.312.2]Die–castings 12.000 1.300 3.500 0.500
Table 3 Matrix of demand by end use and alloy.
End use1 . . . End usem Total
Alloy1 a11 . . . a1m X1
.. .
.. .
.. .
.. .
Alloyn an1 . . . anm Xn
[image:2.595.303.550.349.415.2]inferable elements were defined according to the allocation method described later. Table 4 shows the identification of various elements based on the literature: ++ denotes an identifiable element, + denotes an inferable element, and blank elements are 0. For the assumption of which alloys were used in the ‘‘Beverage can’’ category, alloy 3004 was assumed to be used in the can body and alloy 5182 was assumed to be used in the can end. The excess of demand over production for alloys 3004 and 5182 was made up for by other 3000 series alloys and the 5052 alloy.
The allocated values for the various elements should show no discrepancy between row and column totals. In this paper, demand by end use (Yi) was allocated to each of its component elements according to the proportion of alloy production, Xi. However, there was difficulty in making a valid allocation in ‘‘Exports’’ and ‘‘Other products’’ catego-ries because the alloy types used in these end-use categocatego-ries could not be identified from any literature. Therefore, the values of elements belonging to these two end uses were determined from the row sum,Xi, after the allocation in the other columns was complete. In the second step, every value of the identifiable element was defined. At the same time, the value of alloy production for the inferable elements (repre-sented asXi0) was calculated by subtracting the values of each identifiable element from the total alloy production,Xi. The value of end-use demand for the inferable elements (repre-sented as Yi0) was calculated in the same way. In the third step,Yi0 was allocated into respective inferable elements in the column, according to the proportion of Xi0. The second and the third steps were applied to all end-use categories, except ‘‘Exports’’ and ‘‘Other products’’, defining all values in these columns. Then in the final step, the elements of the ‘‘Exports’’ and ‘‘Other products’’ end-use columns were
defined. In each row, the amount of alloy used for each of the two end uses was derived by subtracting all the fixed values from the total alloy production, Xi. The derived value was then divided into the two end uses according to the ratio of their end-use demand.
Statistics are kept of wrought alloy production, recording its shape, sheet and extrusion.10)The allocation method was applied individually to two of the shapes, and the total was calculated. Table 5 shows the estimated demand by both end use and alloy from the 2003 data to which the method was applied. It should be noted that there was a difference of 2% between the grand total of alloy production (sum ofXi) and the grand total of end-use demand (sum of Yi) in Table 5. This difference was adjusted in the ‘‘Exports’’ and ‘‘Other products’’ categories.
3. Quantitative and Qualitative Analysis on Scraps
The amounts of aluminum discarded from various end uses were estimated using dynamic analysis (Population Balance Model: PBM).3)
[image:3.595.46.552.83.331.2]We defined some of the parameters of a product’s lifetime, as this was necessary for the dynamic analysis. For the ‘‘Foil’’ category, a product lifetime was not considered because little aluminum is recovered from foil products. For ‘‘Fabricated metal’’, ‘‘General machinery’’, ‘‘Electric communication machinery’’ and ‘‘Other products’’ categories, the mean lifetimes were obtained from the literature.12)Other param-eters of product lifetime were based on past research on consumer durables (Tasaki et al.).6) Beverage cans were assumed to be discarded in the production year because their mean lifetime was less than one year. For the ‘‘Automobile’’ category, a lifetime distribution was defined from the
Table 4 Identifiable and inferable elements defined by end use and alloy.
Foil Fabricated
metal
Beverage can
General machinery
Electric communication
machinery Automobile
Construction Other
products Exports
Body End/Tab Fin Other Heat
exchanger Engine Other
1000 series ++ + + + + + +
2000 series
3003 + + +
3004 ++
Other 3000 series ++ +
4000 series ++
Mill 5052 + ++ + + + +
products 5182 ++
Other 5000 series + + +
6061 + + +
6063 + + + + +
Other 6000 series + +
7000 series + +
8000 series
Castings ++ ++ ++ ++
Die–castings ++ ++ ++ ++
empirical data. The estimated figures were verified from new registrations and disposals.11,16) Window frames were the main product in the ‘‘Construction’’ category, therefore the lifetime of products in this category was represented by that of dwellings.17)
Considering the aluminum input into society in a given year, the amount of aluminum likely to be discarded in later years can be calculated by multiplying the input by the disposal probability, where disposal probability was defined according to the assumed lifetime distribution. By calculating the total amount of discarded aluminum that originated from aluminum input in the past, the amount of aluminum discarded in a certain year in the future can be estimated. This study estimated the amount of discarded aluminum likely to be discarded each year until 2050.
After the estimation of discarded aluminum, the amount of recovered aluminum was estimated based on the collection rate of each end-use category. The numerator of the
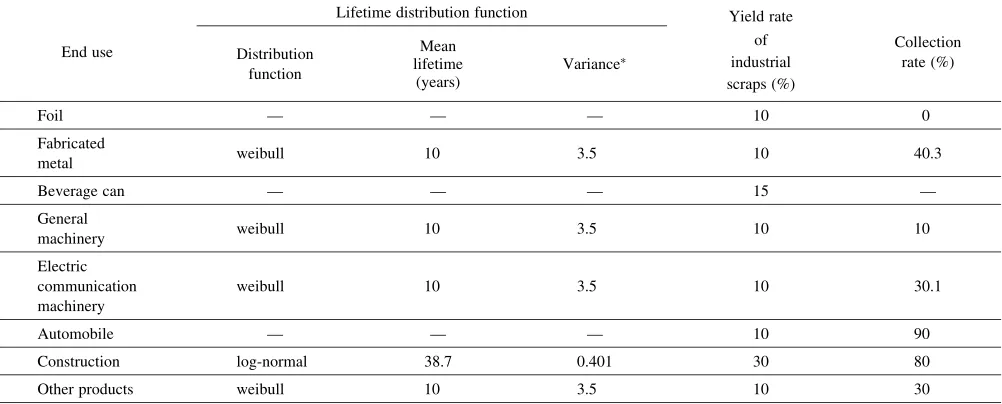
collection rate is the amount of aluminum collected and consumed as aluminum scraps in Japan, and the denominator of the rate is the amount of discarded aluminum. Aluminum which is merged into general waste or exported as used goods is not included in the collection rate. For beverage cans, published data18)on consumption and recovery were used in this study. The collection rates of other end uses were obtained from the literature.12)The parameters assumed for this study are shown in Table 6. In the dynamic analysis, demand for each end use from 2004 onwards was assumed to remain the same as the demand in 2003. Other parameters, such as the lifetime distribution function, the yield rate, the indirect trade and the collection rate were also assumed to be constant in the future, as shown in Table 6.
[image:4.595.47.551.92.302.2]Aluminum is collected from end-of-life products for recycling. However, collected aluminum cannot be separated into its alloy types. Furthermore, once alloyed with alumi-num, some of the alloying elements cannot be removed from
Table 5 Demand for mill products by end use and alloy (2003 fiscal year).
unit: (t)
Foil Fabricated
metal
Beverage can
General machinery
Electric communication
machinery Automobile
Construction Other
products Exports
Body End/Tab Fin Other Heat
exchanger Engine Other
Total
1000 series 158207 73847 0 0 7656 36145 42700 85317 0 28269 0 3520 4036 439697
2000 series 0 0 0 0 0 0 0 0 0 0 0 10538 12086 22624
3003 0 0 0 0 0 2507 3323 15238 0 0 0 5535 6347 32950
3004 0 0 267502 0 0 0 0 0 0 0 0 1545 1771 270818
Other 3000 series 0 0 21254 0 0 0 0 0 0 0 26388 67915 77886 193443
4000 series 0 0 0 0 0 0 0 28492 0 0 0 0 0 28492
Mill 5052 0 36932 0 18059 4479 0 20867 0 0 14037 19835 16877 19355 150440
products 5182 0 0 0 117406 0 0 0 0 0 0 0 26 29 117461
Other 5000 series 0 0 0 0 4871 0 0 0 0 10198 14409 39339 45114 113931
6061 0 873 0 0 0 0 652 0 0 0 18260 4828 5537 30150
6063 0 28364 0 0 73075 0 21170 0 0 87805 593320 17 19 803770
Other 6000 series 0 0 0 0 0 0 1144 0 0 0 32071 10384 11908 55507
7000 series 0 5817 0 0 0 0 0 0 0 4111 0 12660 14519 37107
8000 series 0 0 0 0 0 0 0 0 0 0 0 53026 60811 113837
Total 158207 145833 288756 135465 90080 42300 89856 129047 0 144421 704283 220918 253353
Table 6 Lifetime distribution, yield rate and collection rate in each end-use category.
Lifetime distribution function Yield rate
End use Distribution Mean of Collection
lifetime Variance industrial rate (%)
function (years)
scraps (%)
Foil — — — 10 0
Fabricated
metal weibull 10 3.5 10 40.3
Beverage can — — — 15 —
General
machinery weibull 10 3.5 10 10
Electric communication machinery
weibull 10 3.5 10 30.1
Automobile — — — 10 90
Construction log-normal 38.7 0.401 30 80
Other products weibull 10 3.5 10 30
[image:4.595.48.549.339.541.2]their alloys (because of technical and cost limitations). These facts need to be considered when analyzing the substance flow of aluminum alloying elements. Therefore, we assumed that aluminum from end-of-life products was collected without alloy-by-alloy separation, for all end uses except the ‘‘Automobile’’ category. We assumed that aluminum contained in end-of-life automobiles was collected using a rough separation between mill products used in the heat exchanger and the body, and castings used in the engine. Using this assumption, the chemical composition of scrap generated from every end use was calculated from the results of the PBM as a weighted average of the alloy compositions shown in Table 2. It was also assumed that the proportion of each wrought alloy in the total production of mill products for each end use would be constant over time. This means that the weighted average of wrought alloys calculated for each end use was assumed to be the same as that in 2003.
4. Results
Figure 1 shows the estimated amount of aluminum predicted to be recovered in Japan until 2050. According to the analysis, the amount of aluminum recovered in 2000 would be 1.53 times as large as that in 1990, and in 2050, 2.12 times. The increase in recovered aluminum was due to the increase in discarded aluminum, especially from ‘‘Automo-bile’’ and ‘‘Construction’’ end uses. The amounts of statistical scrap recovery from 1990 to 2000 are also shown in Fig. 1.19) This estimation based on parameters in Table 6 fits well with the amount of statistical scrap recovery.
The compositions of scrap aluminum were estimated for every year until 2050, as shown in Table 7. For the ‘‘Beverage can’’ (Table 7(b)) and ‘‘Construction’’ (Table 7(g)) categories, no fluctuation in composition was observed because only mill products were used for these two end uses. For the remaining five end uses (also disregarding the ‘‘Automobile (engine)’’ category), concentrations of the alloying elements would decrease over time because of an increase in the proportion of mill products used in finished products.
Estimated compositions of scrap were compared with measured data, in order to validate the allocation method adopted in this paper. The measured data were obtained from the literature and from an investigation of a secondary smelter.14,20) The results of this comparison are shown in
0 200 400 600 800 1000 1200 1400 1600 1800 2000
1990 2000 2010 2020 2030 2040 2050 Fiscal year
Amount of scrap recovery / kt
Industrial scrap Other products
Electric communication machinery Construction
General machinery Automobile
Fabricated metal Beverage can
Statistics
[image:5.595.49.290.73.214.2]Fig. 1 Estimation of scrap recovery.
Table 7 Chemical compositions of scraps discarded from (a) Fabricated metal, (b) Beverage can, (c) General machinery, (d) Electric communi-cation machinery, (e) Automobile (mill products), (f) Automobile (engine), (g) Construction and (h) Other products end-use categories.
(a)
Fiscal year 2000 2010 2020 2030 2040 2050
Si 0.764 0.773 0.771 0.770 0.770 0.770
Concentration Fe 0.410 0.411 0.410 0.410 0.410 0.410 (%) Cu 0.342 0.344 0.343 0.342 0.342 0.342
Mn 0.096 0.096 0.096 0.096 0.096 0.096
(b)
Fiscal year 2000 2010 2020 2030 2040 2050
Si 0.285 0.285 0.285 0.285 0.285 0.285
Concentration Fe 0.593 0.593 0.593 0.593 0.593 0.593 (%) Cu 0.217 0.217 0.217 0.217 0.217 0.217
Mn 1.144 1.144 1.144 1.144 1.144 1.144
(c)
Fiscal year 2000 2010 2020 2030 2040 2050
Si 6.400 5.562 5.299 5.297 5.297 5.297
Concentration Fe 0.856 0.778 0.755 0.754 0.754 0.754 (%) Cu 2.178 1.762 1.661 1.661 1.661 1.661
Mn 0.343 0.301 0.291 0.290 0.290 0.290
(d)
Fiscal year 2000 2010 2020 2030 2040 2050
Si 3.264 3.046 2.649 2.646 2.646 2.646
Concentration Fe 0.617 0.598 0.566 0.566 0.566 0.566 (%) Cu 1.026 0.936 0.805 0.804 0.804 0.804
Mn 0.231 0.222 0.208 0.208 0.208 0.208
(e)
Fiscal year 2000 2010 2020 2030 2040 2050
Si 1.794 1.794 1.794 1.794 1.794 1.794
Concentration Fe 0.449 0.449 0.449 0.449 0.449 0.449 (%) Cu 0.256 0.256 0.256 0.256 0.256 0.256
Mn 0.164 0.164 0.164 0.164 0.164 0.164
(f)
Fiscal year 2000 2010 2020 2030 2040 2050
Si 9.953 10.05 10.24 10.26 10.26 10.26
Concentration Fe 1.177 1.183 1.194 1.195 1.195 1.195 (%) Cu 3.705 3.695 3.676 3.674 3.674 3.674
Mn 0.500 0.500 0.500 0.500 0.500 0.500
(g)
Fiscal year 2000 2010 2020 2030 2040 2050
Si 0.605 0.605 0.605 0.605 0.605 0.605
Concentration Fe 0.381 0.381 0.381 0.381 0.381 0.381 (%) Cu 0.121 0.121 0.121 0.121 0.121 0.121
Mn 0.173 0.173 0.173 0.173 0.173 0.173
(h)
Fiscal year 2000 2010 2020 2030 2040 2050
Si 3.106 2.776 2.313 2.312 2.312 2.312
Concentration Fe 0.848 0.832 0.809 0.809 0.809 0.809 (%) Cu 1.329 1.217 1.077 1.076 1.076 1.076
Fig. 2. For some kinds of scraps, there were differences between the estimation and the measurement. These dif-ferences were attributable to the following reasons. (1) The types of products included in the scraps were different, (2) alloy composition was assumed incorrectly resulting in inaccurate estimation of scrap compositions, (3) contamina-tion by impurities occurred in the separacontamina-tion and colleccontamina-tion processes when aluminum was collected from end-of-life products and (4) the allocation method was invalid. An incorrect assumption of alloy composition means that the alloying elements did not add up to their upper limit as described in industrial standards. In this case, the estimated concentration of the alloying element in the scrap would be higher than the actual concentration. In the case of contamination with impurities, the estimated concentration of the incorporated elements would be lower than the actual concentration. With this in mind, we discuss below the causes of the differences between the estimated and measured scrap compositions.
Figure 2(a) shows the comparison between the measured composition of kitchen utensil scraps and the estimated composition of the ‘‘Fabricated metal’’ category. The estimation indicates a higher Si concentration and a lower Fe concentration than the measurement. The overestimation of Si was considered to be because of differences in the kinds of products included in the scrap: the estimated composition was based on the weighted average of mill products, castings and die-castings used for the ‘‘Fabricated metal’’ end use, whereas kitchen utensils do not use castings and die-castings that include much Si. The underestimation of Fe was attributable to the incorporation of impurities, such as handgrips of pans, into the scrap. Figure 2(b) shows the comparison between the measured composition of used beverage cans and the estimated composition of the ‘‘Bev-erage can’’ category. These two show good correlation. Since the alloys used in beverage cans are identifiable and few impurities could have become incorporated into the beverage cans, the estimation was more reliable. Figure 2(c) shows the comparison between the measured composition of aluminum
window frame scrap and the estimated composition of the ‘‘Construction’’ category. Although the incorporation of iron into aluminum window frame scrap has been an issue, the measured data showed lower concentrations of all four of the alloying elements compared with the estimated data. This result suggests that concentrations of alloying elements in produced alloys were assumed to be higher than the actual concentrations. Figure 2(d) shows the comparison for ma-chinery scrap. The mama-chinery scrap consisted of general machinery and automobile engine scrap; therefore, compo-sition of these two products was estimated separately and then compared with the measured data. The measured composition lay midway between the two estimates, which correlated well with the scrap content. Figure 2(e) shows the comparison between the measured composition of automo-bile engines and the estimated composition of the ‘‘Automo-bile (engine)’’ category. These two showed good correlation, although the estimated concentrations of alloying elements were slightly lower than the measured ones. The composi-tions of actual scrap were measured in 1995 (Fig. 2(a), (b) and (d)) and 2006 (Fig. 2(c) and (e)). The estimated data for the corresponding year were used for the comparison; therefore, a small difference was observed between ‘‘Auto-mobile (engine)’’ compositions in Fig. 2(d) and (e).
As shown in Fig. 2, the allocation method leads to a valid estimation of the chemical compositions in aluminum scrap. On the other hand, external factors such as incorrect assumptions about the alloy composition and the presence of impurities in the scrap can result in some differences between the estimated and measured compositions. Further investigation into these factors will be required to improve the estimation of scrap composition.
5. Conclusions
A dynamic substance flow analysis of aluminum was conducted. In the analysis, both the quantitative information and the chemical composition information were obtained in parallel. The allocation method was developed to obtain data on demand by both end use and alloy. Time-series data on the amount and composition of aluminum scrap discarded by society were estimated from the dynamic substance flow analysis. Estimated compositions were compared with the measured data, which verified the allocation method. How-ever, further investigation will be required to study the effect of external factors such as incorrect assumptions and contamination with impurities.
Acknowledgements
This research was supported by a Grant-in-Aid for Scientific Research (No. 17760658) from the Ministry of Education, Culture, Sports, Science and Technology of Japan.
REFERENCES
1) R. Kleijn, R. Huele and E. Van der Voet: Ecological Economics32 (2000) 241–254.
2) E. Van der Voet, R. Kleijn, R. Huele, M. Ishikawa and E. Verkuijlen: 0
0.2 0.4 0.6 0.8 1 1.2
Si Fe Cu Mn Si Fe Cu Mn Si Fe Cu Mn
Measurement Estimation
0 2 4 6 8 10 12
Si Fe Cu Mn Si Fe Cu Mn
(a) (b) (c)
Concentration (%)
Measurement
Estimation: General machinery Estimation: Automobile (engine)
(e) (d)
Concentration (%)
[image:6.595.47.291.72.254.2]Ecological Economics41(2002) 223–234.
3) K. Kakudate, Y. Adachi and T. Suzuki: Sci. Technol. Adv. Mater.1 (2000) 105.
4) I. Daigo, D. Fujimaki, Y. Matsuno and Y. Adachi: Tetsu-to-Hagane´91 (2005) 171–178.
5) S. Hashimoto, H. Tanigawa and Y. Moriguchi:Proc. 31st Conf. on Environmental Systems (Japan Society of Civil Engineers, Kita-kyushu, 2003) pp. 497–502.
6) T. Tasaki, M. Oguchi, T. Kameya and K. Urano: J. Jpn. Soc. Waste Management Experts12(2001) 49–58.
7) H. Yamada, Y. Matsuno, I. Daigo and Y. Adachi: J. Jpn. Soc. Waste Management Experts18(2007) 194–204.
8) Y. Igarashi, I. Daigo, Y. Matsuno and Y. Adachi: Tetsu-to-Hagane´91 (2005) 57–63.
9) O. Umezawa and M. Okubo:Proc. 108th Spring Meeting(The Japan Institute of Light Metals, 2005) p. 15.
10) Japan Aluminium Association:Aluminium Statistics in Japan(1960– 2003).
11) Japan Automobile Manufactures Association, Inc.: Motor Vehicles Statistics of Japan(1973–2000).
12) Clean Japan Center:Haikibutsu Genryouka no tameno Shakaishisute-mu no Hyouka ni kannsuru Chousakenkyu Houkokusho(1999) pp. 101– 102.
13) Japanese Standards Association, JIS HB Non-Ferrous Metals and Metallurgy — 2003, pp. 515–703.
14) DAIKI Aluminium Industry: Private communication (2005). 15) Japan Aluminium Association: Aluminum Handbook 6th edition,
pp. 15–25.
16) Automobile Inspection & Registration Association: Wagakuni no Jidousha Hoyuu Doukou(1987–2002).
17) Y. Komatsu, Y. Kato, T. Yoshida and T. Yashiro: Journal of Archit. Plann. Environ. Engng, AIJ439(1992) 101–110.
18) Japan Aluminum Can Recycling Association:Aluminium Can Recycle News.
19) Ministry of International Trade and Industry:Yearbook of Minerals and Non-ferrous Metals Statistics(1990–2001).