Munich Personal RePEc Archive
Does Teleworking affect Housework
Division and Improve the Well-Being of
Couples?
Giovanis, Eleftheris
University of Verona
November 2015
Online at
https://mpra.ub.uni-muenchen.de/68668/
1
Does Teleworking affect Housework Division and Improve the Well-Being of Couples?
Eleftherios Giovanis
Abstract
This study examines the relationship between teleworking, gender roles and happiness of couples using data from the British Household Panel Survey (BHPS) during the period 1991-2009. Various approaches are followed; Probit-adapted fixed effects, multinomial Logit and three stage least squares. The results support that both men and women who are teleworkers spend more time on housework, while teleworking increases the probability that the household chores examined in this study, such as cooking, cleaning ironing and childcare, will be shared relatively to those who are non-teleworkers. In addition, women are happier when they or their spouse is teleworker, as well as, both men and women are happier when they state that the specific household chores are shared. Thus, teleworkers may be happier for the reason that they are able to face the family demands and share the household chores with their spouse, increasing their fairness belief about the household division allocation and improving their well-being, expressed by happiness.
2
1. Introduction
Teleworking is defined as the working environment where employees work at home instead at offices or employer’s premises (Lim et al., 1997). Teleworking has long been studied, but has been extensively researched since the beginning of 1990s. However, the circumstances have been changed since then, as well as, the economic and technological developments of the last years that took place lead to necessity for further research on this employment type. One factor that explains the birth of teleworking is the global economy which was characterised by the exchange of goods, while now is heavily dominated by information. Another major factor is the fast and impressive boost in improvement of microchips, telecommunications systems and computing among other elements of these technologies. These factors made possible for a person to work at a distant location away from the employer’s premises (Nilles, 1975; 1999). Work family issues and gender roles have become increasingly important trends in the last 30 years. Socio-economic trends as the increasing participation of women in the labour force, greater number of working single-parents and the increasing care giving needs of an aging population provide new responsibilities and challenges to both women and men to work-family balance and commitments (Lerner, 1994; Marks, 1996).
An increasing number of women and men nowadays are involved in work and family arrangements, which were largely unknown for the parents’ and the past generally generations (Barnett and Rivers, 1996; Hochschild, 1997). Along with these new challenges the traditional allocation of family and work is breaking down by gender (Willinger, 1993; Barnett and Rivers, 1996). So far the understanding of the work-family nexus remains limited, thus the research based on which policies and practises can be developed in order to help individuals through the new work family arrangements, remains also limited.
3
experience of household life; the domestic or household division of labour and the management and control of the household’s finance (Vogler and Pahl, 1993, 1994; Warde and Hetherington, 1993; Morris, 1993; Anderson et al., 1994).
Our research will contribute to this existing work with a UK case study using a comprehensive dataset which is the British Household Panel Survey (BHPS). The aim of this study is to examine the relationship between teleworking, gender roles and happiness is explored. Using panel data and fixed effects regressions allow us to capture the individual effect which summarises the influence of unobserved variables that may have persistent effect on the dependent variable.
In order to reduce the endogeneity coming from the “sorting” issue where people may self-select to teleworking, panel analysis is followed since it is feasible up to some point to disentangle the effects of teleworking relatively to cross-sectional analysis. Moreover, the sample is limited to non-movers and those who never changed employer or job in the time span examined, the decision to move and being employed as teleworker can be correlated, reducing in this way the endogeneity, which may be coming from this “sorting” issue. Furthermore, the total sample including a time whether the individual has changed job at least one time or not and its interaction with teleworking as an additional term into analysis are considered.
The structure of the paper is the following: In section 2 short literature review is presented. In section 3 the methodology followed is discussed, while in section 4 the data sample used in the analysis is presented. In section 5 the empirical results are reported, while in the final section the concluding remarks are discussed.
2. Literature Review
4
household chores (Denmark et al., 1985). On the other hand the gender role framework departs from the rational view. Even though most men and women report that the family is more valuable than work and even there have been many changes in gender roles the last 50 years, the traditional gender roles still persist. These roles emphasise that work is for men and family and housework responsibility is for women.
Thus, the purpose of this study is to explore the effects of teleworking on gender roles and housework allocation and then the overall effects of teleworking and gender roles on happiness. In addition, using panel data analysis it is possible to include the history of each individual into a regression model, providing more accurate inference of the model parameters, greater capacity of capturing the complexity of human behaviour than cross-sectional data analysis does. Moreover, panel data contain information on inter-temporal dynamics and they allow for controlling the effects of missing or unobserved variables. In addition this is the first study examining the linkage among teleworking, household production allocation and happiness employing various quantitative techniques and robustness checks. A Heckman selection model is applied in order to test for selection bias.
Telework may increase the time spend also on house chores, since the person is located at home and there is more available time since commuting either does not exist for the teleworker homeworkers or it is much less for those who spend some days only in the employer’s premises.
3. Methodology 3.1Theoretical framework
The model presented in this section is a utility discrete choice model based on the models proposed by Gronau (1977), Van Soest (1995) and the collective model developed by Chiappori (1988, 1992).
However, the majority of these studies is based on cross-sectional analysis which present the issues discussed previously, as well as, this study investigates the effects of teleworking on gender roles and the link between gender roles and overall utility (happiness). Thus, the analysis is limited on the investigation of the above effects and linkages, and no effort examining the labour supply decisions and behaviour takes place. Based on that, the analysis is limited to households with two adult members-couples. In the classical Gronau household production model, it is assumed that the household members share one common utility function, where they derive utility from leisure tlm for man and tlf for woman, from market
5
care of children. In the Gronau model it is assumed that market goods and goods produced in the household are perfect substitutes. The utility function will be:
)
,
,
(
X
MH
t
mlt
lfU
U
=
+
(1)
U is assumed that it is twice continuously differentiable and strictly concave. The household production H is a function of the time spent or the share of the couple on housework defined as thm for male and thf for female and auxiliary inputs XH. In that case two variables are
used; the first is the time-hours per week- spent for housework, while the second variable examined refers on whether the couples share the household chores, such as cooking, shopping and taking caring care the children. The auxiliary inputs XH refer on intermediate inputs as food
for preparing meals, or using car or public transportation for shopping.
)
,
,
(
X
Ht
mht
hfH
H
=
(2)
The household budget constraint consists of the non-labour income I and the labour income expressed by the weekly wages wm and wf for male and female respectively, and market labour
supply in hours per week defined as tw
m for male and twf for female. The household budget
constraint will be:
H M w f f w m
m
t
w
t
X
X
w
I
+
+
=
+
(3)
Relation (3) entails the risk of selecting households that both spouses may have a relatively high productivity in the market and low productivity in household production and vice versa. However, this model is presented as introduction, where in the points followed teleworking will be included. The time constraint for each member will be:
f m i for t
t t
T= iw+ ih+ il , = ,
(4) Including teleworking it will be:
))
(
),
(
,
(
X
MH
t
mltel
mt
mht
fltel
ft
hfU
U
=
+
+
+
6
The partial optimisation problem can be:
H h f f h m m h f f f h m m m H h f h m T t t
X
t
w
t
w
t
tel
w
t
tel
w
X
t
t
H
H
h f h m−
−
−
+
+
=
≤ ≤)
(
)
(
)
,
,
(
, 0max (6)
Then the first order conditions will be:
))
(
'
1
(
m mhm h m
t
tel
w
t
H
−
=
∂
∂
(7)))
(
'
1
(
f hff h f
t
tel
w
t
H
−
=
∂
∂
(8) In this case the inclusion of telework shows that the household members will choose the housework level where the marginal product of their housework equals their wage which is adjusted with this part of the housework activity through telework perceived as leisure or allocating time for housework (for instance the time spent for commuting at work can be invested for leisure and free time or the time earned can be invested on additional hours of household-domestic work). Otherwise the household may decide to purchase the household chores, which information is available as the data sample is described in more details in the next section. More specifically, according to the classical household production model the household production Z is an increasing function of the i’s member work in household production hi and the marginal product hi is decreasing with hi. Then the member i will chooseto increase the housework until a point for example thi*, where the marginal product in
household production is equal to the wage and it is ∂H/∂ thi =wi. However, including the
teleworking, where ranges between 0 (office-based workers) to 1 (teleworker homeworkers), the housework is more than the classical household production model would predict. For example in this case the hours of household production is thi **, and it is thi **> thi *, thus the
difference between thi** and thi * can be interpreted as the effect of telework on housework
production. Moreover, utility (5) can be written as:
)
)(
1
(
mf
hh
U
U
U
=
π
+
−
π
(9) Uhh is the household utility and π∈[0,1] is a continuously differentiable weighting factor.
7
as a weighted average of the individual utilities for men and women defined as Um and Uf
respectively. It is expected that the more the individuals spend their time of work at home the more the contribution to household production is expected to be. This follows the assumption by Chiappori (1988), Apps and Rees (1988) and Browning and Chiappori (1998), that the household decision making procedures result in Pareto efficiency and it is not focused on specific bargaining rule.
Next the individuals allocate their share of the full income to their consumption and leisure of preference in such a way that this allocation maximises their individual welfare or well-being, defined as the overall happiness. This is generally, an application of the second fundamental theorem of welfare economics. Concluding telework effects may depend on various circumstances. Firstly, it is assumed that men who are teleworkers, are more likely to share the housework with their partners, or at least to contribute more than men who are non-teleworkers and similarly for women. However, depending on the characteristics and the gender roles within family, women still may devote more time on housework and especially women teleworkers may spend even additional time on household production than men. On the other hand, men teleworkers may spend more time on housework than women and in this case the gender roles are inversed.
The first order conditions of (9) with respect to the woman’s and man’s housework are:
h f f f m h f f f f h f hh
t
tel
tel
U
t
tel
tel
U
t
U
∂
∂
∂
∂
−
+
∂
∂
∂
∂
=
∂
∂
)
1
(
π
π
(10) h m m m m h m m m f h m hht
tel
tel
U
t
tel
tel
U
t
U
∂
∂
∂
∂
−
+
∂
∂
∂
=
∂
∂
)
1
(
π
π
(11)The first term in (10) and (11) represented the male part of the collective utility function, while the second term represents the female part. It follows that the housework choice of the woman influences the household utility through the utility of the man and the utility of the woman, and vice versa. In addition, being a teleworker or not has an influence on the household utility through the participation on household production and allocation.
8
definition of the threshold k may not be realistic. More specifically, although women continue to be responsible for the majority of housework, few perceive it as unfair. Critics of exchange theory argue that instead of focusing on the relationship between the division of household labour and marital and life satisfaction, it is more fruitful to examine couples’ perceptions of fairness (Thompson, 1991; Pina and Bengston, 1993). Pina and Bengston (1993) find that how wives perceive the amount of support and the help they receive from their husband is more important in determining the happiness than the actual division of labour expressed in hours of housework. Thus, it is expected that even in the case where the share of household tasks is not equal in terms of housework hours, this does not imply that the women perceive it as unfair, as the findings in the empirical section confirm too. Moreover, the belief of whether both man and woman should contribute can be incorporated into the framework discussed above. Nevertheless, the regression analysis controls for this belief where men and women are asked whether agree or not that both partners should contribute into the household and market.
3.2Panel Regressions
In this section the panel regressions are described. Regarding the association of telework and gender roles the general model will be:
t j i j j t i t j i t j i t
j i t
j
i a atel a y ΄z l l T
GR,, = 0+ 1 ,, + 2log( ,,)+α ,, + +θ + + +ε,, (13)
GR denotes the gender roles and the division of housework, and the possible answers are: whether the individual does mainly the housework, whether his/her partner does mainly the housework, both share the housework, somebody else does the housework and arediscussed in more details in the data section for individual i, in household h, in location j and time t. tel indicates whether the individual i is teleworker or not, z is a vector of personal and household characteristics, discussed in the data section. Set μi denotes the individual-fixed effects, lj is a
location-residence fixed effects, θt is a time-specific vector of indicators for the day and month
the interview took place and the survey wave, while ljT is a set of area-specific linear time
trend, which controls for unobservable, time-varying characteristics in the area, which can affect the propensity to telework, such as distance to employer’s premises.
9
whether teleworking increases the probability that the couples share the housework as well as to examine the hypothesis that spouses who are teleworkers may spend more time in house chores and housework be more or less shared depending on whether the household is characterised by traditional gender roles or gender egalitarianism. Next the dependent variable “hours per work in housework” is used and the model will be estimated with Fixed Effects.
10
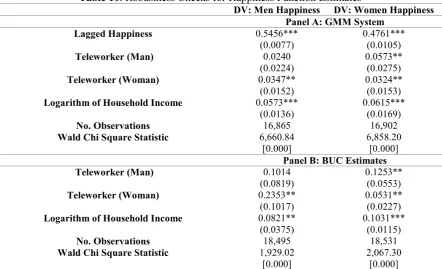
Moreover, regression (14) is estimated using the happiness as dependent variable. The model using happiness as dependent variable can be estimated by ordered Logit and Probit with random effects. However, a fixed effects framework is not feasible using these models into a panel data structure. One option is to use the Probit OLS introduced by van Praag and Ferrer-i-Carbonell (2004) by rescaling the categorical dependent variable and deriving Z -values of the standard normal distribution that correspond to cumulative frequencies of the original categories (see Cornelissen, 2006, for an example). The second option applied in this study is the “Blow-Up and Cluster” (BUC) estimator (see Baetschmann et al., 2014 for more technical details on BUC estimator). Finally, the Generalised Methods of Moments (GMM) system (Blundell and Bond, 1998) is applied.
In addition, relation (13) will be expanded into a system to examine also the relationship of teleworking with gender roles and well-being (Happiness). The structural equation system will then be:
t j i j j t i t j i t j i t
j i t
j i t
j
i a atel a y a HP ΄z l l T
GR,, = 0+ 1 , , + 2log( , , )+ 3 ,, +α ,, + +θ + + +ε, , (14a) t
j i j j t i t j i t j i t
j i t
j i t
j
i tel y GR ΄z l l T
HP,, =β0+β1 , , +β2log( ,, )+β3 , , +β , , + +θ + + +ε, , (14b)
In that case the equations (14a)-(14b) a two equation system and the variables are defined as previously, while HP denotes the happiness. Three Stage Least Squares (3SLS) are applied in this case, where happiness and gender roles are considered as endogenous. Moreover, gender roles and family environment are converted into a binary variable taking 1 whether the house chores are shared or are done jointly and 0 otherwise. This set up may not be representative, as teleworking can increase the house work load in disdain for one of the partners. However, a categorical dependent variable, and not ordinal, is not feasible into a 3SLS framework. In addition, the main interest of the study is whether telework is more likely to increase the probability of sharing the housework or not r to contribute more to housework production.
4. Data
11
examine a wide range of research topics, including income, poverty, labour, well-being, health, education, housing, household formation, fertility, social and political attitudes and values among others.
BHPS has the following statements on the housework division that are helpful to observe which gender is responsible at doing different house chores: Who does the grocery, who does the cooking, who does the cleaning, who does the washing/ironing and who is responsible for the childcare. The possible answers are mainly myself, mainly the partner, shared/both and someone else, which can be some other member from the household, a friend, a relative or someone by payment. Regarding the family “environment” the question is who contributes to the child care replying to the same answers as above. Finally, there is a quantitative variable hours per work in housework, which can be used as an additional dependent variable.
The survey includes a question about happiness, which is an ordinal variable measured on a 4-point scale and the specific phrasing of the question is the following “Have you recently been feeling reasonably happy, all things considered”. In addition, life satisfaction could be considered, but it is measured only after the 6th wave, while happiness is available since the beginning of BHPS. The health status is an ordinal variable answering on whether the respondent’s health is very poor/poor/fair/good/excellent.
The regressions control for both partners’ characteristics. More specifically, partners’ weekly working hours, age, education level, job status, and health status commuting time to work are included into the regressions, where for home-based teleworkers the commuting time is zero. Other individual characteristics include the personal labour income and happiness, while the household characteristics is the household size and house tenure. The personal income may be an important factor as it can capture the bargaining power of partners. For instance, women with higher income may have a higher bargaining power regarding the household allocation. The number or the age of children could be examined too but the number of children is highly correlated with the household size. Finally, as it has been mentioned the regressions control the day of the week, the month of the year and the wave of the survey, as well as, for residence location which is local authority district for BHPS. The latter can capture unobserved characteristics associated with the area, such as traffic affecting the time needed to attend at work etc. Moreover, the day of the week is important, especially for those who telework at both home and employer’s premises, which captures the effects of teleworkers who stay at home or commute at work.
12
and those who live as a couple. The percentage of teleworkers is 11.08, while the 3.71 is home-based only teleworkers. The teleworkers who work more than one place, meaning that they spend some days in employer’s premises, is 7.37 per cent, where the 10.10 and 4.80 per cent consist by men and women respectively. It should be noticed that for gender roles paid help is applied, with the exception from the question of the childcare responsibility, where the answer is someone else, meaning that could be another member of the family, paid help or help from relatives.
In addition, as it can be seen in table 1, the gender roles are not homogenous. More specifically, while the 11.35 per cent of the total sample of men is mainly responsible for shopping and the 40.39 answers that shopping role is shared, the 9.78 per cent of the men teleworkers sample is responsible for shopping, while the shared percentage reduced at 37.75 per cent. This can be explained that shopping is an outdoor activity, thus it may be more likely that those who work in the employers premises will combine shopping with work, i.e. after completing the work the individual may go for shopping afterwards. Regarding women the situation is different. For the total sample the 52.29 per cent is mainly responsible for shopping, while this percentage is increased at 58.98 for women teleworkers, even if the percentage of men teleworkers is more than doubled. On the other hand, a different situation is presented for cooking. The 11.82 per cent of men in the total sample is responsible for the cooking, while the 59.78 per cent states that the partner is responsible and the 27.24 is shared. On the other hand, the 13.50 of the teleworkers men states that is mainly responsible for cooking reducing the responsibility of the partners at 55.66 and increasing the shared responsibility at 29.60 per cent. The results for women show that the 61.64 of the total sample of women is mainly responsible for cooking, while the respective percentage for women teleworkers is 64.84, while the shared housework proportion is decreased at 24.12 for women teleworkers, from 25.87 that is for both teleworking and non-teleworking women. This shows that based on the theoretical model teleworking for both men and women implies, additional housework for themselves. On the other hand, shared housework proportion is higher for men teleworkers, while is lower for women teleworkers.
13
teleworking men. Also, the 1.06 of non-teleworking men are mainly responsible for the childcare, while the percentage is increase at 5.47 for teleworking men.
However, teleworking for women implies additional childcare responsibility, as the percentage for teleworking women who are mainly responsible for the child is 34.64, while the respective percentage for women non-teleworkers is 33.33. In addition, the shared housework is reduced from 20.74 for non-teleworking women to 19.06 for women who telework. Regarding the hours devoted in housework, in panel G of table 1, both men and women who are teleworkers on average spend two more hours for housework than non-teleworking men and women
In panel G the monthly average personal and household income, as well as, the average happiness in a scale 1-4 are reported. Men who telework have on average a higher personal (labour-wage) income by 110 than non-teleworking men, while women teleworkers have a higher personal income by around 60 per month than non-teleworking women. Similarly, the household income of teleworking members is higher. The t-statistic for the difference of the personal income between men teleworkers and non-teleworkers is 2.9587 (p-value 0.0031) while the respective t-statistic for women teleworkers and non-teleworkers is 3.2248 (p-value 0.0338) rejecting the null hypothesis that the income between teleworkers and non-teleworkers is equal. The average happiness of both men and women who telework is higher than those who are non-teleworkers.
(Insert table 1)
14
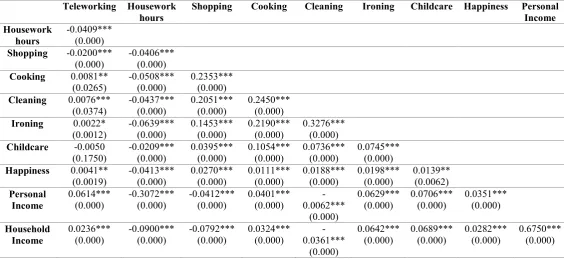
which can be explained by the fact that shopping is an outdoor activity. This can be seen by the positive association between teleworking and whether sharing cooking, ironing and cleaning or not. The association between teleworking and whether childcare is shared or not is insignificant, while a positive correlation between teleworking and happiness and income is presented, as it has been reported also in table 1. However, it is not clear whether causality exists and in which direction. For instance does teleworking increase happiness and income, or happier people are more likely to be employed as teleworkers and earn more? Another causal path can be that teleworkers on average earn more and therefore are happier?
Regarding the housework hours, these are negatively associated with the probability that the housework is shared, as it is expected, with higher income leads to less housework hours. The latter association may be explained by the fact that people with higher income can work more hours and thus they contribute less in household production. However, this is not entirely clear, since the correlation of income and the probability that both partners share the housework on ironing, cooking and childcare is positive, while it becomes negative for shopping and cleaning. Moreover, these associations are not clear, as there is heterogeneity between men and women, which will become clearer in the empirical result section. In addition, happiness and shared household production are positively associated. This may indicate that people who share the household production are happier, or happier people are more likely to share the housework with their partners. Similarly, additional housework hours are negatively associated with happiness, which can be derived by the fact that share housework implies less housework hours.
(Insert table 2) 5. Empirical Results
15
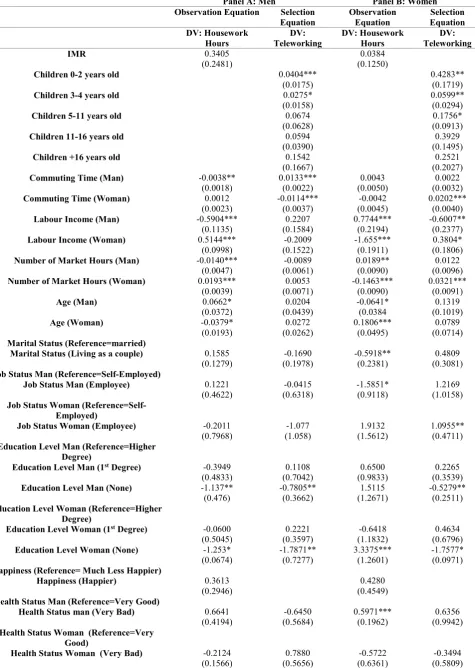
teleworking employment, which can be explained by the fact that increases on household size is associated with extra needs and family demands. Thus, teleworking may be a solution to face and correspond to these family demands.
Regarding the observation equation the inverse Mills ratio (IMR) coefficient is insignificant, accepting the hypothesis that there is not selection bias in the sample examined. Labour income is significant and negative indicating that those who earn more are less likely to contribute to household chores and production. This is also related to the hours spend on market, as there is a positive correlation between hours worked and the labour income. Those who are employees spend less hours on housework chores than the self-employed, which can be explained by the fact that the latter are more likely to choose teleworking, as it has been seen by the selection equation.
Similarly, as before, increases in household size are associated with increases on housework hours, as well as, those who rent the house from employer or the local authority. Health status it is an important factor, where those who reported very bad levels of health are less likely to contribute to housework, which is expected as this variable included also people with mental problems, disabilities, various accidents and illnesses. Finally, education level is an important determinant of household production. More specifically, those with education level lower than university or higher education spend less time on housework than those with higher degree, while there is no difference between those who have completed a first degree and those with higher degree. It should be noticed that additional regressions took place separately for men and women presenting the same conclusions, but are not presented here.
(Insert table 3)
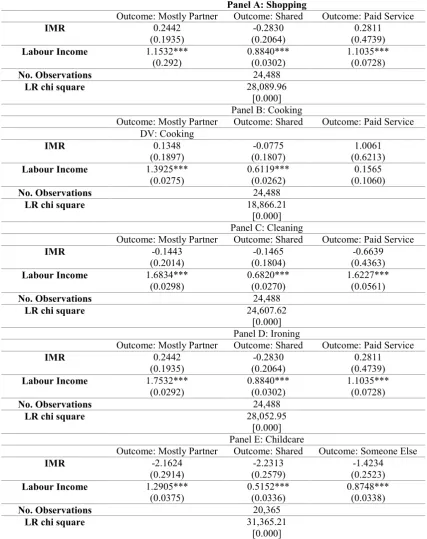
In table 4 the Heckman selection model results for the gender roles are presented. In this case the selection equation is the same, while in the second stage a multinomial fixed effects model has been estimated and the reference or base outcome is whether the respondent states that the specific household chore his/her main responsibility. In all cases IMR is insignificant while labour income is positive and significant.
(Insert table 4)
16
coefficients are very similar with those found in the second stage of the Heckman selection model in table 3. However, the remained factors and their estimates are reported for the gender roles in table 5 below, as they have not been presented yet and have not been discussed.
Regarding men and the three samples explored, being teleworkers is associated with additional housework hours than non-teleworkers. Regarding women sample both men and women teleworking coefficients are significant with a negative and positive sign respectively. This indicates that women whose spouse is teleworker spends less time on housework hours than the respective women whose spouse is non-teleworker. In panel B the same concluding remarks are presented, where the sample examines only those couples that are employed. Similarly, in panel C where the sample now is limited to employed couples, that they have not changed employer and are non-movers (same residence).
It should be noticed that the number of observations among the various regressions differ. The reason is that housework hours question is available in all waves, while gender roles the observations for gender roles and household chores are less because the questions are not available in all the waves of the BHPS, while the childcare gender role includes only the couples with children.
(Insert table 5)
17
shopping with their partner. Inverse results are derived with woman’s commuting time, labour income and number of market hours. Thus, the conclusion is that when the individual spends more time on market and earns more is less likely to share the housework or to be the main responsible, concluding that the partner has the main responsibility for shopping. The same findings holds for the other gender roles in table 7; however, these characteristics, as the remained factors are not presented as the conclusions remain the same.
Age has significant effects with similar interpretation that has been given before in Heckman selection model, while both men’s and women’s employment status coefficients are insignificant. Those who own the house with mortgage, those living in large households and those who believe that men and women should not contribute the same in the household, are less likely to state that shopping is shared for both men and women. Similarly, those with first degree or no education are less likely to state that shopping is shared, while for women with no degree women are more likely to believe that they are mainly responsible, while men do not. This can be explained by the fact that education, as labour income, is an important factor for bargaining into the household as it happens in society. More specifically, low educated women may believe that couples should not contribute the same, that men is the main breadwinner and that women should be involved more in housework it is observed in families with traditional gender roles.
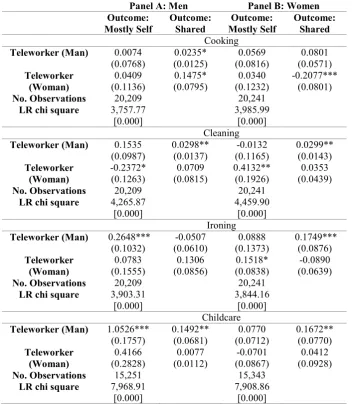
For men and women being teleworker has no significant effects on cooking and being mainly responsible. Men are more likely to state that cooking is shared when either they or their partner is teleworker. On the other hand, the coefficients are insignificant for women and cooking, with the exception where when a woman is teleworker is less likely to believe that cooking is shared. When the woman is teleworker man is less likely to believe that he is mainly responsible for cleaning, indicating that women spend more time on cleaning, while when he is teleworker he believes that cleaning is shared. The same belief holds for women when man is teleworker, while when woman is teleworker is more likely to be main responsible for cleaning, confirming the theoretical assumptions of the model that women who telework contribute more in the housework and specifically, cleaning.
18
(Insert tables 6-8)
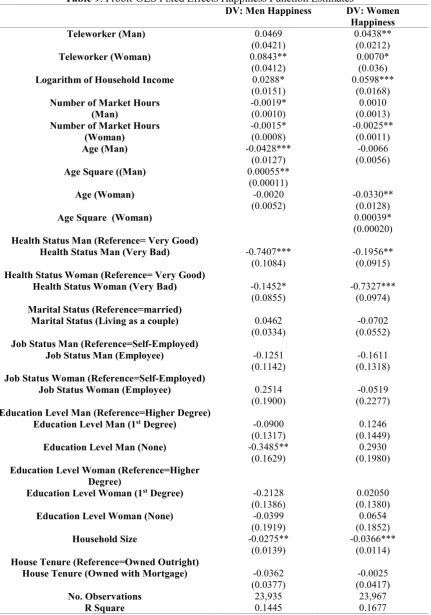
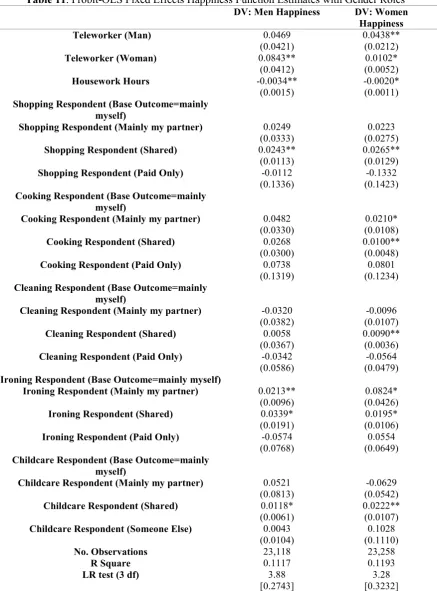
In table 9 the happiness regression for men and women separately are reported. In this study both men and women characteristics are included in the regressions. Regarding men the results show that for them being teleworkers or not is not significantly related to happiness. On the other hand, when their spouse is teleworker are more likely to report higher levels of happiness. As it was expected the household income is positive and significant. Regarding the number of market hours there is a negative association between men’s happiness and both women’s and men’s number of market hours. The number of market hours for men may have a negative impact, as based on the utility function there will be less available leisure time. However, wages may increase utility, but wages are also associated with additional working hours; thus there is a trade-off and substitution effect, which is not explored here. Regarding the women sample the number of market hours for men is no significant, while an increase of women’s market hours is associated with a decrease on happiness.
19
only the couples with children are considered and based on the Likelihood-Ratio (LR) test which compares the difference between those with children and those with no, the null hypothesis of no difference between these two regressions is accepted.
In this case the relationship between teleworking, gender roles and happiness is explored. Moreover, teleworking may affect and cause gender roles and household production allocation, as it has been assumed in the methodological framework, and thus this allocation may affect the overall utility, expressed by happiness.
Based in the results 11 men is more likely to report that are happier when their spouse is teleworker, while there is no difference on happiness levels between men teleworkers and non-teleworkers. Regarding the gender roles the results are insignificant with the exception of shopping, ironing and childcare, where men who stated that the housework chores are shared are more likely to be happier. All the other outcomes are insignificant, with the exception of ironing, where men who answered that this role is main responsibility of their spouse are more likely to report higher levels of happiness.
On the other hand, women are happier when both they and their partner are teleworkers. In addition, housework hours are insignificant, but regarding cooking and ironing women are happier when the housework on these roles is mainly responsibility of their partners or housework is shared. Regarding shopping, cleaning and childcare, women who stated that housework is shared are more likely be happier. The other outcomes are insignificant.
Regarding the housework hours, increases on household production are associated with lower levels of happiness; however, is not clear whether these increases of fairness beliefs are tribute of sharing the housework with their spouse or not. The question in this case is whether teleworkers are more likely to share the household, especially men, while women teleworkers may contribute more into the household production affecting their utility. Nevertheless, women teleworkers, or even men, may choose to telework because they prefer to spend more time on household chores and activities, as well as, on leisure activities. Since telework allows for flexibility in working time schedule, people may spend time on their favourite activities, such as sharing the housework with their spouse, spending more time on childcare and other activities and leisure. It should be noticed, the results so far have been employed only for couples with children, but similar results are present for couples without children.
20
The results so far show that telework is associated positively with happiness and with the probability that the housework is shared, especially in the women sample whose spouse is teleworker. However, this may be the case where a sorting effects is taking place producing the observed positive effects as it has been discussed in the methodology part.
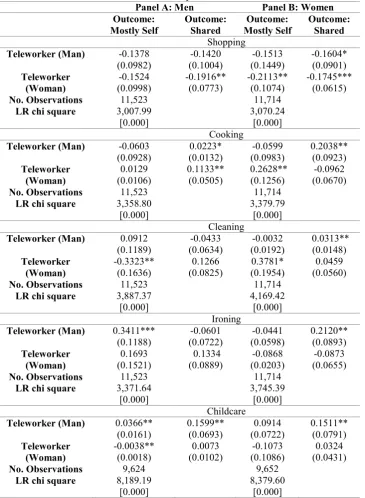
In table 12 the interaction terms of job stayer and teleworker as well as of job switchers and teleworkers for men and women are included into the regression. Regarding shopping the result for both men and women are similar with the previous results confirming that the effects are mainly captured by the job stayers and teleworkers. The exception is the woman sample and whether the shopping is shared where the probability of shopping being shared is less likely for job switchers and men, like as in the case of job stayers and both men and women. The findings for the rest of the gender roles are similar and confirm that the effects of teleworking are mainly explained by the job stayers. The only exceptions is the women sample for the gender roles of cooking and childcare where the effects of men teleworking on whether these household chores are shared or not are explained by both job stayers and switchers. Finally, the estimates including alternative functional forms, such as squared wages and age have taken place; however the teleworking effects, as well as, the likelihood function do not change. This indicates that the household production functions and the teleworking effects are not sensitive on alternative function forms. Nevertheless, this can be the case when the sharing rule on household expenditures is explored. In table 13 the happiness functions including the interaction of job stayers with teleworking and job movers with teleworking are reported. The results remain the same where men are happier when women is job stayer and teleworker, while the remained interaction terms are insignificant. Similarly for women.
(Insert tables 12-13)
21
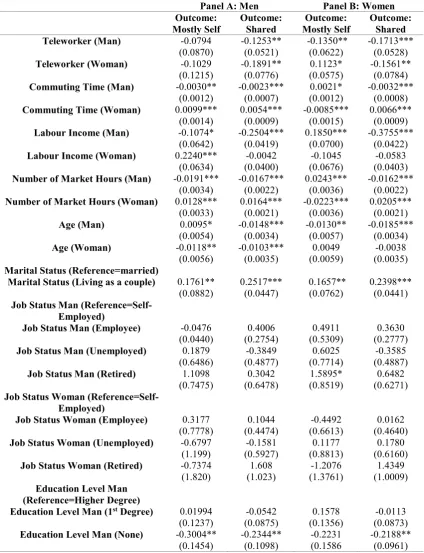
cases the teleworking coefficient is negative indicating that when for example either man or his spouse is teleworker are less likely to state that they share shopping. This can be explained probably to the fact that shopping is an outdoor housework role, as it has been mentioned before. Thus, teleworkers are more likely to spend all the week or some days of the week at home, reducing the probability of spending time for this gender role.
Regarding cleaning teleworkers are more likely to state that they share it with their spouse while women teleworking coefficient is insignificant. On the other hand, women whose spouse is teleworker are more likely to state that the roles for cleaning, ironing, cooking and childcare is a sharing process.
Regarding teleworking when cooking, cleaning and childcare are shared increases the probability that men will telework, while when they state that ironing and childcare are mainly responsibility of their spouse are less likely to be teleworkers. The coefficients for the remained gender roles are insignificant. Similarly, for women when shopping, cooking and ironing is shared are less likely to be teleworkers, as well as, that mostly their partner is responsible. This indicates that for women who are teleworkers spend more time on housework than women who are non-teleworkers. For both women and men increase on housework time increases the probability that the individual will be teleworker.
Regarding happiness and the men sample when shopping, cooking and cleaning are mainly responsibility of their partner or when shopping, childcare, cleaning are shared are happier. Regarding women sample, in all cases when the household chore is shared are more likely to be happier, while increases on housework hours for both men and women leads to decrease of happiness. In both samples, men and women are happier when their spouse is teleworker. On the other hand, when women are teleworkers are happier, while there is no difference on men’s happiness whether they are teleworkers or not. Thus, this may indicate that women are happier when their spouse is teleworker, because it is more likely that he will contribute to housework and sharing it with his spouse increasing the happiness for women as the remained coefficients show. In addition, when women are teleworkers are more likely to face the family demands, as flexibility of work is one of the characteristics of teleworking.
22
allows for flexibility on labour market timing, better time management, as well as, housework, such as cooking and childcare for example for men can be perceived as leisure.
(Insert table 14)
6. Conclusions
The results showed that teleworkers spend more time on household production, while women whose partner is teleworker are more likely to state that household chores are shared increasing their overall well-being. Teleworking can have various policy implications and benefits for couples, employees, employers and society. Teleworking can be a solution to problems of balancing work and family. Increasing work flexibility will facilitate the management of work and family together. Since one of the main aims of policy makers and society is the improvement of the well-being of the citizens, teleworking may be another option which leads to work-family life balance and thus in higher levels of happiness and life satisfaction with overall impact on other life events and conditions, including health improvement, increase in leisure time. Teleworking and housework allocation can have further benefits on job satisfaction and productivity for couples. Improvement on happiness and job satisfaction will have further benefits to firms and organizations because job satisfaction can lead to higher productivity and thus higher firm performance. However, the last two arguments have not been explored in this study; but it is suggested for future empirical research.
23
Acknowledgements
This work was based on data from the British Household Panel Survey (BHPS), Waves 1-18, 1991-2009 Local Authority Districts, produced by the Institute for Social and Economic Research (ISER) at the University of Essex, sponsored by the Economic and Social Research Council (ESRC), and supplied by the UK Data Archive. The data are the copyright of ISER. The use of the data in this work does not imply the endorsement of ISER, ESRC or the UK Data Archive in relation to the interpretation or analysis of the data.
References
Anderson, G., Brosnan, P. and Walsh, P. (1994). Homeworking in New Zealand: results from a workplace survey. International Journal of Employment Studies, 2(2), 229–247.
Apps, P. and Rees, R. (1988). Taxation and the household. Journal of Public Economics, 35, 355-369.
Baetschmann, G., Staub, K.E. and Winkelmann, R. (2014). Consistent Estimation of the Fixed Effects Ordered Logit Model. Journal of the Royal Statistical Society: Series A (Statistics in Society, vol. 178(3), pp. 685-703.
Barnett, R. C. and Rivers, C. (1996). She works, he works: How two-income families are happy, healthy, and thriving. Cambridge, MA: Harvard University Press.
Benjamin, O. and Sullivan, O. (1996). The importance of difference: conceptualising increased flexibility in gender relations in the home. Sociological Review, 44(2), 225–251.
Blundell, R. and Bond, S. (1998). Initial conditions and moment restrictions in dynamic panel data models. Journal of Econometrics, 87,115-143.
Browning, M. and P.-A. Chiappori (1998). Efficient intra-household allocations: a general characterization and empirical tests. Econometrica, 66, 1241-1278.
Bryson, R., Bryson, J. B. and Johnson, M. F. (1978). Family size, satisfaction and productivity in two-earner couples. Psychology of WomenQuarterly, 3, 67-77.
Chiappori P.A. (1988). Rational Household Labor Supply. Econometrica, 56, 63-90.
Chiappori P.A. (1992). Collective Labor Supply and Welfare. Journal of Political Economy, 100, 437-446.
Coltrane, S. (1989). Household labour and the routine production of gender. Social Problems, 36, 473–490.
Cornelissen, T., 2006. Job characteristics as determinants of job satisfaction and labour mobility. Discussion Paper No. 334, Institute of Quantitative Economic Research, University of Hannover, Germany.
Denmark, F. L., Shaw, J. S. and Ciali, S. D. (1985). The relationship among sex roles, living arrangements and the division of household responsibilities. Sex Roles, 12, 617-625. Greenhaus, J. H., Bedeian, A. G. and Mossholder, K. W (1987). Work experiences, job
performance, and feelings of personal and family well-being. Journal of Vocational Behavior, 31, 200-215.
Gronau, R. (1977). Leisure, Home Production, and Work--the Theory of the Allocation of Time Revisited. Journal of Political Economy, 85(6), 1099-1123.
Heckman, J. (1979). Sample selection bias as a specification error. Econometrica, 47(1), 153– 161.
Hochschild, A. R. (1997). The time bind: When work becomes home and home becomes work. New York: Metropolitan Books
24
Lerner, J. V. (1994). Working women and their families. Thousand Oaks, CA: Sage.
Lim, K. G., Thompson, S. H. and Hat, W.S. (1997). Working at home- Myth or reality: An empirical study of factors affecting attitudes towards teleworking. Research Paper Series, Faculty of Business Administration, National University of Singapore, 1997.
Mahler, J. (2012). The Telework Divide: Managerial and Personnel Challenges of Telework. Review of Public Personnel Administration, 32(4), 407-418.
Marks, N. F. (1996). Caregiving across the lifespan: National prevalence and predictors. Family Relations, 45, 27-36.
Morris, L. (1993). Household finance management and the labour market: a case study in Hartlepool. Sociological Review, 41(3), 506–536.
Nilles, J.M. (1975). Telecommunications and organizational decentralization. IEEE Transactions On Communications, 23(10), 1142–1147.
Nilles, J. (1999). What does telework really do to us?, World Transport Policy and Practice, 15(2), 1-2.
Pina, D. L. and Bengston, V.L. (1993). The Division of Household Labor and Wives’ Happiness: Ideology, Employment and Perceptions of Support. Journal of Marriage and theFamily, 55, 901-912.
Thompson, L. (1991). Family Work: Women’s Sense of Fairness. Journal of Family Issues, 12, 181-196.
Van Praag, B.M.S. and Ferrer-i-Carbonell, A. (2004). Happiness quantified: A satisfaction calculus approach. Oxford: Oxford University Press.
Van Soest, A. (1995). Structural models of family labor supply: A discrete choice approach. Journal of Human Resources, 30(1), 63-88.
Vogler, C. and Pahl, J. (1993). Social and economic change and the organisation of money within marriage. Work, Employment and Society, 7(1), 71–93.
Vogler, C. and Pahl, J. (1994). Money, power and inequality within marriage. Sociological Review, 42(2), 263–288.
Warde, A. and Hetherington, K. (1993). A changing domestic division of labour? Issues of measurement and interpretation. Work, Employment and Society, 7(1), 23–45.
25
. Table 1. Summary Statistics
Panel A: Teleworkers
Both teleworkers and non-teleworkers Total teleworkers Home-based only teleworkers Teleworkers (more than
one place)
Non-teleworkers
Total sample 11.08 3.71 7.37 89.92
Men 48.64 14.77 3.47 10.10 86.31
Women 51.36 8.06 3.94 4.80 92.95
Panel B: Gender Roles for Men Non-Teleworkers
Who does the grocery shopping?
Who does the cooking?
Who does the cleaning?
Who does the ironing?
Who is responsible for
childcare?
Mostly self 10.22 11.87 5.54 5.34 1.06
Mostly partner 47.19 59.64 64.89 71.82 34.51
Shared 41.42 27.24 25.41 20.62 22.60
Paid Help Only or someone else
1.17 1.25 4.16 2.21 41.84
Panel C: Gender Roles for Women Non-Teleworkers
Who does the grocery shopping?
Who does the cooking?
Who does the cleaning?
Who does the ironing?
Who is responsible for
childcare?
Mostly self 53.99 61.64 64.87 78.44 33.33
Mostly partner 8.90 11.37 6.30 3.53 3.40
Shared 36.03 25.87 23.47 14.95 20.74
Paid Help Only or someone else
1.08 1.12 5.36 3.08 42.53
Panel D: Gender Roles for Men Teleworkers
Who does the grocery shopping?
Who does the cooking?
Who does the cleaning?
Who does the ironing?
Who is responsible for
childcare?
Mostly self 9.78 13.50 6.59 5.30 5.47
Mostly partner 51.20 55.66 59.81 70.78 30.81
Shared 37.75 29.60 28.58 21.80 25.50
Paid Help Only or someone else
1.27 1.24 5.02 2.12 38.23
Panel E: Gender Roles for Women Teleworkers
Who does the grocery shopping?
Who does the cooking?
Who does the cleaning?
Who does the ironing?
Who is responsible for
childcare?
Mostly self 58.98 64.84 68.38 76.36 34.64
Mostly partner 9.54 10.41 4.77 3.97 2.86
Shared 30.92 24.12 21.00 17.13 19.06
Paid Help Only or someone else
0.56 0.63 5.85 2.54 43.42
Panel F: Weekly Housework hours
Men Teleworkers Women Teleworkers Men Non-Teleworkers Women Non-Teleworkers Average Weekly Housework hours
7.070 16.803 5.027 15.262
Panel G: Income and Happiness
Men Teleworkers Women Teleworkers Men Non-Teleworkers Women Non-Teleworkers
Personal Income 2,137.324 1,225.17 2,027.146 1,168.262
Household Income
3,357.823 3,368.338 3,256.206 3179.008
26
Table 2. Correlation Matrix
Teleworking Housework hours
Shopping Cooking Cleaning Ironing Childcare Happiness Personal Income Housework
hours
-0.0409*** (0.000)
Shopping -0.0200*** (0.000)
-0.0406*** (0.000)
Cooking 0.0081** (0.0265)
-0.0508*** (0.000)
0.2353*** (0.000)
Cleaning 0.0076*** (0.0374) -0.0437*** (0.000) 0.2051*** (0.000) 0.2450*** (0.000)
Ironing 0.0022* (0.0012) -0.0639*** (0.000) 0.1453*** (0.000) 0.2190*** (0.000) 0.3276*** (0.000)
Childcare -0.0050 (0.1750) -0.0209*** (0.000) 0.0395*** (0.000) 0.1054*** (0.000) 0.0736*** (0.000) 0.0745*** (0.000)
Happiness 0.0041** (0.0019) -0.0413*** (0.000) 0.0270*** (0.000) 0.0111*** (0.000) 0.0188*** (0.000) 0.0198*** (0.000) 0.0139** (0.0062) Personal Income 0.0614*** (0.000) -0.3072*** (0.000) -0.0412*** (0.000) 0.0401*** (0.000) -0.0062*** (0.000) 0.0629*** (0.000) 0.0706*** (0.000) 0.0351*** (0.000) Household Income 0.0236*** (0.000) -0.0900*** (0.000) -0.0792*** (0.000) 0.0324*** (0.000) -0.0361*** (0.000) 0.0642*** (0.000) 0.0689*** (0.000) 0.0282*** (0.000) 0.6750*** (0.000)
27
Table 3. Heckman Selection Model Estimates Household Production and Housework Hours
Panel A: Men Panel B: Women
Observation Equation Selection Equation Observation Equation Selection Equation DV: Housework Hours DV: Teleworking DV: Housework Hours DV: Teleworking
IMR 0.3405
(0.2481)
0.0384 (0.1250)
Children 0-2 years old 0.0404***
(0.0175)
0.4283** (0.1719)
Children 3-4 years old 0.0275*
(0.0158)
0.0599** (0.0294)
Children 5-11 years old 0.0674
(0.0628)
0.1756* (0.0913)
Children 11-16 years old 0.0594
(0.0390)
0.3929 (0.1495)
Children +16 years old 0.1542
(0.1667)
0.2521 (0.2027)
Commuting Time (Man) -0.0038**
(0.0018) 0.0133*** (0.0022) 0.0043 (0.0050) 0.0022 (0.0032)
Commuting Time (Woman) 0.0012
(0.0023) -0.0114*** (0.0037) -0.0042 (0.0045) 0.0202*** (0.0040)
Labour Income (Man) -0.5904***
(0.1135) 0.2207 (0.1584) 0.7744*** (0.2194) -0.6007** (0.2377)
Labour Income (Woman) 0.5144***
(0.0998) -0.2009 (0.1522) -1.655*** (0.1911) 0.3804* (0.1806)
Number of Market Hours (Man) -0.0140***
(0.0047) -0.0089 (0.0061) 0.0189** (0.0090) 0.0122 (0.0096)
Number of Market Hours (Woman) 0.0193***
(0.0039) 0.0053 (0.0071) -0.1463*** (0.0090) 0.0321*** (0.0091)
Age (Man) 0.0662*
(0.0372) 0.0204 (0.0439) -0.0641* (0.0384 0.1319 (0.1019)
Age (Woman) -0.0379*
(0.0193) 0.0272 (0.0262) 0.1806*** (0.0495) 0.0789 (0.0714) Marital Status (Reference=married)
Marital Status (Living as a couple) 0.1585 (0.1279) -0.1690 (0.1978) -0.5918** (0.2381) 0.4809 (0.3081) Job Status Man (Reference=Self-Employed)
Job Status Man (Employee) 0.1221
(0.4622) -0.0415 (0.6318) -1.5851* (0.9118) 1.2169 (1.0158) Job Status Woman
(Reference=Self-Employed)
Job Status Woman (Employee) -0.2011
(0.7968) -1.077 (1.058) 1.9132 (1.5612) 1.0955** (0.4711) Education Level Man (Reference=Higher
Degree)
Education Level Man (1st Degree) -0.3949 (0.4833) 0.1108 (0.7042) 0.6500 (0.9833) 0.2265 (0.3539)
Education Level Man (None) -1.137**
(0.476) -0.7805** (0.3662) 1.5115 (1.2671) -0.5279** (0.2511) Education Level Woman (Reference=Higher
Degree)
Education Level Woman (1st Degree) -0.0600 (0.5045) 0.2221 (0.3597) -0.6418 (1.1832) 0.4634 (0.6796)
Education Level Woman (None) -1.253*
(0.0674) -1.7871** (0.7277) 3.3375*** (1.2601) -1.7577* (0.0971) Happiness (Reference= Much Less Happier)
Happiness (Happier) 0.3613
(0.2946)
0.4280 (0.4549) Health Status Man (Reference=Very Good)
Health Status man (Very Bad) 0.6641
(0.4194) -0.6450 (0.5684) 0.5971*** (0.1962) 0.6356 (0.9942) Health Status Woman (Reference=Very
Good)
Health Status Woman (Very Bad) -0.2124
(0.1566) 0.7880 (0.5656) -0.5722 (0.6361) -0.3494 (0.5809)
28
Table 4. Heckman Selection Model and Multinomial Fixed Effects Estimates for Sharing the Household Production
Panel A: Shopping
Outcome: Mostly Partner Outcome: Shared Outcome: Paid Service
IMR 0.2442
(0.1935)
-0.2830 (0.2064)
0.2811 (0.4739)
Labour Income 1.1532***
(0.292)
0.8840*** (0.0302)
1.1035*** (0.0728)
No. Observations 24,488
LR chi square 28,089.96
[0.000] Panel B: Cooking
Outcome: Mostly Partner Outcome: Shared Outcome: Paid Service DV: Cooking
IMR 0.1348
(0.1897)
-0.0775 (0.1807)
1.0061 (0.6213)
Labour Income 1.3925***
(0.0275)
0.6119*** (0.0262)
0.1565 (0.1060)
No. Observations 24,488
LR chi square 18,866.21
[0.000] Panel C: Cleaning
Outcome: Mostly Partner Outcome: Shared Outcome: Paid Service
IMR -0.1443
(0.2014)
-0.1465 (0.1804)
-0.6639 (0.4363)
Labour Income 1.6834***
(0.0298)
0.6820*** (0.0270)
1.6227*** (0.0561)
No. Observations 24,488
LR chi square 24,607.62
[0.000] Panel D: Ironing
Outcome: Mostly Partner Outcome: Shared Outcome: Paid Service
IMR 0.2442
(0.1935)
-0.2830 (0.2064)
0.2811 (0.4739)
Labour Income 1.7532***
(0.0292)
0.8840*** (0.0302)
1.1035*** (0.0728)
No. Observations 24,488
LR chi square 28,052.95
[0.000] Panel E: Childcare
Outcome: Mostly Partner Outcome: Shared Outcome: Someone Else
IMR -2.1624
(0.2914)
-2.2313 (0.2579)
-1.4234 (0.2523)
Labour Income 1.2905***
(0.0375)
0.5152*** (0.0336)
0.8748*** (0.0338)
No. Observations 20,365
LR chi square 31,365.21
[0.000]
29
Table 5. Teleworking and Housework Hours Fixed Effects Estimates
Panel A: Total Sample Panel B: Only Employed Panel C: Non-Movers
Men Women Men Women Men Women
Teleworker (Man) 1.1511** (0.5384) -0.4083* (0.2336) 1.1434** (0.5314) -0.2707** (0.1239) 1.1349** (0.4642) -0.2210** (0.1023)
Teleworker (Woman) -0.0336 (0.0596) 1.8275** (0.8356) -0.0394 (0.0520) 1.4023** (0.6295) 0.0100 (0.0163) 1.5909** (0.7023)
No. observations 25,163 25,163 19,647 19,780 15,331 15,496
R Square 0.1606 0.1946 0.1545 0.1709 0.1308 0.1526
Robust standard Errors within brackets, ** and * indicate significance at 5% and 10% level
Table 6. Teleworking and Shopping Multinomial Logit Fixed Effects Estimates
Panel A: Men Panel B: Women
Outcome: Mostly Self Outcome: Shared Outcome: Mostly Self Outcome: Shared
Teleworker (Man) -0.0794
(0.0870) -0.1253** (0.0521) -0.1350** (0.0622) -0.1713*** (0.0528)
Teleworker (Woman) -0.1029
(0.1215) -0.1891** (0.0776) 0.1123* (0.0575) -0.1561** (0.0784)
Commuting Time (Man) -0.0030** (0.0012) -0.0023*** (0.0007) 0.0021* (0.0012) -0.0032*** (0.0008)
Commuting Time (Woman) 0.0099*** (0.0014) 0.0054*** (0.0009) -0.0085*** (0.0015) 0.0066*** (0.0009)
Labour Income (Man) -0.1074* (0.0642) -0.2504*** (0.0419) 0.1850*** (0.0700) -0.3755*** (0.0422)
Labour Income (Woman) 0.2240*** (0.0634) -0.0042 (0.0400) -0.1045 (0.0676) -0.0583 (0.0403)
Number of Market Hours (Man) -0.0191*** (0.0034) -0.0167*** (0.0022) 0.0243*** (0.0036) -0.0162*** (0.0022)
Number of Market Hours (Woman) 0.0128*** (0.0033) 0.0164*** (0.0021) -0.0223*** (0.0036) 0.0205*** (0.0021)
Age (Man) 0.0095*
(0.0054) -0.0148*** (0.0034) -0.0130** (0.0057) -0.0185*** (0.0034)
Age (Woman) -0.0118**
(0.0056) -0.0103*** (0.0035) 0.0049 (0.0059) -0.0038 (0.0035)
Marital Status (Reference=married)
Marital Status (Living as a couple) 0.1761** (0.0882) 0.2517*** (0.0447) 0.1657** (0.0762) 0.2398*** (0.0441)
Job Status Man (Reference=Self-Employed)
Job Status Man (Employee) -0.0476 (0.0440) 0.4006 (0.2754) 0.4911 (0.5309) 0.3630 (0.2777)
Job Status Man (Unemployed) 0.1879 (0.6486) -0.3849 (0.4877) 0.6025 (0.7714) -0.3585 (0.4887)
Job Status Man (Retired) 1.1098 (0.7475) 0.3042 (0.6478) 1.5895* (0.8519) 0.6482 (0.6271)
Job Status Woman (Reference=Self-Employed)
Job Status Woman (Employee) 0.3177 (0.7778) 0.1044 (0.4474) -0.4492 (0.6613) 0.0162 (0.4640)
Job Status Woman (Unemployed) -0.6797 (1.199) -0.1581 (0.5927) 0.1177 (0.8813) 0.1780 (0.6160)
Job Status Woman (Retired) -0.7374 (1.820) 1.608 (1.023) -1.2076 (1.3761) 1.4349 (1.0009)
Education Level Man (Reference=Higher Degree)
Education Level Man (1st Degree) 0.01994 (0.1237) -0.0542 (0.0875) 0.1578 (0.1356) -0.0113 (0.0873)
[image:30.595.86.511.217.771.2]30
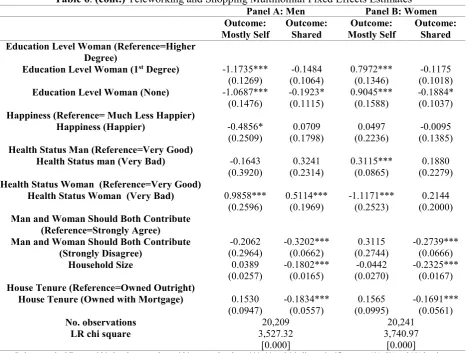
Table 6. (cont.) Teleworking and Shopping Multinomial Fixed Effects Estimates
Panel A: Men Panel B: Women
Outcome: Mostly Self
Outcome: Shared
Outcome: Mostly Self
Outcome: Shared Education Level Woman (Reference=Higher
Degree)
Education Level Woman (1st Degree) -1.1735*** (0.1269)
-0.1484 (0.1064)
0.7972*** (0.1346)
-0.1175 (0.1018)
Education Level Woman (None) -1.0687*** (0.1476)
-0.1923* (0.1115)
0.9045*** (0.1588)
-0.1884* (0.1037)
Happiness (Reference= Much Less Happier)
Happiness (Happier) -0.4856*
(0.2509)
0.0709 (0.1798)
0.0497 (0.2236)
-0.0095 (0.1385)
Health Status Man (Reference=Very Good)
Health Status man (Very Bad) -0.1643 (0.3920)
0.3241 (0.2314)
0.3115*** (0.0865)
0.1880 (0.2279)
Health Status Woman (Reference=Very Good)
Health Status Woman (Very Bad) 0.9858*** (0.2596)
0.5114*** (0.1969)
-1.1171*** (0.2523)
0.2144 (0.2000)
Man and Woman Should Both Contribute (Reference=Strongly Agree) Man and Woman Should Both Contribute
(Strongly Disagree)
-0.2062 (0.2964)
-0.3202*** (0.0662)
0.3115 (0.2744)
-0.2739*** (0.0666)
Household Size 0.0389
(0.0257)
-0.1802*** (0.0165)
-0.0442 (0.0270)
-0.2325*** (0.0167)
House Tenure (Reference=Owned Outright)
House Tenure (Owned with Mortgage) 0.1530 (0.0947)
-0.1834*** (0.0557)
0.1565 (0.0995)
-0.1691*** (0.0561)
No. observations 20,209 20,241
LR chi square 3,527.32
[0.000]
3,740.97 [0.000]
31
Table 7. Teleworking and rest of Gender Roles Multinomial Fixed Effects Estimates
Panel A: Men Panel B: Women
Outcome: Mostly Self Outcome: Shared Outcome: Mostly Self Outcome: Shared Cooking
Teleworker (Man) 0.0074 (0.0768) 0.0235* (0.0125) 0.0569 (0.0816) 0.0801 (0.0571) Teleworker (Woman) 0.0409 (0.1136) 0.1475* (0.0795) 0.0340 (0.1232) -0.2077*** (0.0801)
No. Observations 20,209 20,241
LR chi square 3,757.77 [0.000]
3,985.99 [0.000] Cleaning
Teleworker (Man) 0.1535 (0.0987) 0.0298** (0.0137) -0.0132 (0.1165) 0.0299** (0.0143) Teleworker (Woman) -0.2372* (0.1263) 0.0709 (0.0815) 0.4132** (0.1926) 0.0353 (0.0439)
No. Observations 20,209 20,241
LR chi square 4,265.87 [0.000]
4,459.90 [0.000] Ironing
Teleworker (Man) 0.2648*** (0.1032) -0.0507 (0.0610) 0.0888 (0.1373) 0.1749*** (0.0876) Teleworker (Woman) 0.0783 (0.1555) 0.1306 (0.0856) 0.1518* (0.0838) -0.0890 (0.0639)
No. Observations 20,209 20,241
LR chi square 3,903.31 [0.000]
3,844.16 [0.000] Childcare
Teleworker (Man) 1.0526*** (0.1757) 0.1492** (0.0681) 0.0770 (0.0712) 0.1672** (0.0770) Teleworker (Woman) 0.4166 (0.2828) 0.0077 (0.0112) -0.0701 (0.0867) 0.0412 (0.0928)
No. Observations 15,251 15,343
LR chi square 7,968.91 [0.000]
7,908.86 [0.000]
32
Table 8. Teleworking and Gender Roles Multinomial Fixed Effects Estimates for Non-Movers and Job Stayers
Panel A: Men Panel B: Women
Outcome: Mostly Self Outcome: Shared Outcome: Mostly Self Outcome: Shared Shopping
Teleworker (Man) -0.1378 (0.0982) -0.1420 (0.1004) -0.1513 (0.1449) -0.1604* (0.0901) Teleworker (Woman) -0.1524 (0.0998) -0.1916** (0.0773) -0.2113** (0.1074) -0.1745*** (0.0615)
No. Observations 11,523 11,714
LR chi square 3,007.99 [0.000]
3,070.24 [0.000] Cooking
Teleworker (Man) -0.0603 (0.0928) 0.0223* (0.0132) -0.0599 (0.0983) 0.2038** (0.0923) Teleworker (Woman) 0.0129 (0.0106) 0.1133** (0.0505) 0.2628** (0.1256) -0.0962 (0.0670)
No. Observations 11,523 11,714
LR chi square 3,358.80 [0.000]
3,379.79 [0.000] Cleaning
Teleworker (Man) 0.0912 (0.1189) -0.0433 (0.0634) -0.0032 (0.0192) 0.0313** (0.0148) Teleworker (Woman) -0.3323** (0.1636) 0.1266 (0.0825) 0.3781* (0.1954) 0.0459 (0.0560)
No. Observations 11,523 11,714
LR chi square 3,887.37 [0.000]
4,169.42 [0.000] Ironing
Teleworker (Man) 0.3411*** (0.1188) -0.0601 (0.0722) -0.0441 (0.0598) 0.2120** (0.0893) Teleworker (Woman) 0.1693 (0.1521) 0.1334 (0.0889) -0.0868 (0.0203) -0.0873 (0.0655)
No. Observations 11,523 11,714
LR chi square 3,371.64 [0.000]
3,745.39 [0.000] Childcare
Teleworker (Man) 0.0366** (0.0161) 0.1599** (0.0693) 0.0914 (0.0722) 0.1511** (0.0791) Teleworker (Woman) -0.0038** (0.0018) 0.0073 (0.0102) -0.1073 (0.1086) 0.0324 (0.0431)
No. Observations 9,624 9,652
LR chi square 8,189.19 [0.000]
8,379.60 [0.000]
33
Table 9. Probit-OLS Fixed Effects Happiness Function Estimates
DV: Men Happiness DV: Women Happiness
Teleworker (Man) 0.0469
(0.0421)
0.0438** (0.0212)
Teleworker (Woman) 0.0843**
(0.0412)
0.0070* (0.036)
Logarithm of Household Income 0.0288*
(0.0151)
0.0598*** (0.0168)
Number of Market Hours (Man)
-0.0019* (0.0010)
0.0010 (0.0013)
Number of Market Hours (Woman)
-0.0015* (0.0008)
-0.0025** (0.0011)
Age (Man) -0.0428***
(0.0127)
-0.0066 (0.0056)
Age Square ((Man) 0.00055**
(0.00011)
Age (Woman) -0.0020
(0.0052)
-0.0330** (0.0128)