Changes in Microstructures during Annealing after Cold-Rolling
at 30% and 50% Reduction on Al-Mg-Si Alloy
*1Atsushi Yamamoto, Masaaki Tsukamoto
*2and Daisuke Okai
Department of Material Science and Chemistry, Graduate School of Engineering, University of Hyogo, Himeji 671-2201, Japan
Recrystallization phenomena in an Al-Mg-Si alloy cold-rolled at 30 and 50% reduction rates were observed on the same area in specimens during annealing at 673 K using SEM-EBSD method. After recovery in a narrow sense occurred, coarse subgrain microstructures were formed by migrating high angle boundaries at both reduction rates. The coarse subgrain microstructure contained low angle boundaries, and orientation gradients were observed in contrast to the recrystallized microstructure. Lattice rotation due to cold-rolling was recovered in the coarse subgrain microstructures for the case of 30% reduction. When the specimen was cold-rolled at 50%, lattice rotation occurred over a broad range of angles. As a result, prior grain boundaries became unclear, and the majority of the subgrains were surrounded by high angle boundaries. Some of the subgrains showed the coarse subgrain microstructure, and the others grew into recrystallized grains. [doi:10.2320/matertrans.L-MZ201122]
(Received October 5, 2010; Accepted February 2, 2011; Published April 13, 2011)
Keywords: aluminum-magnesium-silicon alloy, scanning electron microscope-electron backscatter diffraction (SEM-EBSD), cold-rolling, recovery, recrystallization, same area observation
1. Introduction
Recrystallization is a dynamic phenomenon; thus, in-situ observations are useful for elucidating the mechanisms that govern the process. However,in-situoptical microscopy and
in-situ SEM (scanning electron microscope) observations
lack crystallographic information. Only thin foils can be observed using in-situ TEM (transmission electron micros-copy), and phenomena observed for foils are not the same as those observed for bulk specimens. In-situ SEM-EBSD (electron backscatter diffraction) method requires long measuring times; at least three to five minutes are necessary for one frame of an EBSD map. Microstructures undergo changes during such long periods of annealing.
The present authors attempted to carry out the same area observation on recrystallization1–5) with using an
SEM-EBSD system. Specimens were intermittently annealed and ion-polished after SEM observation, and then placed in the SEM again for EBSD measurements. This procedure began prior to cold-rolling, and was repeated up to about one hour of annealing time. Formation of recrystallized grains occur-red2) via SIBM (strain induced grain boundary migration) mechanism.6)Another mechanism in which small subgrains
grew into recrystallized grains was also observed.2) In the
case of SIBM, one can easily indicate the position of prior grain boundary in the micrograph which is taken after grain migration, and can easily understand the mechanism which causes the change in microstructure.In-situexperiments and observations of the same area observations are not necessary in such cases. Particle stimulated nucleation (PSN),7) and
nucleation in shear bands and in transition bands8)are in the
same category as SIBM. Such phenomena are easily identified. Although subgrain growth is a simple process that forms recrystallized grains, it is difficult to observe this process except by in-situ experiments or same area
observations, because the growth can not be observed within one micrograph.
About 60 years ago, Beck and Sperry6)reported that SIBM was the predominant mechanism for recrystallization after cold-rolling at up to a 40% reduction rates on pure aluminum. They suggested that the recrystallization process, including nucleation, became dominant when specimens were cold-rolled with reduction rates greater than 40%. In another paper,9)Beck used the term ‘‘crystallite’’ instead of ‘‘nuclei’’,
so he would recognize that the nuclei from which recrystal-lization originates are not nuclei in the thermodynamic sense but are small volumes which pre-exist in the deformed microstructure.10) Thus, it has been speculated that Beck
anticipated the formation of recrystallized grains from subgrains at higher reduction rates, but it was difficult to observe. Hutchinson also used the term ‘‘crystallite’’ and defined it in his paper as a volume having a virtually perfect lattice, which may be separated from its neighbors by either low or high angle boundaries.11)
In the present study, changes in microstructures during annealing after cold-rolling at a 50% reduction rate are compared with those after cold-rolling at a 30%.
2. Experimental Procedures
The material used was an Al-0.7%Mg-0.4%Si-0.2% Cr (mass%) alloy sheet with about 2 mm thickness. Specimens with about 10502mm were cut from the sheet as the longitudinal direction was parallel to the rolling direction. The specimens were solution heat treated at 813 K for 3.6 ks. The surfaces of the specimens were mechanically polished and then electropolished using a solution of perchloric acid:methanol¼1 : 8. Microvickers indentation was applied on the surface to identify the same area on a specimen during observations. After EBSD measurements on the solution heat treated specimens, the specimens were cold-rolled at 30 or 50% reduction. Small pieces with about6
61:3or661mm including the observed areas were cut from the specimens. The surfaces of the specimens were
*1The Paper Contains Partial Overlap with the ICAA12 Proceedings by
USB under the Permission of the Editorial Committee.
*2Graduate Student, University of Hyogo
Special Issue on Aluminium Alloys 2010
Ar-ion polished for 10.8 ks under an accelerating voltage of 3 kV, and then EBSD measurements were carried out on the cold-rolled specimens. The specimens were removed from the SEM and intermittently annealed at 673 K using a salt bath. The surfaces of the specimens were ion-polished for 180 s, and EBSD measurements were carried out. Intermit-tent annealing, ion-polishing and same area observation using SEM-EBSD were repeated up to about 3.6 ks of annealing. Preliminary experiments showed that the sizes of the subgrains formed during annealing were in the range of about 1 to 2mm, and the EBSD maps were taken with 0.1 to 0.5mmsteps.
In the present paper, grains that formed after the solution heat treatment are referred to ‘‘prior grains’’, while new grains that formed through recrystallization after annealing through recrystallization is called as ‘‘recrystallized grain’’, in the present study.
3. Results and Discussion
3.1 30% reduction
Typical microstructures observed in the specimen an-nealed at 673 K after cold-rolling with 30% reduction are shown in Fig. 1. Low and high angle boundaries are indicated by the white and black lines, respectively. Misorientation angles are less than 15 degree in the former, while they are greater than 15 degree in the latter. After annealing at 673 K for 60 s, prior grain interiors were composed of many subgrains surrounded by low angle boundaries, and SIBM of the prior grain boundary was observed as shown in Fig. 1(a). A large crystallite ‘‘a’’ is clearly observed, and small crystallites ‘‘b’’ and ‘‘c’’ are indicated by the arrows in Fig. 1(a). Microstructures of the same area after annealing for 240 s are shown in Fig. 1(b). The density of subgrain boundaries decreased, which is typically observed in the areas indicated by the rectangles in grains A and B in Fig. 1(a) and (b). The crystallites formed by SIBM grew invading grain A as shown in Fig. 1(b). There are low angle boundaries in the area formed by SIBM. Such a type of SIBM is called as ‘‘multiple subgrain SIBM12)’’, and explained that the migrating boundary dragged small angle boundaries. However, orientation analysis for SIBM a, b and c in Fig. 1(a) and a0, b0 and c0 in Fig. 1(b) showed that the orientations of a, b and c were same as those of a0, b0and c0, respectively. Single subgrain SIBM a, b and c separately grew, and low angle boundaries were formed between them when they encountered each other.
On grains A and B, 001 pole figures before and after cold-rolling are shown in Fig. 2(a) and (b), respectively. Black open circles indicate the 001 poles before cold-rolling, while black dots indicate the poles after rolling. The orientation was rotated by cold-rolling and spread out within a range of about 10 to 20 degree. Black dots in Fig. 2(c) and (d) show the 001 poles on the areas indicated by the rectangles in grains A and B in Fig. 1(b), respectively, along with the 001 poles before cold-rolling, which are indicated by the black open circles. Lattice rotation and distribution of poles were not signifi-cantly changed by annealing at 673 K for 240 s. ‘‘Recovery’’ in a narrow sense defined as a decrease in dislocation density and rearrangement of dislocation substructures to form
‘‘subgrain microstructures with low angle boundaries’’. Lattice rotation was not affected by recovery in a narrow sense.
Another type of microstructure is shown in Fig. 3. In the prior grains C, D and F, fine subgrain microstructures with low angle boundaries were formed at 673 K for 60 s (Fig. 3(a)). In the prior grain E, a fine subgrain micro-structure with near 001 orientation (red area) and coarse subgrain microstructures with about 111 orientation (blue area) were observed. High angle boundaries were formed between these areas. With increasing annealing time, the high angle boundaries surrounding the blue area invaded the red area remaining low angle boundaries, as shown in Fig. 3(b) and (c), forming coarse subgrain microstructures (blue areas). There are gradations in color in the coarse subgrain micro-structure. Color gradation indicates the orientation gradient; therefore, this microstructure is different than the recrystal-lized microstructure. The area ‘‘f’’ was formed through SIBM of the prior grain boundary, and grew into the recrystallized grain No. 5. The coarse subgrain microstructure that remained behind the migrating boundary was consumed by other SIBM or recrystallized grains, resulting in immigration of the prior grain E into the neighboring grain as the recrystallized grain No. 5.
Although high angle boundaries in the coarse subgrain microstructure migrated in grain E, crystallites for recrystal-lized grains did not form. Orientation analysis of area ‘‘c’’ and the recrystallized grain No. 9 showed that they were different from one another. Migration of high angle boundaries did not always provide areas with low density of dislocation or low angle boundaries; even on prior grain boundaries, the orientation gradient remained after migration as shown in area ‘‘g’’ in Fig. 3(d).
On the prior grain E, 001 pole figures before and after cold-rolling are shown in Fig. 4(a). Pole figures on the fine subgrain microstructure ‘‘a’’ indicated by the rectangle in Fig. 3(a) are shown in Fig. 4(b) along with the poles before cold-rolling. Recovery in narrow sense does not change the pole figures taken at the as-cold-rolled stage. The 001 poles on the area from ‘‘b’’ to ‘‘e’’ in the coarse subgrain microstructure, indicated by the rectangles in Fig. 3(b), are shown in Fig. 4(c)–(f), respectively. Black open circles show the 001 poles before cold-rolling on grain E. The orientations of these areas are not similar to those in the cold-rolled stage, Fig. 4(a), or the recovered stage, Fig. 4(b), but were quite similar to the orientation before cold-rolling. Recovery in a narrow sense was accomplished to form the fine subgrain microstructures such as those shown in area ‘‘a’’ in Fig. 3(a). The region composed of coarse subgrains grew with invading the fine subgrain microstructure which was formed by recovery in narrow sense. Therefore, such a coarse subgrain microstructure is referred to as a ‘‘secondary recovered region’’ in this paper.
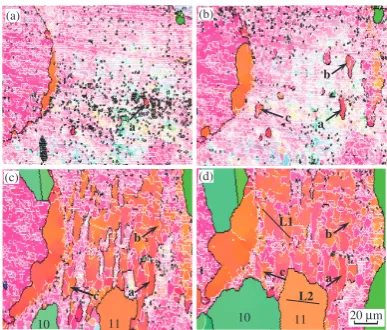
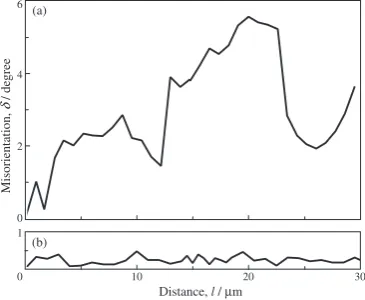
and ‘‘c’’ in Fig. 5(b). The high angle boundaries migrated, consuming the fine subgrains. Low angle boundaries re-mained after migration of the high angle boundaries. Misorientation profiles along the lines ‘‘L1’’ and ‘‘L2’’ are shown in Fig. 6. The orientation gradient is obvious in the profile along line L1 as shown in Fig. 6(a), which is in the secondary recovered region. Misorientation in the profile along line L2, which is in the recrystallized grain No. 11, was less than 0.5 degree as shown in Fig. 6(b).
3.2 50% reduction
Microstructures formed in the specimen annealed at 673 K for 6 s after cold-rolling with a reduction rate of 50% are shown in Fig. 7. Prior grain boundaries became unclear and are roughly indicated by the broken lines in Fig. 7(a). The
(b)
(c)
(d)
20 μm 1
5 f
2
8 6
7
D
C
F
E
(a)
a
c e
d b
4
9 3 c
g
g
Fig. 3 Changes in microstructures. Annealed at 673 K for 60 s, 120 s, 240 s and 1.2 ks, (a) to (d), respectively after cold-rolling at 30% reduction.
RD
RD
TD
RD
TD
(a) (b)
(c) (d)
(e) (f)
Fig. 4 Black open circles show 001 poles of the grain ‘‘E’’ before rolling. Black dots in (a) show 001 poles of the grain ‘‘E’’ after cold-rolling, and those in (b) to (f) show 001 poles for the areas in the grain E indicated by the rectangles ‘‘a’’ to ‘‘e’’ in Fig. 2(a) and (b), respectively.
(a) (b)
(c) (d)
20 μm 11
10 11
10
L2 L1 a
b
c
a b
c
c b
a a
Fig. 5 Changes in microstructures during annealing at 673 K. (a) 60 s, (b) 240 s, (c) 600 s, (d) 1.2 ks.
RD
(a) (b)
(c) (d)
RD
TD TD
Fig. 2 001 poles on the grains A and B. Black open circles show the 001 poles before cold-rolling. Black dots in (a) and (b) show the poles after cold-rolling in the grain A and B, respectively. Black dots in (c) and (d) show the poles on the areas indicated by the rectangles in the grains A and B shown in Fig. 1(a), respectively.
(a)
A
B
b a
c
b' a'
c' (b)
20 μm
[image:3.595.345.509.71.317.2] [image:3.595.72.267.72.153.2] [image:3.595.86.251.207.379.2] [image:3.595.329.523.388.553.2] [image:3.595.71.265.452.760.2]inset in Fig. 7(a) shows the microstructure before cold-rolling on the same area. The 001 poles on areas included in grains ‘‘A’’, ‘‘B’’ and ‘‘C’’ are denoted by the black dots in Fig. 7(b), (c) and (d), respectively. The black open circles in Fig. 7(b), (c) and (d) denote the 001 poles before cold-rolling for grains ‘‘A’’, ‘‘B’’ and ‘‘C’’, respectively. After cold-rolling and annealing at 673 K for 6 s, 001 poles were distributed over a broad range of angles, increasing the misorientation among subgrains. Most subgrains were surrounded by high angle boundaries, as shown in Fig. 10 at higher magnification.
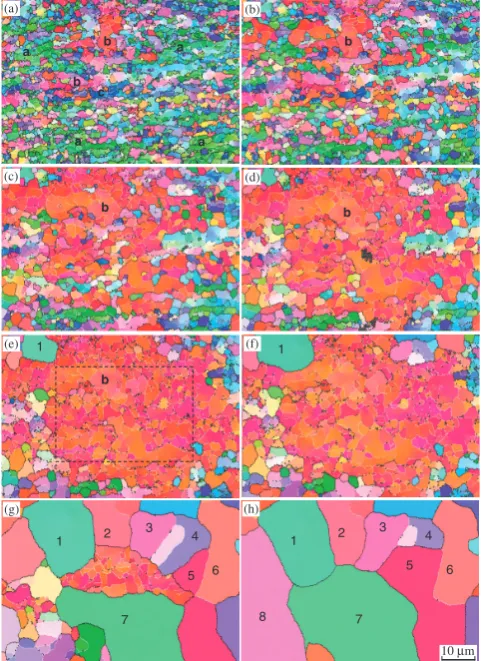
Changes in the microstructures in the area indicated by the rectangle in Fig. 7(a) are shown in Fig. 8. Subgrains with 110 orientation (green) were predominant at the early stage of annealing, which is indicated by ‘‘a’’ in Fig. 8(a). Subgrains with 001 orientation (red) and 111 orientation (blue) were also observed, which are indicated by ‘‘b’’ and ‘‘c’’ in Fig. 8(a), respectively. Upon annealing, subgrains with 001 orientation (red) grew to form a secondary recovered region, indicated by ‘‘b’’ in Fig. 8(b).
The image quality (IQ) value used in EBSD analysis describes the quality of an electron backscattered pattern. Lattice defects such as dislocations decrease the IQ value, leading to dark images in IQ maps. The IQ map of the specimen annealed for 120 s is shown in Fig. 9. The black rectangle indicates the area corresponding to the entire view field of Fig. 8(e). The contrast in the grain indicated by the white arrow ‘‘1’’ in the rectangle in Fig. 9 is brighter than that of other areas. The dislocation density in this grain was low; that is, the grain was the recrystallized grain No. 1 indicated in Fig. 8(e). The secondary recovered region is shown with darker contrast than the recrystallized grains, because the dislocation density was not as low as that in the recrystallized grains. Such an area may be misinterpreted as a deformed area when the observation is carried out using an optical microscope. On the other hand, when the observation is carried out using a SEM-EBSD system, such an area shows relatively clear IPF images, like those in Fig. 8(e), which may also be misinterpreted as recrystallized areas. However, strain remained due to lattice defects, as shown in Fig. 9.
Careful orientation analyses on subgrains identified crys-tallites for some of the recrystallized grains shown in Fig. 8(h). Figure 10(a) shows microstructures on the same
area as Fig. 8 after annealing at 673 K for 6 s. The 001 poles for the subgrains indicated by arrows 1, 3, 4 and 6 in Fig. 10(a) are denoted by the red solid circles in Fig. 10(b)– (e) by the red solid circles, respectively. The 001 poles of the recrystallized grains with the same numbers after annealing for 1.2 ks (Fig. 8(h)) are also indicated by the black solid circles in each figure. Good correspondences between the orientation of the subgrains and recrystallized grains indicate that the subgrains are the crystallites for the recrystallized grains. The black dots in Fig. 10(b) to (e) show the 001 poles of the secondary recovered region indicated by the rectangle b in Fig. 8(e). The orientation of the recovered region does not correspond with those of the recrystallized grains. The secondary recovered region did not provide crystallites for the recrystallized grains.
Although most of the subgrains formed by cold-rolling at 50% reduction rate were surrounded by high angle boundaries, there would be subgrains with relatively similar orientation. High angle boundaries between, such subgrains can easily migrate. However, low angle boundaries remained after migration forming secondary recovered regions that contained many low angle boundaries. In contrast, high angle boundaries between subgrains with relatively large misor-ientation could not easily migrate. However, the large misorientation prevents the subgrain from being invaded by recovered regions. When such a subgrain is surrounded by the recovered region, the high angle boundaries migrate with consuming the recovered region without remaining low angle boundaries becoming recrystallized grains.
The previous paper2)reported that recrystallized grains are
formed from subgrains at 30% reduction. In the present paper, formation of recrystallized grains from subgrains was also shown on the specimen that was cold-rolled at 50% reduction. SIBM was not observed at 50% reduction, because the prior grain boundaries became unclear. Secondary recovered regions were observed for specimens cold rolled at both 30% and 50% reduction. The recrystallization mechanism did not change when the reduction rate increased up to 50%.
In the present study, specimen surfaces were ion-polished for 180 s after each annealing period. For the specimen annealed for 1.2 ks, the accumulative sputtering time was 1.8 ks. Figure 11(a) and (b) show the IQ maps of the specimen at the as-cold-rolled stage and after annealing for 1.2 ks, respectively (i.e., the surface was ion-polished for 1.8 ks in Fig. 11(b)). The same area was observed in Fig. 11(a) and (b). Inclusions with about 0.5mmdiameters are indicated by the arrows a and b in Fig. 11(a). The same inclusions are clearly observed with no change in shape in Fig. 11(b), as indicated by the arrows. The thickness of the sputtered layer would be less than the diameter of these inclusions. Therefore, changes in the microstructures shown in the present study were not attributed to changes in depth due to sputtering.
Strain induced by rolling was not uniformly distributed through the thickness of the specimen; strain was higher in regions closer to the surface. However, only surface area can reveal changes in the microstructures before and after cold-rolling in the same view field. Therefore, inner regions of the specimens were not observed in the present study. The
20 30
Distance, l / μm
1
0 10
2 4 6
0
Misorientation,
δ
/ de
gree
(a)
(b)
[image:4.595.77.260.74.224.2]reduction rates of 30 and 50% represent averaged thickness values. The observed areas suffered from higher strains than the averaged values.
In the specimens cold-rolled at both 30 and 50% reduction, coarse subgrain microstructures were observed due to
migration of high angle boundaries, which were increasingly invaded and consumed by recrystallized grains with increas-ing annealincreas-ing time.
4. Summary
Recrystallization phenomena in an Al-Mg-Si alloy after cold-rolling at 30 and 50% reduction were observed by the same area observation using SEM-EBSD system.
Coarse subgrain microstructures were formed by migration of high angle boundaries at both reduction rates. Low angle boundaries were contained, and an orientation gradient was observed in the coarse subgrain microstructure. At 30% reduction, lattice rotation due to cold-rolling was recovered in the coarse subgrain microstructures.
50 μm
1
1
Fig. 9 Assorted IQ map showing the whole view field of the present study after annealing at 673 K for 120 s. The view field shown in Fig. 8 is indicated by the rectangle.
1 (a)
5 μm
3 4
6
3
TD (c)
6
TD (e) 1
TD (b)
RD 4
[image:5.595.313.541.71.244.2]TD (d)
Fig. 10 Microstructure of the specimen after annealing at 673 K for 6 s (a). Crystallites for the recrystallized grains No. 1, 3, 4 and 6 shown in Fig. 8 are indicated by the arrows in (a). 001 poles for the crystallites shown in (a) and those for the recrystallized grains after annealing at 673 K for 1.2 ks (Fig. 8(h)) are shown with red solid circles and black solid circles, respectively, in (b) to (e).
a a
a a
b
b c
b
b b
b
4
(a) (b)
(c) (d)
(e) (f)
(g) (h)
7 1
5
8
2 3
6
10 μm 4
7 1
5
2 3
6 1 1
Fig. 8 Changes in microstructures during annealing at 673 K in the area indicated by the rectangle in Fig. 7(a). (a) 10 s, (b) 20 s, (c) 40 s, (d) 60 s, (e) 120 s, (f) 240 s, (g) 600 s, (h) 1200 s.
(c)
(b) (d)
RD
TD TD TD
20 μm
A B
C (a)
50 μm A
C B
[image:5.595.52.287.72.273.2] [image:5.595.306.546.296.529.2] [image:5.595.48.289.340.671.2]Lattice rotation was very large in the specimen after cold-rolling at 50%, making the prior grain boundaries unclear, and SIBM was not observed. Most subgrains had high angle boundaries. Migration of the high angle boundaries formed coarse subgrain microstructures and recrystallized grains.
REFERENCES
1) A. Yamamoto and S. Fukumoto: J. JILM59(2009) 479–485. 2) A. Yamamoto: J. JILM60(2010) 68–74.
3) A. Yamamoto: J. JILM60(2010) 124–128.
4) A. Yamamoto: Proc. Int. Symposium on Proc. Fabrication of Advanced Materials XVIII, (176th Committee on Process Created Materials Function Japan Society for the Promotion of Science, 2009) pp. 149– 156.
5) A. Yamamoto: Proc. 12th Int. Conf. on Aluminum Alloys, (The Japan Institute of Light Metals, 2010) pp. 131–136.
6) P. A. Beck and P. R. Sperry: J. Appl. Phys.21(1950) 150–152. 7) O. Engler, P. Yang and X. W. Kong: Acta Mater.44(1996) 3349–3369. 8) J. Hjelen and R. Orsund: Acta Metall. Mater.39(1991) 1377–1404. 9) P. A. Beck: Trans. AIME194(1952) 979–980.
10) F. J. Humphreys and M. Hatherly: Recrystallization and Related Annealing Phenomena, 2nd Ed., (Elsevier, 2004) p. 251.
11) B. Hutchinson: Scr. Metall. Mater.27(1992) 1471–1475.
12) F. J. Humphreys and M. Hatherly: Recrystallization and Related Annealing Phenomena, 2nd Ed., (Elsevier, 2004) p. 252.
5 μm (a)
(b)
a b
a
[image:6.595.56.283.70.316.2]b