DEVELOPMENT OF PROCEDURES FOR ASSESSING THE
EFFECT OF STROKE RATE ON PHYSIOLOGICAL VARIABLES
DURING ERGOMETER ROWING
J.J. Forsyth
A Thesis Submitted for the Degree of PhD
at the
University of St Andrews
1995
Full metadata for this item is available in
St Andrews Research Repository
at:
http://research-repository.st-andrews.ac.uk/
Please use this identifier to cite or link to this item:
http://hdl.handle.net/10023/135367
Name: J. J. Forsyth
Degree: M.Phil.
ProQuest Number: 10166293
All rights reserved
INFORMATION TO ALL USERS
The quality of this reproduction is dependent upon the quality of the copy submitted.
In the unlikely event that the author did not send a com plete manuscript and there are missing pages, these will be noted. Also, if material had to be removed,
a note will indicate the deletion.
uest
ProQuest 10166293
Published by ProQuest LLO (2017). Copyright of the Dissertation is held by the Author.
All rights reserved.
This work is protected against unauthorized copying under Title 17, United States C ode Microform Edition © ProQuest LLO.
ProQuest LLO.
789 East Eisenhower Parkway P.Q. Box 1346
Abstract
To determine the effect of stroke rate on lactate concentration, oxygen consumption and heart rate during ergometer rowing, pilot investigations were necessary to clarify methodological procedures.
To examine the validity of using blood taken from the toe for the assessment of plasma lactate concentration, values were compared with those taken from the fingertip and earlobe. Subjects («=9) exercised at work intensities corresponding to 76.4±6.1% and 91.4±4.7% of estimated heart rate maximum for 4 minutes. No significant differences (p>0.05) were found between any of the sites at either work intensity. The toe has the advantage that repeated blood samples may be removed without inteniipting the rowing action.
A test to establish maximum oxygen consumption (V02max) was developed for the Concept ÏI rowing ergometer and examined for validity and reliability in 31 rowers. Re-test data for V02max proved reliable (r=0.86), although not all of the criteria for ascertaining whether a V0 2max value had been achieved, were satisfied.
This was due to differences in response to maximal exercise among individuals. A final respiratory exchange ratio (RER) of 1.10 rather than 1.15 was recommended as a criterion for establishing V0 2max for club level rowers.
To determine the highest level of work that can be sustained during rowing exercise without an increase in plasma lactate concentration, 30 subjects exercised for 10 minutes at work intensities corresponding to 75%, 85% and 95% V02max. From the results, it was hypothesised that subjects could work for 7 minutes at 80% V0 2max without significant differences occurring in plasma lactate concentration
taken in the last minute of exercise of successive tests. These values were confirmed with a further study on 11 subjects.
Declarations
(i) I, Jacky J Forsyth, hereby certify that this thesis, which is approximately 38,000 words in length, has been written by me, that is the record of work carried out by me and that is has not been submitted in any previous application for a higher degree.
date^ Q. . * . signature of candidate
(ii) I was admitted as a research student in September, 1992 and as a candidate for the degree of M.Phil. in September, 1992; the higher study for which this is a record was carried out in the University of St. Andrews between September 1992 and March 1995.
date..7 : ^ . . 9 . . signature of candidate ...
(iii) I hereby certify that the candidate has fulfilled the conditions of the Resolution and Regulations appropriate for the degree of M.Phil. in the University of St. Andrews and that the candidate is qualified to submit this thesis in application for that degree.
date2$!&..^AoAt.):5^^ signature of supemsor
A Unrestricted
In submitting this thesis to the University of St. Andrews I understand that I am giving permission for it to be made available for use in accordance with the regulations of the University Library for the time being in force, subject to any copyright vested in the work not being affected thereby. I also understand that the title and abstract will be published, and that a copy of the work may be made and supplied to any bona fide library or research worker.
Acknowledgements
I would like to thank all the rowers who participated as subjects both in the informal pilot investigations and in main studies. I am extremely grateful to them for the time they gave up for me, for their energy, and for the enthusiasm they showed towards my work.
I would also like to thank Ellis Jaffray, Murray Coutts and Dr Peter Jupp, who helped me gain knowledge in areas in which I was initially lacking, and to John Pearson (Architect and Design Consultant) for the last minute preparation of drawings.
I would like to thank the Department of Physical Education, since the opportunity to do this research was only possible by being employed on a part-time basis in the department.
CHAPTER 1
Introduction... 1
1.1 Overview...2
1.2 Problem Statements and Hypotheses... ...4
CHAPTER 2 Review of literature...5
2.1 Introduction... 6
2.2 The Physiology of Rowing...6
2.3 Blood Lactate Concentration...8
2.3.1 Background ... 8
2.3.2 "AT" definitions and methodology ...8
2.3.3 Blood lactate concentration and endurance performance...10
2.4 Blood Lactate Concentration and Rowing...11
2.5 Laboratory Measurement of Physiological Variables in Rowing...14
2.5.1 Lactate... 14
2.5.2 V02max...16
2.5.3 The rowing ergometer...18
2.6 Biomechanical Aspects of Rowing... 19
2.6.1 The rowing technique... 19
2.6.2 Components of velocity...21
a) Force... 21
b) Stroke length... 22
i) Rigging...22
ii) Oarsperson...22
c) Stroke rate... 23
d) Drag... 24
2.7 Laboratory Measurement of Mechanical Variables in Rowing...25
2.7.1 Ergometer measurements... 25
2.8 The Effect of Mechanical Changes on Physiological Variables...26
2.9 The Effect of Stroke Rate on Oxygen Consumption and Lactate...26
2.10 Summary and Research Implications...28
CHAPTERS A comparison of plasma lactate concentration collected from the toe, ear and fingeitip following simulated rowing exercise...29
3.1 Introduction... 30
3.2.1 Subjects...30
3.2.2 Equipment...31
3.2.3 Procedures...31
3.2.4 Blood sampling...32
3.2.5 Statistical Analysis...33
3.3 Results... 33
3.4 Discussion...35
CHAPTER 4 Development of a V02max test using the Concept II rowing ergometer... 37
4.1 Introduction... 38
4.2 Methodology...39
4.2.1 Subjects...39
4.2.2 Protocol - rationale and justification of design...39
4.2.3 Procedures... ...40
4.2.4 Reliability test...42
4.2.5 Statistical procedures... 43
4.4 Results... 43
4.4.1 V02maxdata...43
4.4.2 Re-test data... 45
4.5 Discussion...46
4.5.1 Verification of V02max... 46
4.5.2 Reliability data...47
4.5.3 Additional findings...48
4.5.5 Summary and recommendations... 50
CHAPTER S Determination of the highest level of work that can be sustained during prolonged rowing exercise, without an increase in plasma lactate concentration... 52
5.1 Introduction... 53
5.2 Methodology...54
5.2.1 Subjects...54
5.2.2 Procedures...55
5.2.3 Statistical analysis...56
5.3 Results... 56
5.4 Discussion... 60
5.4.2 Seven minute 80% V02max tests...62
5.4.3 Seven minute 80% V02max tests: results and discussion ... 63
CHAPTER 6 Direct measurements of force, stroke rate and stroke length from the Concept II rowing ergometer using computerised instrumentation...68
6.1 Introduction... 69
6.2 Instrumentation... ... 70
6.2.1 Force...70
6.2.2 Stroke length... 70
6.3 Discussion and Research Implications...72
CHAPTER? Summary and concluding remarks ...74
REFERENCES...78
APPENDICES ... 96
Appendix 1 Four minute test... 97
Appendix 2 Test protocols from BOMC and National Sports Medicine Institute... 99
Appendix 3 Pilot work on V02max...102
Appendix 4 Design of computerised instrumentation and software...109
A4.1 Software programme... 110
Appendix 5 ANOVA tables...116
AS. 1 ANOVA Tables for Chapter 3 ... 117
A5.2 Chapter 5 Tables for Resting values... 119
A5.3 Chapter 5 ANOVA Tables: 2-way Analysis on VO2 ...121
A5.4 Chapter 5 ANOVA Tables: 1-way Analysis on VO2 ... 123
A5.5 ANOVA Tables for 7 Minute Tests at 80% V 02m ax...126
Appendix 6 Additional materials... 131
A6.1 Information for Subjects... 132
A6.2 Pre-test Questionnaires and Consent Forms... 135
A6.3 Sample Data Recording Fonns... 138
Appendix 7 Correspondence regarding V 02max test... 143
LIST OF TABLES
Table 2.1 Adaptation of FISA guidelines for the prescription of training
intensities... ...13
3.1 Physical characteristics of subjects...31
3.2 Summary of performance data at the two estimated work intensities... 33
3.3 Mean lactate values (mmol-H) found in plasma... 34
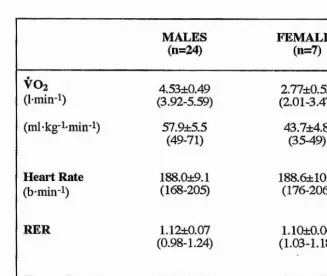
4.1 Mean, standard deviation and range of maximum values...44
4.2 Reliability results for 11 subjects (10 males, 1 female)...45
5.1 Resting plasma lactate concentration and heart rate values for all subjects (n=30)... 57
5.2 ANOVA 2-way analysis of variance for plasma lactate concentration at 75% V02max...57
5.3 ANOVA 2-way analysis of variance for plasma lactate concentration at 85% V 02max ...58
5.4 Mean values for plasma lactate concentration, oxygen consumption, heart rate and cumulative distance rowed taken during the last minute of successive 7 minute tests at 80% V02max... ...63
A 1.1 Example of intensity prediction table... 98
A5.1.1 to A5.5.9 ANOVA tables...117-130 LIST OF FIGURES Figure 2.1 Method of detecting the I AT...10
2.2 Hypothetical graph showing boat velocity and position of rower...20
2.3 Effect of adjusting span or outboard on rowing arc...23
4.1 Criteria taken from the BASS Position Statement on the Physiological Assessment of the Elite Competitor...38
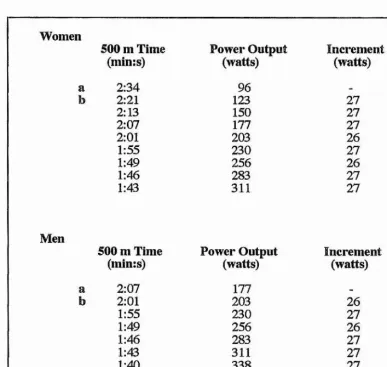
4.2 Continuous incremental test for establishing V02max... 41
4.3 Revised protocol...50
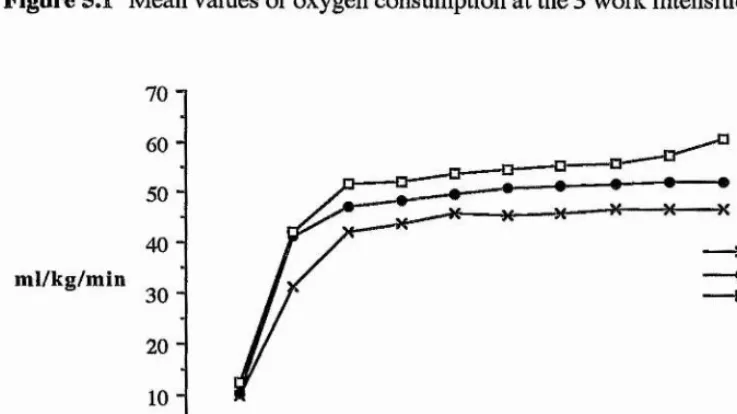
5.1 Mean values of oxygen consumption at the 3 work intensities... 59
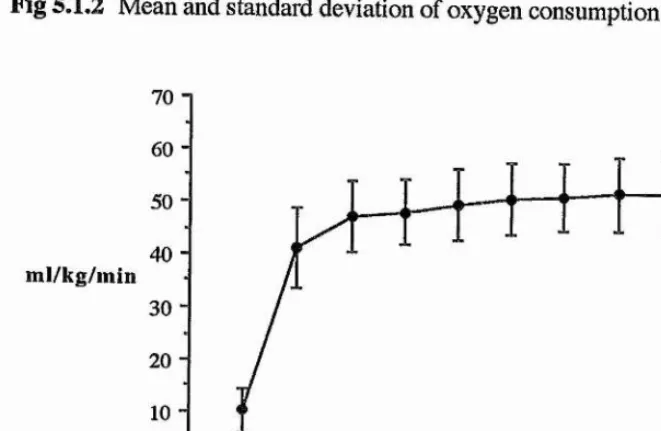
5.1.1 At 75% V02max...61
5.1.2 At 85% V02max...61
5.1.3 At 95% V02max...62
6.1 Force strain gauge... 71
[image:12.618.128.515.486.730.2]6.3 Lay-out of all instrumentation... 71
A3.1 .Protocol A ... 103
A3.2 Protocol D ...104
A3.3 Heart rate response of female subject to protocol A ... 105
A3.4 Heart rate response of female subject to protocol B ... 105
A3.5 Heart rate response of male subject to protocol C ...106
A3.6 Heart rate response of female subject to protocol D ... 107
A3.7 Heart rate response of female..subject to protocol E ... 107
A3.8 Heart rate response of male subject to protocol E ... 108
A4.1 Interface block system diagram... 113
A4.2 Strain gauge amplifier... 114
A4.3 Stroke movement detector... 115
A5.1.1 Normal probability plot... 118
Abbreviations
AT Anaerobic threshold
BASES British Association of Sports and Exercise Sciences
BASS British Association of Sports Sciences
BOMC British Olympic Medical Centre
EDTA ethylenediaminetetra-acetic acid
OPT Glutamate-pyruvate transaminase
lAT Individual anaerobic threshold
LDH L-Lactate dehydrogenase
LT Lactate threshold
NAD Nicotinamide-adenine dinucleotide
OBLA Onset of blood lactate accumulation
OPLA Onset of plasma lactate accumulation
RER Respiratory exchange ratio
VT Ventilatory threshold
1.1 Overview
In rowing, successful performance is determined by several factors that concern both the rower and the equipment. The rower can enhance performance by optimising levels of anxiety and motivation (Raglin et al,, 1990), working on technique (Schwanitz, 1991), and by improving his or her endurance capacity, strength and power (Bloomfield and Roberts, 1972; Hagerman et al., 1972; Larason and Forsberg, 1980). Performance is also influenced by the type of boat and the blades used, both of which can be adjusted (referred to as rigging) to cater for anthropometrical and physiological variances of the rower (Herberger et al., 1990). An understanding of boat mechanics and rigging is important for examining, for instance, how power is applied to the water by the blade, and for determining the optimum stroke rate and stroke length to suit the individual (Hollmann, 1988; Millward, 1987; Roth, 1991; Sanderson and Martindale, 1986). It is not known which of these many factors has the biggest influence on performance nor how they are interrelated, but in terms of physiology, it seems that aerobic or endurance capacity of the rower is of paramount importance judging on the amount of research that has been conducted within this area. A 2000 m competitive rowing race, which can last between 5.5 to 8 minutes depending on the boat type, has been found to be fuelled largely by aerobic processes (Droghetti et al., 1991). Rowing has therefore been described as one of the most physiologically demanding endurance spoils there is (Spinks, 1986).
Maximal oxygen uptake (V02max) has long been considered as the best single criterion measurement of endurance capacity (Robinson et al., 1937; Sutton, 1992). In rowing, V02max has consequently been used as a means of assessing performance and even as a tool for selection (Hagerman and Howie, 1971). Several studies have suggested that measuring blood lactate concentration during constant exercise, in particular the highest work intensity at which lactate does not increase beyond the initial transient, may be a more valid indicator of an individual's endurance capacity (Davis, 1985; Farrell et al., 1979). The occurrence of this marked increase in lactate during prolonged exercise has been given several names and definitions, including the anaerobic threshold, onset of blood lactate accumulation and the lactate threshold. Whichever term or method is used to describe the phenomenon, the belief is that exercising above this work intensity will result in a deterioration of performance due to fatigue (Stegmann et al., 1981). For this reason, blood lactate concentration values have been used to establish training and competition exercise intensities. An additional advantage of measuring lactate concentration over V0 2max, is that changes in blood lactate continue to occur as a
In the rowing race, it is important for the performer to sustain a high intensity of exercise without an excessive amount of lactate accumulating in the blood. Consequently, information concerning blood lactate concentration is considered to be beneficial to the rower. However, there has been far less research on lactate measurements carried out in rowing than there has been in other more popular sports such as running and cycling. Hence, certain methodological and logistical considerations remain unresolved, such as how blood lactate can be sampled in a continuous rowing test without disruption to the rowing stroke. It is also not known how variables such as stroke rate affect the behaviour of lactate. In cycling, for instance, researchers have found that there are pedal frequencies for certain workloads that are more efficient in terms of oxygen cost and the amount of lactate accumulating in the blood (Buchanan and Weltman, 1985; Hagberg et al., 1981, Hughes et al., 1982; Lôllgen et al., 1980). Likewise in swimming, Wakayoshi et al., (1995) have related stroke rate with oxygen consumption to establish a rate that effectively could be used to improve performance. If there are optimal pedal rates in cycling and there is an optimum stroke rate in swimming, the same might be true for rowing. Stroke rate, as well as force, power and stroke length, is one of the mechanical components essential for boat progression, since increasing stroke rate will increase boat speed (di Prampero, 1986; Fukunaga et al., 1986). However, if an increase in stroke rate is found to be related to an exponential increase in lactate concentration or to an increase in oxygen consumption, there might be an upper limit or optimal stroke rate in terms of physiological performance.
1.2 Problem Statements and Hypotheses
The main purpose of this study is to develop procedures to examine the effect of stroke rate on the physiological variables of blood lactate concentration, oxygen consumption and heart rate, as well as on the mechanical variables of stroke length, force and power.
It is hypothesised that changes in stroke rate will influence how and when force is applied during the stroke, the length of stroke, and will also affect physiological responses. Before this hypothesis can be tested, a series of investigations need to be carried out, the objectives of which are:
i) to compare plasma lactate concentration taken from the toe with that from the earlobe and fingertip. The objective of this is to enable the toe to be used as a sampling site during a continuous test protocol, since taking blood from the toe will not interfere with the rowing action. It is hypothesised that plasma lactate concentration taken from the toe will not differ significantly with that from the earlobe or fingertip;
tt) to develop a V02max test suitable for the Concept II rowing ergometer that is valid and reliable according to the guidelines set by the British Association of Sports Sciences (Hale et al., 1988). This will allow a relative percentage of V0 2max to be ascertained;
iii) to determine the minimum amount of time required for lactate to reach a steady state concentration when subjects are exercising at the highest work intensity that can be sustained without excessive increases in lactate. It is hypothesised that if subjects exercise at this intensity for this amount of time, values for plasma lactate concentration, oxygen consumption and heart rate taken during the last minute of exercise will not differ significantly on repeat tests;
2.1 Introduction
This chapter will provide a general review of the rowing research that has taken place to date. The relative merits of using V02max and blood lactate concentration to assess endurance capacity will be discussed and rowing studies using these measurements will be reviewed. Areas of weakness in the methodological assessment of V0 2max and blood lactate concentration during
rowing ergometry will be highlighted. The importance of stroke rate and how it could affect performance as well as consideration of other mechanical variables such as force and stroke length will be examined. The areas thought to require further investigation will then be addressed.
2.2 The Physiology of Rowing
The first attempt to describe the physiology of rowing was by Liljestrand and Lindhard in 1920 involving an ordinary rowing boat. This was followed with work by Henderson and Haggard (1925) who examined energy expenditure when rowing in a crew racing boat. Later in 1968 various physiological tests were carried out on two rowers who had won gold medals at the Olympic Games that year (Nowacki et al., 1969). From the results of these studies and others that followed (Hagerman and Howie, 1971; Hagerman et al., 1972; Jackson and Secher, 1976), it became clear that rowing required an extremely high aerobic capacity of the oarsperson. A measurement of maximum oxygen consumption was, at the time, considered to be a valid indicator of aerobic capacity. Most of the research in rowing during this time, therefore attempted to ascertain a value forV0 2max among elite rowers, and to use
this as a prerequisite of successful performance. From reviews of the research by Secher (1983 and 1993), and by Spinks (1986) the V02max of a heavyweight oarsman competing at national and international level, was regularly found to be above 6.0 l*min-l with an average of 6.4 to 6.61-min-k For lightweight men (under a weight of 72 kg) aV02max of 5.1±0.7 l-min'^ has been reported, and for women of all weight categories a value of 4.1±0.4 Fmin"^ (Hagerman et al,, 1979).
winning crews also contained the heavier individuals, with body weight correlating significantly with final placing (r=0.74). When V02max was expressed per kilogram of body weight, the relationship to final placing was weak (r=0.38). The idea behind this information, however, was given great value by the coach, and became the basis of selection processes world-wide (Hagerman, 1984; Hagerman and Howie, 1971; Wright et al, 1976).
Before discussing the merits and drawbacks of using V02max to assess and delimit performance, a more detailed examination will be given as to why aerobic capacity is so important in rowing. Internationally rowers compete over a distance of 2000 m. For heavyweight males racing in a single scull, this takes on average 7.5 minutes (Osbourne, 1995). For the same category of men, but in a crew boat with 8 members plus cox, the race lasts approximately 5.5 minutes, and for lightweight women (less than 59 kg) competing in single sculls, the same distance can take 8.5 minutes (Osbourne, 1995). It is therefore to be expected that energy contributions in a 2000 m race will vary according to the type of boat and to the category of the performer. Attempts made to measure energy contribution will only give an estimate of an average race performance. With this in mind, 70% to 85% of energy sources have been found to derive from aerobic glycolysis (Droghetti et al., 1991; Hagerman, et al., 1978; Peltonen and Rusko, 1993; Secher, 1993), 14% from the lactic acid system and 8% from the phosphagen system (Hagerman, 1984, Spinks, 1986). The contribution of aerobic metabolism is therefore considerable and might even be greater with different race conditions. The first 30 to 40 seconds of a typical race for a crew boat usually involves a sprint with stroke rate between 40 and 44 strokes per minute. This is followed by a high intensity steady state type of exercise with a stroke rate of around 36 to 42 strokes per minute, which continues until the final sprint for the finish when the intensity is again increased (Steinacker, 1993). The middle steady state section of the race accounts for this relatively high aerobic contribution, and explains the importance of having a high endurance capacity.
V0 2max has long been considered an objective measure of endurance
the rower has to be able to sustain the majority of the race at the highest possible work intensity without an excessive amount of lactate accumulating in the blood, which could lead to fatigue. Since there is a relatively small amount of research in rowing concerning measurements of blood lactate concentration, the general literature on lactate in other sports will be consulted first.
2.3 Blood Lactate Concentration
2,3.1 Background
Changes in blood lactate concentration with exercise were observed as early as 1905 by Douglas and Haldane. Later in 1930 Owles expanded on earlier research, stating that exercise was able to continue for long periods of time without undue fatigue, but only up to a ‘critical level* of intensity, beyond which blood lactate increased significantly and performance deteriorated. This critical level was found to vary according to the exercise mode, the individual and with changes in training, but was not found to be directly related to an oxygen debt. It was not until the 1960s that this critical level became associated with and labelled the “anaerobic threshold" (Wasserman and Mcllroy, 1964), and defined as
“The level of work or oxygen consumption just below that at which metabolic acidosis and the associated changes in gaseous exchange occur.”
Wasserman et al. 1973.
The anaerobic threshold (AT) was found to coincide with changes in blood lactate concentration and could be used to estimate the onset of anaerobic metabolism, which was related to a deterioration in endurance performance. This concept has since been the target of much controversy and debate. The main concerns have been over the methods of interpretation and detection (Brooks, 1985), mechanisms of its occurrence (Walsh and Banister, 1988) and acceptable nomenclature (Davis, 1985).
2.3.2 "AT" definitions and methodology
The change in blood lactate concentration was initially determined by examining changes in gaseous exchange variables, since these were thought to occur at approximately the same time. An increase in ventilatory equivalent (VE/VO2) for
method of detennining the observed increase in blood lactate concentration (Caiozzo et al., 1982; Davis et al., 1976; Powers et al., 1983; Wasserman et al., 1973). Other ventilatory parameters have similarly been used, including non-linear increases in minute ventilation (Davis et al., 1976), respiratory exchange ratio (Wasserman et al., 1973), and excretion of carbon dioxide (Beaver et al., 1986; Langill and Rhodes, 1992). The term "ventilatory threshold" (VT) has been used to describe these methods. However, the ventilatory threshold often occurs before the point associated with an increase in lactate concentration (Neaiy et al., 1985; Yeh et al., 1983), with differences also resulting from training (Gaesser and Poole, 1986). It has therefore been suggested that changes in ventilatory variables and blood lactate concentration are due to different underlying mechanisms and are indicative of different phenomena (Farrell and Ivy, 1987; Lout and Rhodes, 1993; Walsh and Banister, 1988; Weltman, 1989). They are now usually viewed separately when determining exercise intensities or endurance capacity. The term anaerobic threshold should, therefore, no longer be used to refer to both changes in blood lactate concentration and ventilatory variables, since these do not occur simultaneously.
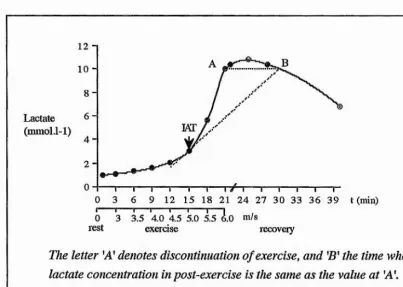
Mainly for ease of identification, the work intensity at a fixed lactate concentration of 4 mmol F i is taken as the upper limit beyond which an abrupt increase in lactate occurs (Heck et al., 1985; Kindermann et al., 1979; Mader et al., 1976). The onset of blood lactate accumulation or OBLA (Sjodin and Jacobs, 1981) is also determined by a fixed blood lactate concentration of 4 mmol I L However, not all subjects reach a lactate concentration steady state at 4 mmol FI Stegmann et al. (1981) introduced the term the individual anaerobic threshold (IAT), since they found that individuals differed in their lactate response to exercise. The lAT is determined from changes in blood lactate both during and after an incremental exercise test (Figure 2.1), and represents the maximal workload where production and elimination of lactate are in equilibrium. Work intensities above the lAT would therefore lead to progressively increasing lactate values.
Figure 2.1 Method of detecting the I AT from lactate kinetics during and after incremental graded exercise on a treadmill, adapted from Coen et al. (1991).
12 I 10
-8
-6 -Lactate
(mmol.1-1)
4
-0 3 6 9 12 15 18 21 24 27 3-0 33 36 39 t
I 1--- 1---1---1--- 1---1---1
0 3 3.5 4.0 4.5 5.0 5.5 6.0 m/s
rest exerase recovery
The letter 'A' denotes discontinuation of exercise, and ’B’ the time when lactate concentration in post-exercise is the same as the value at A \ The arrow points to the exercise intensity equivalent to the lAT,
2.3.3 Blood lactate concentration and endurance performance
Whichever method used and whatever the cause of the increase in lactate and the fatigue with which it is associated, the measurement of blood lactate concentration has been found to give a more valid assessment of endurance performance than V02max. Farrell et al. (1979), for instance, found that a running velocity corresponding to OPLA correlated more highly (r^0.91) with running performance than did V02max (rs:0.83). Running performance was determined from times achieved in road races at distances between 3.2 km and 42.2 km. Sjodin and Jacobs (1981) reported that OBLA correlated to the performance of 18 male runners competing in the Stockholm Marathon. The velocity associated with marathon performance was found to be equivalent to 87.2% of the velocity associated with OBLA.
[image:24.620.94.497.105.392.2]"training response" after 14 weeks of endurance training than those who had higher or lower lactate concentrations during training. Keith et al. (1992) measured adaptations of 2 different types of training using the lAT. One group worked at a steady state exercise intensity that was equivalent to the I AT, for a period of 30 minutes up to 4 times per week. The other group exercised for the same amount of time, but did interval work at 30% above and 30% below the I AT. The work intensity and oxygen consumption at the lAT increased significantly and progressively during the 8 weeks of training for both groups. Intermittent and continuous work associated with the lAT were considered equally as beneficial for inducing an aerobic training effect.
Lactate measurements have been reported to be more sensitive to changes in fitness than V0 2max especially among very fit athletes when V0 2max has reached
its limit. Biathletes and Nordic skiers were tested on a treadmill before and after 5 weeks of endurance training (Dunbai% 1991). It was found that V02max stayed the same, in spite of the running speed at a fixed blood lactate concentration of 2.5 mmoM'i increasing significantly from 4.66 m-s’^ to 5.09 m s k Poor correlations have also been observed between V0 2max and endurance performance when
individuals with similar V02max values were compared (McLellan and Cheung, 1992).
V0 2max is reported to be more closely related to central factors such as
stroke volume, while skeletal muscle metabolic factors such as respiratory enzyme activity relate more to submaximum exercise capacity (Weltman, 1989). This may explain why blood lactate measurements give a better indication of endurance performance and adaptation to training, than V02max. Training at the intensity equivalent to an increase in blood lactate concentration induces peripheral changes such as increases in capillary density and in the amount of slow twitch muscle fibre (Tesch et al., 1981). These changes result in the athlete being able to work at a higher intensity of exercise without excessive amounts of lactate accumulating in the blood.
2.4 Blood Lactate Concentration and Rowing
and 5) aimed at developing aerobic conditioning. In the preparation period 54% of training should therefore be at an intensity corresponding to a lactate concentration of less than 2.0 mmol l L Training at level 3 (anaerobic threshold) equivalent to a lactate concentration of 4 mmoM-i is given much less emphasis. However, more recent findings suggest that training at this level can improve rowing performance. Warrington et al. (1992), for instance, tested 14 females from the 1992 British Olympic squad using a step incremental test on the rowing ergometer, and found an increase in power output of 4.71 watts at the 4 mmol 1-1 fixed threshold level following a season of winter training. Vermulst et al. (1991) found that the power output at the 4 mmoM-i level was positively correlated to the volume of training (measured in minutes and kilometres rowed) among elite female rowers. However fixing blood lactate concentrations to produce a specific training effect is not recommended for all athletes as previously mentioned (Stegmann et al., 1981). In work by Stegmann and Kindermann (1982), 9 male and 10 female rowers were required to cycle at an intensity equivalent to the fixed 4 mmoM-^ threshold. Five of the rowers were unable to complete the 50 minute continuous test at this work intensity, stopping after only 14 to 16 minutes. End values of lactate for these 5 subjects were found to be high (mean 9.6±1.2 mmol F i). This method of obtaining a work intensity corresponding to a fixed lactate concentration of 4 mmoM-i is therefore not suitable for all subjects due to a non-steady state lactate concentration.
Illîî
VO
0\ Q O
«j
ill
o . i i fen (S vo o a*
G (/) Q o VO
o
o
Ph
s
00
Os "O
co
00 00
T3
t
1 1
2.5 Laboratory Measurement of Physiological Variables in Rowing
2.5,1 Lactate
In the physiological testing of athletes it is common practice to use capillary blood for the assessment of lactate, rather than taking blood from the antecubital vein of the forearm or by determining muscle lactate through biopsy. Taking a small amount of capillary blood is less invasive and less time consuming, thus making it practical for experiments in the field (Williams et al., 1992). When taking blood while rowing, the sampling site ought not to interfere with the rowing action nor require a discontinuation of incremental and/or steady state exercise, since as Stegmann et al. (1981) state, intenuptions of work may lead to a decrease in the lactate gradient between the blood and muscle, hence distorting the lactate profile. The guidelines presented by the British Association of Sports Sciences (BASS) for testing elite performers (Hale et al., 1988) also recommend a continuous load protocol in the determination of OBLA.
Capillary blood is usually taken from the earlobe (Kinderman et al., 1979; Robergs et al., 1990), or the fingertip (Foxdai et al., 1990; Johnson et al., 1991). Since the upper body is in constant motion whilst rowing, these two sites are inappropriate unless the exercise is stopped. Furthermore, if blood is taken from the fingertip between exercise bouts, the finger may continue to bleed each time the rower exerts pressure on the oar handle. In a racing shell, the rower’s feet are attached to the boat by means of fixed training shoes or straps, so that the body can move backwards and forwards along a slide. This means that the feet are rendered relatively immobile. When rowing on an ergometer, the feet are similarly secured, making it possible and practical for the experimenter to remove repeated blood samples from the tip of the toe without obstructing performance.
involving the legs, the arms and the back. Smith's results, therefore, may have limited application to rowing.
The British Olympic Medical Centre has observed through standardised testing of national rowers, that blood samples taken from the fingertip reveal 'fractionally' higher values of lactate concentration than those taken from the earlobe (Doherty, 1992). Although this data have not been collected in controlled experimental conditions, it suggests that differences may occur depending on the sampling site, El-Sayed et al. (1993) suggest that such differences may affect the delineation of lactate variables, especially where training and performance prediction are concerned. It is therefore essential to establish whether different sites can be used inter-changeably before comparisons are made. This is why the possibility and validity of taking blood from the toe is included as one of the objectives in this study.
The evidence, however, is not conclusive. For 15 trained runners, Weltman et al. (1990) compared a 3 minute incremental continuous running protocol with the 10 minute discontinuous test proposed by Hagberg. For the continuous protocol the initial velocity of the treadmill was 150 m min h Velocity was then increased by 10 m-min-i every 3 minutes. No differences between the 2 protocols were found in the velocity, oxygen consumption and heart rate at the lactate threshold, and at fixed blood lactate concentrations of 2 mmoM-i, 2.5 mmoM-i and 4 mmol Fi. They concluded that a continuous incremental test involving 3 minute stages is reliable and valid for measuring lactate concentrations. Dunbar et al. (1995) examined differences in lactate and heart rate values from 8 county standard middle and long distance runners obtained during a 4 minute incremental running test with no more than 20 seconds allowed for blood collection, and a 6 and an 8 minute discontinuous test. Increments in the discontinuous tests were separated by 10 minute recovery periods. No differences (p>O.OS) were found between mean heart rate and lactate values obtained with each protocol. It was recommended that 6 minute discontinuous running protocols could be used since data obtained would be the same as that obtained from an 8 minute protocol. Furthermore, if time was a constraint, the continuous 4 minute protocol was recommended as an acceptable alternative.
The results of these various studies seem to be conflicting. At one extreme there is the recommendation for a discontinuous 10 minute test, and at the other, a continuous test with 3 minute stages. Both types of test have been reported to produce values of blood lactate that are representative of a steady state concentration, and that can reliably be used to establish the work intensity corresponding to the point where lactate increases exponentially. Discrepancies in the findings may be due to differences in aerobic capacity of the subjects tested, although Foxdai et al., (1994) do not report any differences according to training status in their study. Findings might also be influenced by the exercise mode, as originally suggested in the early work by Owles (1930). Since the evidence is inconclusive and since studies have not involved the rowing ergometer, further investigation is required.
2.5.2 V02max
The BASS Position Statement on the Physiological Assessment of the Elite Competitor (Hale et al., 1988) recommended that a protocol for determining V 0 2max, regardless of exercise mode, should be a continuous test lasting for a total
power output that would elicit 2 mmol l-i of blood lactate. For elite cyclists this roughly corresponds to a starting workload of 200 to 250 watts for men and 150 watts for women, with a 35 watt increment until exhaustion. With the awareness that fixing guidelines becomes increasingly difficult when using a wider variety of exercise modes, BASES (British Association of Sports and Exercise Sciences, formerly BASS) at a recent physiology workshop (MacLaren, 1994) have suggested that the protocol should be adjusted to suit both the athlete and the sport. It seems for instance that 3 minutes for each stage is often too long for the more elite athlete, as the body is able to adapt more quickly especially at lower workloads. MacDougall et al. (1992) recommended that step increments should be small enough to avoid undue increases in lactate and local muscle fatigue, yet the work time long enough and the increment large enough, so that the total time is not prolonged to the point where anxiety, boredom or physical discomfort force cessation in advance of achieving V02max. When exercising on the rowing ergometer, the length of each work stage as well as the amount of watt increment needs further investigation, in order to establish an effective protocol which will ensure that a true V0 2max is
obtaine(h__^e test should also allow for differences in aerobic capacity.
Further to these recommendations, BASS present guidelines for establishing whether the V02max value obtained is valid. These include a plateau in the oxygen uptake/exercise intensity relationship, an end respiratory exchange ratio of more than 1.15, a heart rate maximum of within 10 b-min-i of age-related maximum, and a post-exercise blood lactate concentration of 8 mmoM-^ or more.
A common maximum rowing test used mainly in Germany is the 6 minute "all-out" test. This, along with the 2,500 m test popular in this country are largely used for selection purposes rather than for establishing V02max. However, the 6 minute all-out test has frequently been used to establish maximal variables (Mahler et al., 1984a; Steinacker et al., 1991), although the test does not comply with BASS recommendations. Mean maximum oxygen uptake achieved using an all-out test has been found to be lower than that achieved with a continuous incremental test (Tumilty et al., 1987). It is likely that a higher blood lactate concentration occurs earlier in the test leading to metabolic exhaustion, since there is no gradual increase in work intensity (Steinacker et al., 1984; Urhausen et al., 1987). The test, therefore, demands a high amount of motivation from the athlete and this, rather than physiological variables, may limit performance.
entrainment of breathing, and not as a V Ogmax test per se, Koutedakis et al. (1993) have also used a one minute test protocol. For the warm-up, the work intensity is equivalent to a 500 m split time measured from the electronic performance monitor of the Concept II rowing ergometer of 2:20 minis, and lasts 5 minutes. This starting level is used so that figures can be compared, but does not appear to take sex, age or expected rowing ability into account. After this stage, split times decrease by 5 seconds every minute until 1:50 minis, and then decrease by 2 or 3 seconds down to 1:35 (minis). The subjects continue until they are unable to maintain the required split time, after which a further 30 seconds is given for an all-out sprint. The main purpose of the test seems to be to obtain a peakV02 due to the sprint finish. There are also no validity and reliability data reported for this test.
Other tests reported in the literature use the Gjessing rowing ergometer described in the following section, which although a popular ergometer used for laboratory measurements in the past, does not simulate rowing as effectively as ergometers such as the Concept II, which have been developed more recently. V02max protocols designed for the Gjessing are not easily transferable to the Concept II since they rely on different methods to establish work intensity.
2.5. J The rowing ergometer
The Gjessing rowing ergometer has the disadvantage that it operates on a fixed resistance (Mahler et al., 1987), which means that it requires a considerable amount of effort to move the flywheel at the catch (the start of the stroke, simulating the entry of the blade into the water. Figure 2.2). It is also considered difficult to row at normal race stroke rates for more than a few minutes without detriment to technique (Martindale and Robertson, 1984).
with the Concept II, Hahn et al. (1988) found that more effort was required by the rower to obtain equivalent power outputs on the Gjessing as on the Concept II, energy being lost in the transmission of the system.
The Concept II is not without its faults. There are no means of scientifically calibrating the digital display or electronic performance monitor, since the manufacturer does not provide an explanation of how calculations are achieved (Hahn et al., 1988). Frictional differences may cause variation between machines, which makes them less than satisfactory for laboratory situations that require an exact knowledge of work output (Bassett et al., 1984). More information on measurements of mechanical variables from the Concept II will be given in section 2.7.1.
Ideally, evaluation of physiological characteristics of rowers should be performed on water, but logistical problems such as collecting blood samples and expired air without the rower having to stop, and changes in environmental conditions are difficult to minimise and control. It is also difficult to standardise and measure work intensity. Increases in speed are often met by increases in stroke rate alone rather than by a combination of stroke rate, force and power output. Testing in the boat therefore requires precise methodology, and technically perfect performance from the rower (Steinacker et al., 1991).
If an ergometer can simulate the rowing action sufficiently in terms of biomechanical and physiological variables, it should be considered as a suitable alternative for scientific testing (Martindale and Robertson, 1984). A more detailed examination of the mechanics of rowing and the physiological demands of the stroke will give some insight into the similarity of ergometer rowing and on-water rowing, and how testing on the ergometer can be used as an affective alternative.
2.6 Biomechanical Aspects of Rowing
2,6.1 The rowing technique
00
CM
T 3
00
t£>
o
q d
CM
d
OX)
CO LO CO
.■Su-» 0)
O W
Î
I
without throwing up water. This phase is called the finish. The body then rocks forwards rapidly before the knees are bent, so that momentum of the body swing rather than conscious effort carries the rower in a steady, controlled movement up the slide. During the first part of this recovery phase, the oar is feathered (parallel to the water). As the rower approaches front stops, the hands rise gradually and the blade is squared (perpendicular to the water) in preparation for the catch. The cycle is then repeated.
2.6.2 Components of velocity
Velocity can be defined as the distance the boat covers per unit of time, and can be measured either by determining a point on the boat and measuring its displacement in a forwards direction with the aid of film, or as is more customary, by the time required to complete a fixed distance such as 500 m. It is dependent on four main interrelated factors:
a) the application of force per stroke by the rower b) the stroke length
c) the stroke rate
d) aero- and hydro-dynamic drag
(Martin and Bemfield, 1980; Millward, 1987; Schwanitz, 1991)
To gain velocity therefore, the aim is to generate a large force, over a long distance in as little time as possible (Nolte, 1991), without excessive amounts of drag.
Martin and Bemfield (1980) found minimum velocity of the boat to occur at 27% into the leg drive phase, and maximum velocity at the middle of the recovery (Figure 2.2). The greatest boat acceleration was obtained during the propulsive phase, and the least during recovery. They state that it is important to maintain a constant velocity, by reducing excessive amounts of acceleration and deceleration, as these increase the effects of inertia and drag.
a) Force
it is opposing the direction of boat travel. To prevent exaggerating this negative force, the rower needs to achieve a very rapid entry into the water followed by immediate power generation (Herberger et al., 1990; Sanderson and Martindale,
1986). Furthermore, since maximum velocity occurs during recovery (Figure 2.2), a longer time in this phase is desirable. Although there exists no equation to date, relating boat speed to the movements and forces of the rower, stroke profiles have been computer analysed when rowing on the ergometer (Kinch et al., 1993), and lend support to this idea of using a fast catch and a steady, controlled recovery.
b) Stroke length
Stroke length is dependent on both the rigging and the rower.
i) Rigging
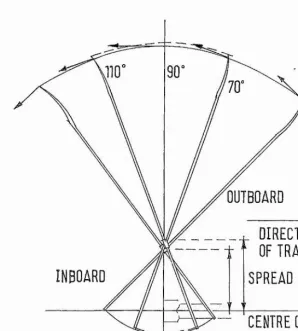
This refers to the adjustment of all moveable parts of the boat and oar. Increasing the outboard (distance from the pin to the end of the blade), or decreasing the spread (distance from the centre of the boat to the pin) will cause an increase in the length of the rowing arc (Figure 2.3). This should increase the velocity of the boat, since the force is applied over a greater percentage of time. However, by so doing, a larger force will be required by the rower on the handle, in order to maintain the same amount of force at the blade. The load will therefore feel greater, which may not be as suitable for smaller, lighter, less fit or less technically proficient rowers. In addition, more force may be applied that is not directly perpendicular to the direction of the boat travel, which may be wasteful. The efficient area of oar swing angle is usually cited as between 70 and 110 degrees (Herberger etal., 1990) as shown in Figure 2.3. The only advantage of going beyond this angle is that the hydrodynamic lift achieved at the most extreme forward position is thought by some to enhance boat progression (Nolte, 1991).
ii) Rower
result of body dimensions or due to differences in technique. These small differences found at the handle are magnified at the blade since stroke length at the blade is approximately 2.5 times that at the handle (Kinch et al., 1993).
Figure 2.3 Effect of adjusting span or outboard on the rowing arc.
OUTBOARD
. DIRECTION
OF TRAVEL
SPREAD
INBOARD
CENTRE DP BOAT
Arrows on end o f blades refer to the direction in which force is applied.
c) Stroke rate
the results by Martindale and Robertson (1984) that a relationship between stroke rate and stroke length does not exist. Force does however appear to be related in some way to the stroke rate since both have been found to increase concurrently (Zatsiorsky and Yakunin, 1991).
If stroke length and the force applied via the oarhandle are kept constant and the effect of drag minimised, the boat speed is solely dependent on the stroke rate. Martin and Bemfield (1980) and Fukunaga et al. (1986) both report a significant relationship (n=0.66) between stroke rate (between a rating of 27 and 41 strokes per minute) and average velocity of a racing shell. This relationship is reported to be linear (di Prampero et al., 1971). It is therefore usually considered advantageous to increase the stroke frequency (di Prampero, 1986; Fukunaga et al., 1986), as long as it is within the limits set by the efficiency of muscular contraction estimated at approximately 40 strokes per minute (Celentano et al., 1974). However Sanderson and Martindale (1986) suggested that high strokes rates may reduce speed efficiency, since a large proportion of the stroke period will be spent decelerating the boat at the catch.
In the protocols that have been used to examine physiological variables on the rowing ergometer, stroke rates have been extremely varied and in many studies are not specified (Chénier and Léger, 1991; Jackson and Secher, 1976; Klusiewisz etal., 1992; Str0mme, et al., 1977; McKenzie and Rhodes, 1982) presumably because stroke rate has been difficult to measure or because the measurement is not a relevant part of the study. As stroke rate seems to play an important part in boat progression, it is essential that this variable is taken into account.
d) Drag
2.7 Laboratory Measurement of Mechanical Variables in Rowing
2,7,1 Ergometer measurements
2.8 The Effect of Mechanical Changes on Physiological Variables
Changes in force, stroke length and stroke rate may have an influence on physiological variables, such as oxygen consumption and lactate concentration. If V0 2max and lactate measurements are used to assess rowing performance,
consideration needs to be given to how these mechanical variables can be measured and controlled. Investigators usually examine rowing economy based on the relationship between oxygen uptake and rowing velocity. This relationship was found by Jackson and Secher (1976) to be linear when testing 2 rowers on water, becoming curvilinear above velocities of 160 m min k A similar relationship has been found on the ergometer (Bassett et al., 1984). Hence a value for 500 m split time on the ergometer or velocity on the water are most commonly used to measure work intensity. However, the specific components of velocity, which include force, stroke length and stroke rate have not been individually examined for their influence on oxygen consumption. It is assumed that since force, stroke rate and stroke length all affect velocity, similar linear increases in oxygen consumption are expected when each component is independently increased.
2.9 The Effect of Stroke Rate on Oxygen Consumption and Lactate
The guidelines set by FISA specify stroke rates for improving aerobic capacity (Table 2.1). However, these suggestions appear largely to be based on empirical evidence. At the time of publication it was not known for certain how changes in sti oke rate per se affected oxygen uptake or lactate concentration.
according to the FISA recommendations, even though there appears to be a lack of scientific information to support them. Furthermore, the study by Droghetti et al. (1991) also found that there was a large inter-individual variation in oxygen uptake at the different stroke rates. At 28 strokes per minute during no load rowing, oxygen consumption varied for individuals between 1.35 and 2,40 hmin-i, a 77% difference in movement economy. This suggests that there may be an optimal stroke rate for each individual.
Stroke rate may also have an effect on pulmonary function. At high workloads, increases in pulmonary ventilation are generally met by increases in breathing rate rather than by tidal volume (Szal and Schoene, 1989). However, breathing rate and stroke rate have been found to increase in concert, since rowers entrain or co-ordinate their breathing with the stroke (Mahler et al., 1991a; Steinacker et al., 1993). The suggestion therefore is that stroke rate could be altered to optimise pulmonary parameters (Rosiello et al., 1987; Steinacker et al., 1993). It has also been argued that the action of the stroke may impede pulmonary ventilation and venous return (Andrea et al., 1986; Cunningham et al., 1975; Jensen and Katch, 1991; Rosiello et al., 1987) due to the combined effect of expiration and compression of the chest and abdominal muscles, necessary to obtain maximum stroke length. Such changes brought about by the mechanical action of the stroke may influence oxygen consumption and the assessment of the ventilatory threshold (Carey et al., 1974).
2.10 Summary and Research Implications
3.1 Introduction
The fingertip and the earlobe are the conventional locations for capillary blood sampling while subjects are exercising. In rowing these two sites are inappropriate since the rower has to stop for the sampling to take place. An interruption in steady state or incremental work can affect results when obtaining a work intensity equivalent to the point where lactate concentration increases abruptly or exponentially (El-Sayed et al., 1993; Stegmann et al., 1981). Since the feet are fixed into the boat or ergometer by shoes or straps, it is possible for the experimenter to remove repeated blood samples from the tip of the toe without affecting performance. Smith et al. (1991) found that lactate concentration in blood sampled from the toe was significantly lower than that taken from the earlobe following arm only exercise, and concluded that the lack of involvement of the lower body resulted in less lactate being produced in this region. Apart from this study, little work has been done on analysing differences in lactate concentration that might occur as a result of different sampling sites. Through standardised testing of rowers on the Concept II rowing ergometer, the British Olympic Medical Centre have observed differences between blood taken at the earlobe and fingertip, but have not used or analysed blood from the toe.
The purpose of this study is to compare plasma lactate concentration taken from the toe with that from the earlobe and fingertip following steady state rowing exercise equivalent to 60% and 90% of the individual's estimated heart rate maximum. These two percentages are chosen since it is assumed they represent the range of expected values that rowers are able to sustain for prolonged periods without excessive amounts of lactate accumulating in the blood (Koutedakis and Sharp, 1985; Zhou, 1990). From the results of this study it should be possible to establish whether the toe can be used as a valid sampling site for the estimation of plasma lactate concentration. It is hypothesised that values of lactate will not differ significantly between sites.
3.2 Methodology
3.2.1 Subjects
Table 3.1 Physical characteristics of subjects.
Figures given are mean, standard deviation and range.
FEMALES
(n=5) MALES(n=4)
Age (years) 28.0±9.2 23.3±3.8
(20-38) (19-28)
Height (m) 1.64fc0.05 1.83±0.05
(1.61-1.71) (1.77-1.87)
Weight (kg) 69.4dtl0.6 81.9±6.5
(56.7-81.0) (72.6-87.7)
3.2.2 Equipment
Exercise was performed on the Concept II rowing ergometer (Model B). The electronic performance monitor was used to obtain information about the stroke rate (str-min'i), boat speed, expressed as the time taken to cover 500 m (min, s), and elapsed time (min, s). Although there is some dispute as to the accuracy of the displayed 500 m split time (Lakomy, 1993), figures are reported by the manufacturers to be reproducible. Since subjects were expected to differ in their lactate response to exercise (Stegmann et ah, 1981), it was not intended to use individual values for direct comparison. The 500 m split time was therefore used merely as a guideline to elicit a certain heart rate response, rather than an accurate measurement of work intensity. All subjects were familiar with the Concept II having used this type of simulator extensively in training. Heart rate was measured by short-range telemetry (PE3000 Sport Tester).
3.2.3 Procedures
rowers (Steinacker, 1993). The speed (500 m split time) and heart rate were recorded during the final minute of exercise. This information can be used to predict exercise intensities that elicit heart rates above 50% of the individual’s estimated maximum heart rate (Table A 1.1). After a short break subjects completed two separate 4 minute workloads, one at 60% of their estimated heart rate maximum, and the other at 90%, the order being randomly assigned. Adequate rest (denoted by heart rate recovery to within 10% of their original pre-exercise heart rate) was given between work bouts. During the final minute, heart rate, 500 m split time and mean stroke rate were recorded.
3.2 A Blood sampling
Prior to the warm-up, an embrocation cream was applied to the earlobe, fingertip and toe to encourage superficial blood flow. The area of sampling was then prepared using non-alcoholic mediwipes, in accordance with BASS standards (Hale et al., 1988). Blood was taken simultaneously at each site by 3 experimenters immediately following the cessation of exercise, and the time taken to complete each sample was recorded. Capillary blood was collected using a heparinised capillary tube marked at 50 p\, and immediately placed into a standardised 4 p\ preservative (fluoride/EDTA reagent) to prevent coagulation. The samples were centrifuged for 5 minutes and 20 p\ of supernatant plasma was frozen for subsequent analysis. For the assay, a 10 /<1 sample of the plasma was diluted with a reagent solution containing sodium carbonate, NAD and L-glutamate. This was measured using a spectrophotometer at 340 nm zeroed against air. A standard enzyme mix containing LDH and OPT was then added and the change as a result of the reaction noted. This enzymatic method uses LDH as a catalyst for the production of pyruvate and NADH from lactate and NAD+. The amount of NADH formed in the reaction has been found to be proportional to the concentration of lactate (Noll, 1974). Further information is given in Appendix 8.
differences. If the same assay technique is used for repeat assessments, the difference should not be important, as long as values are not compared to other studies or extrapolated to field situations in order to set training intensities (Williams etal., 1992).
3,2.5 Statistical Analysis
A 3-way ANOVA was used to determine differences and to look at interaction effects between sampling sites, subjects and workloads. The level of significance was set at /?<0.05. A Pearson product moment correlation coefficient (r) was used to look at the relationship between lactate values at different sites, and a normal scores plot was used to check the distribution of values.
3.3 Results
Performance data and plasma lactate values found at the three sites are given in Tables 3.2 and 3.3.
Table 3.2 Summary of performance data at the two estimated work intensities. Figures given are mean and standard deviation.
FEMALES (n=5)
MALES (n=4)
ALL SUBJECTS
(n=9) WORK INTENSITY 1
500 m Split Time (minis) 2i48±0il0 2i08±0i05 N/A
Heart Rate (b-min"i) 164.6±8.7 154.4±3.6 160.1±8.5
Percentage of Estimated
HR Max (%) 79.7±6.3 72.3±2.6 76.4±6.1
WORK INTENSITY 2
500 m Split Time (minis) 2i26±0il4 l:48±0i05 N/A
Heart Rate (b-min"i) 178.7±3.3 181.5±8.1 180.1±5.7
Percentage of Estimated
It was intended that the first load should represent 60% of the individual’s maximum heart rate. The methods outlined by Lakomy and Lakomy were designed to estimate a work intensity that would elicit a heart rate response equivalent to this 60% of heart rate maximum. Although these methods were adhered to, the actual heart rate response was higher than the estimated heart rate for all subjects. It is likely that the arousal level of the subjects was high, since they were apprehensive about the testing procedures and blood sampling, and wanted to perform well on the tests. The heart rate would therefore be slightly elevated. The test by Lakomy and Lakomy may not take the psychological state of the subject into account, since it is only designed for self-evaluation. Unlike the lower workload, the physiological demand of the higher workload seemed to out-weigh the psychological stimulation effect on the heait, and produced values that were closer to the estimated 90% of maximum heart rate.
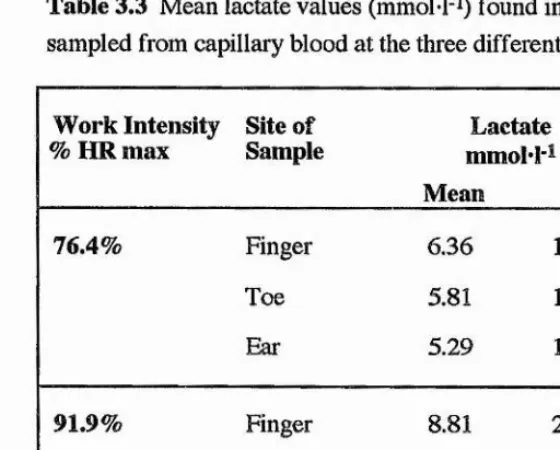
The lactate response data for all subjects were pooled (Table 3.3), since no significant differences occurred when the lactate data were analysed separately for each sex.
Table 3.3 Mean lactate values (mmoM'i) found in plasma sampled from capillary blood at the three different sites.
Work Intensity
% HR max Site of Sample mmoM'iLactate
Mean SD
76.4% Finger 6.36 1.58
Toe 5.81 1.11
Ear 5.29 1.24
91.9% Finger 8.81 2.30
Toe 8.53 1.37
8.41 2.35
[image:48.619.157.437.426.651.2]As can be seen in Table A5.1.1 (Appendix 5.1), no significant differences were found in the amount of lactate at the three different sampling sites at either work intensity, since the value for p was 0.085. Interaction analysis suggested that any small variations in lactate that were found at the different sites could be accounted for by differences between subjects rather than between sites.
The normal scores plot revealed a correlation of 0.98, greater than 0.96 for normality (Appendix 5.1, Figure A5.1.1). The Pearson product moment coefficient revealed significant correlations of lactate values between all sites, except for those between the ear and fingertip (r=0.64) at the first workload and between the toe and fingertip (r=0.46) at the second load. The highest correlation occurred between the toe and finger (r=0.79) at the lower workload. When comparing the values achieved at the same site but at different work intensities, all relationships were significantly different, and correlations were low.
The mean time taken (min.s) to collect 50 }A of blood from the fingertip, the toe and the earlobe was 2.25±1.15, 1.12±0.35, and 2.44±0.50 respectively. This gave a total mean time for all samples of 2.07±1.28 (mins.s). A 3-way analysis was also used on these values and showed significant differences between the times when comparing the three sites and the two work intensities (Appendix 5.1, Table A5.1.2).
3.4 Discussion
At both work intensities the mean amount of plasma lactate found at the toe, fingertip and earlobe were not significantly different. Although only 9 subjects were involved in the study, the normal scores plot indicates an even distribution of lactate responses, suggesting that the findings would be the same if larger numbers were tested. These results contradict the observations made at the British Olympic Medical Centre (Doherty, 1992) following rowing exercise, and of Smith et al.’s findings (1991) following arm cranking. Since the legs were inactive in Smith et al.’s study, it was proposed that less lactate was produced and more metabolised within this region, resulting in lower net amounts of blood lactate at the toe. Similar conclusions concerning lactate uptake by non-exercising muscle have been made by other researchers (Bassett et al., 1984; Davis et al., 1976; Karlsson and Jacobs, 1982; Rasmussen et al., 1991; Secher et al., 1977). In rowing, the muscles of the legs, back and arms are highly active (Mazzone, 1988), suggesting a more even distribution (from both production and utilisation) of plasma lactate concentration.
intensity approximating the third and fourth minute of a six minute all out test, and found no significant differences (p>0.05) in plasma lactate sampled immediately following exercise and up to 5 minutes post-exercise. For this study, 5 minutes was therefore used as a maximum time limit for blood collection, the mean time (min.s) of collection for all samples being 2.07±1.28. At both work intensities, the time taken to complete the sample was lowest at the toe (a mean value of 1.12±0.35 min.s), and highest at the earlobe (a mean time of 2.44±1.50 min.s). These times may seem unusually long in comparison to other studies (Foxdai et al., 1991; Smith et al., 1991), but included the time taken for the subject to replace the oar handle, and for the investigator to prepare the subject and the site for sampling. A 50 pi sample was required for analysis rather than the normal 3 to 7 /d when using an automated analyser. Poor blood flow, especially at the earlobe in spite of this site being pre-warmed, and rapid blood clotting added to the delay in collecting the sample in some of the subjects. In both the toe and fingertip, blood flow improved after 30 seconds into the collection, as subjects relaxed.
Subjects were asked where most discomfort was felt. In all cases, the finger was the most sensitive, and the earlobe the least, independent of whoever was taking the sample.
4.1 Introduction
In rowing there has been increased interest in using measurements of blood lactate concentration to assess endurance performance and to set training and competition exercise intensities (Doherty, 1992; Hagerman and Hagerman, 1990; Hartmann et al., 1990; Womack et al., 1989). Consequently most of the tests used on rowers in this country are designed for measuring lactate such as the discontinuous incremental test used at the British Olympic Medical Centre (BOMC) for testing squad rowers and the V02max/lactate profile protocol used at the National Sports Medicine Institute (Appendix 2). These tests are discontinuous to allow for blood sampling and do not need to continue to exhaustion, since the lactate threshold determined by a curvilinear rise in the power/blood lactate relationship can be identified prior to this. The lactate threshold is also expressed as a work intensity or heart rate rather than a percentage of maximum. For these reasons, the protocols, if used to obtain a V02max value, do not comply with the guidelines of the BASS Position Statement on the Physiological Assessment of the Elite Competitor (Hale etal., 1988).
In the literature V0 2max tests that are incremental and continuous are
designed for the Gjessing rowing ergometer (Brien and McKenzie, 1989; McKenzie and Rhodes, 1982; Steinacker et al., 1986). The Concept II rowing ergometer is, however, preferable since it provides a better simulation of actual rowing than the Gjessing (Hahn et al., 1988; Lakomy, 1985; Steinacker et al., 1991) and has been shown to relate well to performance on water (Chénier and Léger, 1991).
Figure 4.1 Criteria taken from the BASS Position Statement on the Physiological Assessment of the Elite Competitor (Hale et al., 1988).
Section 4,1.1 The following criteria should be considered in establishing maximum oxygen uptake in adults.
1. A plateau in the oxygen uptake/exercise intensity relationship. This has been defined as an increase in oxygen uptake of less that 2 ml kg i min-i or 5% with an increase in exercise intensity.
2. A final respiratory exchange value of 1.15 or above.