Variability of human behaviour in outdoor public spaces, associated with the
thermal environment
Julie A. Waldron1, Dr. Glyn Lawson1, Prof. Darren Robinson2 and Dr. Sue Cobb1
1 Human Factors Research Group, the University of Nottingham; 2 School of Architecture, the University of Sheffield;
Abstract: This paper presents part of the outcomes of a programme of research into the influence of the thermal environment on human behaviour in an outdoor public seating area. The research was conducted during one month in summer, autumn and winter of 2015 and 2016. The data gathered consists in the conduct of people using a public square in Nottingham city centre, and measurements of the environmental conditions taken at that place. The data of Number of People and the Size of Groups of people, were analysed according with the thermal environment of the place. The results showed a strong significant correlation between Number of People and Globe Temperature_sun [r = .66, p < .001]. A multiple regression analysis found that the Number of People per minute in a public space can be predicted using the Globe Temperature_sun and the Wind Speed data of that place [R-square of .39, p < 0.001]. These prediction models can be used to forecast the occupancy of the place and the grouping of users under different environmental conditions. The results can assist the design of urban spaces by allowing testing their future use with predicted data of human behaviour. In addition, the data obtained will serve as a foundation for further research about the human behaviour in public spaces.
Keywords: Human Behaviour, Outdoors, Number of People, Thermal Environment Introduction
The study of human behaviour in outdoor urban spaces has become a field of interest, due to the need to guarantee the wellbeing, leisure, socialisation, and general outdoor activities for
“…3.5 billion people that live in cities” (Carmona, 2014, p.5). In the case of countries with
seasons, the complexity of urban design is even greater due to the constantly changing environmental conditions which constitute additional variables to be taken into account.
Calculation of Areas of Permanence in Public Spaces, According to Solar Radiation Simulated Conditions (Waldron & Salazar, 2013), the simulated environmental data was used to predict
behaviour, but without validated data.
These social and empirical studies conducted over the last decades have addressed the impact of the thermal environment over the behaviour of the user. However, synchronising human and environmental data remains as one of the challenges in this field.
Majority studies exploring human behaviour and environmental factors had focus in comfort of users (Nikolopoulou, M. & Lykoudis, S., 2006, Stathopoulos et al., 2004, Soligo et
al., 1998, Bröde et al., 2012, Nikolopoulou, 2004). It is known that people are in constant
interaction with the environment by adapting themselves or modifying the space around them to achieve their desired condition, “If a change occurs such as to produce discomfort,
people react in ways which tend to restore their comfort” (Nicol et al., 2012). For instance,
adding or removing clothes to gain or lose temperature is known as an adaptive behaviour in indoors and outdoors.
The studies of comfort in outdoors have addressed the thermal perception of users, but
“A truly holistic basis of assessing pedestrian’s satisfaction would, however, also consider sociological factors” (Robinson, 2012). Since integrating the social variables to predict
behaviours, or, studying the physiological human response to environmental conditions, by itself is insufficient. We need to look at the influence of social factors, as well as, their influence on the behaviour. Therefore, this research is focused on finding the relationship between different environmental conditions and human behaviour, and determining whether it is possible to predict the behaviour associated with certain thermal conditions.
This research will contribute to understand the human behaviour, its variability and relationship to the thermal environment. The collected data evaluated Number of People, Group Size, Time of Permanence, Body Postures, Activities and Adaptive Actions. However, this paper will present some of the main findings in the analysis of Number of People and
Groups’ Size.
Method
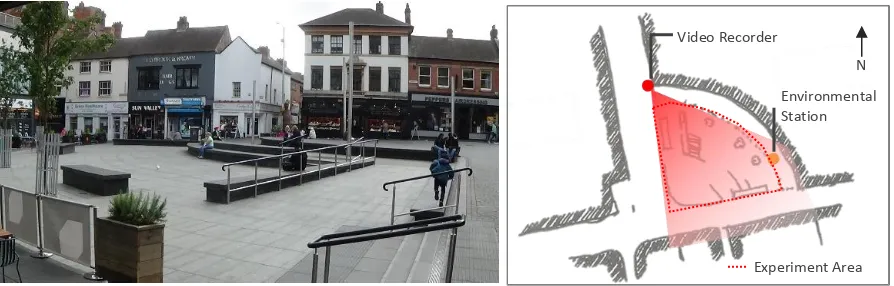
The place selected to conduct the experiment was Trinity Square in Nottingham city centre. This public square was selected because it is typically occupied by different type of users (in terms of age, gender, occupations, activities, among others), it possess a constant pedestrian flow, it is a medium size square (suitable for camera capture) and it encourages people to use various types of public furniture, which allows different postures, from leaning to laying down.
The data was gathered during summer and autumn 2015 and winter 2016, in order to register the broadest range of environmental conditions of Nottingham. The study was conducted for four weeks in each season, recording three hours every day, which were randomly selected between 10:00am and 6:00pm.
A video camera was placed in a discrete position in order to avoid disturbing the normal use of the square. The environmental station was also placed in a discrete position, but located to ensure that the sensors were measuring the same environmental conditions as perceived by the users. The environmental station was therefore adjusted to head height of a person sitting.
presented exclusion, the next day was selected. The exclusion criteria were established to limit the sample to ordinary conducts of human behaviour in public spaces.
This experiment was approved by the Ethics Committee from the Faculty of Engineering from The University of Nottingham. In compliance with the ethical considerations of the study, a poster was placed beside the camera explaining the purpose of the experiment and providing contact details of the author. The poster explicitly stated: “Upon your request, we
will not analyse any data related to your presence in the square. For this, or if you have any other questions about the study, please contact…”
While studying natural environments, conditions may occur which cause changes in the behaviour, which are not solely explained by the influence of the thermal environment. These kinds of conditions have been excluded and therefore, the following events were excluded from the sample: rainy days, days with wet surfaces or extraordinary urban activities such as fairs.
The video data collected was coded to identify and classify the behaviours. The video analysis was divided to code two different kinds of behaviours:
The Social Behaviour consisted in observing the occupancy of the square and the type of group sizes. The sample size was 3779 minutes, corresponding to 21 hours per week, each season. The analysis of this data was done using a matrix in Excel, registering the Number of
People per minute in the square and the number of Groups of 1 person, number of Groups of 2 people, number of Groups of 3 people and number of Groups of 4 or more people, per
minute in the square.
The Individual Behaviour analysis consisted in registering the behaviour per person. The sample size is 3957 users observed remaining during the recorded period. This information was analysed with Observer XT, using a coding scheme previously designed and validated. At the end, the behavioural data was compared with the environmental data doing correlations, multiple regression and survival analysis.
For the purposes of this paper, it will only be discussed some of the results of the Social
Behaviour analysis.
N
Environmental Station Video Recorder
[image:3.595.73.520.134.277.2]Experiment Area
Results and Discussion
Table 1 presents the summary of environmental conditions registered per minute over the
three seasons. The ranges of Air Temperature varied between 5.1 and 27.1ºC; the Relative
Humidity registered varied between 37% and 91%; the Wind Speed varied between 0 and 4.9
m/s and the Light levels oscillated between 12 to 27313 lx.
Table 1 – Environmental Data. N = 3779 minutes. Statistics ( N = 3779)
Ta (ºC) rH (%) Tg_sun (ºC) Tg_shad (ºC) Tr_sun1 (ºC) Tr_shad (ºC) Va (m/s) Light (lx)
Mean 14.4 63 17.1 15.4 23.8 17.8 1.028 4306
Median 14.9 63 16.8 15.3 20.3 16.3 .893 2893
Std. Dev. 5.0 13 6.4 5.5 14.1 8.0 .858 4653
Minimum 5.1 37 6.1 5.9 2.6 6.0 0.000 12
Maximum 27.1 91 34.9 29.5 83.6 55.5 4.959 27313
Table 2 presents the correlations between the environmental variables and the
[image:4.595.76.523.375.687.2]Number of People, Groups of 1, Groups of 2, Groups of 3 and Groups of 4 or more.
Table 2 - Correlation between Environmental Factors and Behaviour: Number of People and Group Size. Spearman's rho Correlations
NP G1 G2 G3 G4+ Ta rH
Tg sun Tg shad Tr sun Tr
shad Va Light
NP Correl 1.00 .71** .83** .61** .56** .61** -.13** .66** .63** .57** .62** -.34** .55**
Sig. 0.00 0.00 0.00 0.00 0.00 .00 0.00 0.00 0.00 0.00 .00 .00
G1 Correl .71** 1.00 .48** .32** .20** .49** -.06** .48** .47** .43** .46** -.21** .34**
Sig. 0.00 .00 .00 .00 .00 .00 .00 .00 .00 .00 .00 .00
G2 Correl .83** .48** 1.00 .38** .28** .50** -.14** .56** .53** .48** .52** -.29** .45**
Sig. 0.00 .00 .00 .00 .00 .00 .00 .00 .00 .00 .00 .00
G3 Correl .61** .32** .38** 1.00 .20** .36** -.03* .38** .38** .33** .37** -.21** .35**
Sig. 0.00 .00 .00 .00 .00 .03 .00 .00 .00 .00 .00 .00
G4 +
Correl .56** .20** .28** .20** 1.00 .30** -.09** .33** .32** .29** .32** -.17** .34**
Sig. 0.00 .00 .00 .00 .00 .00 .00 .00 .00 .00 .00 .00
Ta Correl .61** .49** .50** .36** .30** 1.00 -.23** .88** .97** .71** .89** -.05** .52**
Sig. 0.00 .00 .00 .00 .00 .00 0.00 0.00 0.00 0.00 .00 .00
rH Correl -.13** -.06** -.14** -.03* -.09** -.23** 1.00 -.29** -.22** -.37** -.29** -.19** -.37**
Sig. .00 .00 .00 .03 .00 .00 .00 .00 .00 .00 .00 .00
Tg su
Correl .66** .48** .56** .38** .33** .88** -.29** 1.00 .95** .88** .94** -.24** .75**
Sig. 0.00 .00 .00 .00 .00 0.00 .00 0.00 0.00 0.00 .00 0.00
Tg sh
Correl .63** .47** .53** .38** .32** .97** -.22** .95** 1.00 .78** .93** -.15** .62**
Sig. 0.00 .00 .00 .00 .00 0.00 .00 0.00 0.00 0.00 .00 0.00
Tr su
Correl .57** .43** .48** .33** .29** .71** -.37** .88** .78** 1.00 .93** -.06** .81**
Sig. 0.00 .00 .00 .00 .00 0.00 .00 0.00 0.00 0.00 .00 0.00
Tr sh
Correl .62** .46** .52** .37** .32** .89** -.29** .94** .93** .93** 1.00 -.08** .73**
Sig. 0.00 .00 .00 .00 .00 0.00 .00 0.00 0.00 0.00 .00 0.00
Va Correl -.34** -.21** -.29** -.21** -.17** -.05** -.19** -.24** -.15** -.06** -.08** 1.00 -.29**
1 The Mean Radiant Temperature (Tr_sun and Tr_shadow) was calculated in accordance to BS EN ISO 7726:2001
by using the equation: Tr = [(Tg + 273)4 + ((1.1 * 108 * Va0.6)/(ɛg * D0.4))(Tg – Ta)]1/4 – 273, where ɛg is the
Sig. .00 .00 .00 .00 .00 .00 .00 .00 .00 .00 .00 .00
Lx Correl .55** .34** .45** .35** .34** .52** -.37** .75** .62** .81** .73** -.29** 1.00
Sig. .00 .00 .00 .00 .00 .00 .00 0.00 0.00 0.00 0.00 .00 **. Correlation is significant at the 0.01 level (2-tailed).
The highest correlations found between the human behaviour and all of the environmental conditions measured, were: Number of People and Globe Temperature_sun [r = .66, p < .001]; Groups of 1 and Air Temperature [r = .49, p < .001]; Groups of 2 and Globe
Temperature_sun [r = .56, p < .001]; Groups of 3 and Globe Temperature_sun [r = .38, p < .001]; Groups of 3 and Globe Temperature_shadow [r = .38, p < .001] and Groups of 4+ and Light [r
= .34, p < .001).
As can be observed, Globe Temperature had a strong influence over Number of People and Groups’ size. As reported by Nikolopoulou et al. (2001): “It is clear that warm conditions
and presence of sunlight are important factors in the use of the space”. Conversely, Relative Humidity had a low or a nonexistent correlation with Number of People, and, and Groups’
sizes. According to Nikolopoulou and Lykoudis (2006), the Relative Humidity is a parameter that has a relationship with comfort, but “… people are not very good at judging changes in
humidity levels, unless relative humidity is very high or very low”. Therefore, since Relative Humidity is not a parameter that can be accurately perceived by people, its influence over the Number of People or Groups’ size is low.
The highest correlation between human behaviour and the environmental conditions measured was Globe Temperature_sun and Number of People [r = .66, p < .001]. Figure 2 presents the scatter plot of this relationship. This table shows that during winter, the Number
of People (blue dots in the scatter plot of Figure 2) started to increase dramatically when the
temperature reached at least 13 ºC, and continued increasing as the temperature became warmer. It must be however noted, that most of the data collected of Number of People in winter, corresponds to around 13 people or less at a time. During autumn and summer the occupancy tend to increase.
[image:5.595.190.407.495.734.2]Interestingly, despite registering some of the same ranges of temperature in various seasons, the influence of the Globe Temperature over Number of People varied depending on each season. Whereas the range of 13-15ºC was measured in winter and autumn, the Number
of People in autumn was clearly higher at this temperature, than in winter.
The same phenomenon was observed in summer and autumn. Whilst both seasons had temperatures within the range of 18-19ºC, the number of people at this temperatures was clearly higher in summer. This behaviour may be explained by the thermal history of people since the environmental conditions in indoors can influence the behaviour in outdoors.
The disparity observed between seasons may be also explained by the fact that we were only considering the highest correlation, but the body reacts to multiple stimuli simultaneously. Therefore, a multiple regression model including Globe Temperature_sun,
Wind Speed and Light was built to predict Number of People.
The regression analysis was conducted splitting the sample in two: 60% (N = 2064) of the data was used to do the multiple regression analysis and 40% (N = 1715) was retained for validation of the equations (Stevens, 2009). For the regression model, a Forward method was used. This method takes the highest simple correlation as the first predictor and then the highest semi-partial correlations to see the contribution of each variable inserted to the model. In the analysis, it was found that the Light didn’t contribute to the model; therefore, it was discarded. Table 3 contains the results of the model to predict Number of People based on the Globe Temperature_sun and Wind Speed.
Table 3 - Multiple Regression Model to predict Number of People
Coefficients
Model
Unstandard. Coefficients Standard. Coeff.
t Sig.
B Std. Error Beta
(Constant) 2.742 .703 3.897 .000
Tg_sun 1.027 .032 .563 31.827 .000
Va -2.404 .255 -.167 -9.414 .000
a. Dependent Variable: Number of People
The b-values (B in Table 3) correspond to the individual contribution of each predictor to the model [p < .001]. Therefore, they were used for the regression equation:
Number of People = b0 + b1Globe Temperature_Sun + b2Va
Number of People = 2.74 + (1.03Globe Temperature_Sun) + (-2.40Va)
The Globe Temperature_sun and Wind Speed account for the 39% of the Number of
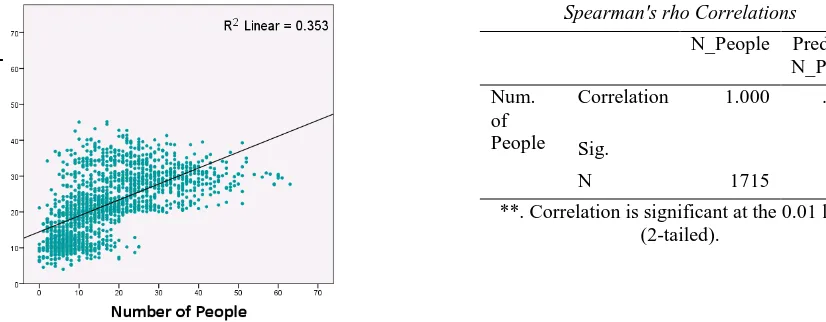
People [r2 = .39, p < .001]. This means that the 39% of the Number of People is explained by the influence of these two variables acting simultaneously. The equation was tested with the 40% of data remaining and the results obtained are significant [r = .66, p < .001] (Figure 3).
Figure 3 shows the scatter plot of the number of people and the predicted number of people of the 40% of the date. It is observed that the model predicts up to 35% of Number of
This method of analysis has been applied to Group Size, obtaining also significant results.
Conclusions
The human behaviour is influenced by multiple environmental factors, acting simultaneously, because the body is a multi-sensory organism which adapts to the environment.
Number of People is influenced by Globe Tempereature_sun and Wind Speed. This was previously reported by other authors. Conversely, Relative Humidity does not influence the Number of People or Group Size.
Number of People and Group Size presented several correlations with various environmental factors, which could serve for further analysis. In this study, only the highest correlations were considered.
Globe Temperature_sun and Wind Speed accounts for 35% of Number of People. The remaining percentage corresponds to other variable not included in this research, such as individual characteristics of the subjects.
Specific behaviours are influenced by different environmental factors. Globe Temperature affects Number of People, but the Air Temperature affects Groups of 1. This means that different statistic models are needed to predict different behaviours.
The validation of the model helps for its generalisability to be applied in different locations with similar conditions.
Further studies could be undertaken to assess the several possibilities of the data collected to predict the human behaviour.
References
Bröde, P., Fiala, D., Błażejczyk, K., Holmér, I., Jendritzky, G., Kampmann, B., Tinz, B. & Havenith, G. (2012). Deriving the operational procedure for the Universal Thermal Climate Index (UTCI). International journal of biometeorology, 56, pp. 481-494
BS EN ISO 7726 (2001). Ergonomics of the thermal environment – Instruments for measuring physical quantities. BS: London.
Carmona, M. (2014). Explorations in Urban Design: an urban design research primer. Surrey: Ashgate Publishing, Ltd.
Gehl, J. (2011). Life between buildings: using public space. Washington: Island Press. Gehl, J., and Svarre, B. (2013). How to study public life. Washington: Island Press.
Nicol, F., Humphreys, M. A. & Roaf, S. (2012). Adaptive thermal comfort: principles and practice. Abingdon: Routledge.
Spearman's rho Correlations
N_People Predicted
N_People
Num. of People
Correlation 1.000 .660**
Sig. .000
N 1715 1715
[image:7.595.82.495.72.233.2]**. Correlation is significant at the 0.01 level (2-tailed).
Nikolopoulou, M. (2004). Designing open spaces in the urban environment: a bioclimatic approach, Centre for Renewable Energy Sources, EESD, FP5
Nikolopoulou, M., Baker, N. & Steemers, K. (2001). Thermal comfort in outdoor urban spaces: understanding the human parameter. Solar Energy, 70, pp. 227-235.
Nikolopoulou, M. & Lykoudis, S. (2006). Thermal comfort in outdoor urban spaces: Analysis across different Europen countries. Building and Environment, 41, pp. 1455–1470.
Soligo, M. J., Irwin, P. A., Williams, C. J. & Schuyler, G. D. (1998). A comprehensive assessment of pedestrian comfort including thermal effects. Journal of Wind Engineering and Industrial Aerodynamics, 77–78, pp. 753-766
Stathopoulos, T., Wu, H. & Zacharias, J. (2004). Outdoor human comfort in an urban climate. Building and Environment, 39, pp. 297-305
Robinson, D. (2012). Computer modelling for sustainable urban design: Physical principles, methods and applications. New York: Routledge.
Stevens, J. P. (2012). Applied multivariate statistics for the social sciences. New York: Routledge.
Waldron, J., & Salazar, J. (2013). Calculation of Areas of Permanence in Public Spaces, According to Solar Radiation Simulated Conditions. In Design, User Experience, and Usability. User Experience in Novel Technological Environments, 8014, pp. 215-223.