Active thermal mass enhancement using
1phase change materials
2T.R. Whiffen
a, G. Russell-Smith
b, S.B. Riffat
a 3acorresponding author:Thomas.whiffen@nottingham.ac.uk, +44(0)115 748 4839, Dept. Architecture and Built Environment, University Of 4
Nottingham, University Park, Nottingham, NG7 2RD, United Kingdom
5
bActimass Ltd., The Sir Colin Campbell Building, University of Nottingham Innovation Park, Triumph Road, Nottingham, NG7 2TU, United 6
Kingdom
7
ABSTRACT 8
Buildings account for around 40% of energy consumption in the UK. For over twenty years active thermal mass 9
systems have been a feature in low-energy buildings in northern Europe. By passing ventilation air, and utilising 10
night ventilation, through the hollow core structures efficient heating and cooling has been achieved. Despite 11
the success, such systems suffer from space overheating and efficiency losses during extended hot periods. 12
Control strategies have largely mitigated this effect however low cost retrofit solutions that enhance the system 13
are of interest. This research therefore investigates the benefit of using innovative phase change material (PCM) 14
solutions to enhance thermal comfort and reduced energy usage of traditional active thermal mass systems. 15
A prototype PCM enhancement was constructed, with energy saving and comfort benefits investigated under 16
controlled laboratory conditions. In absolute terms the PCM solution offered an additional 12.5% energy storage 17
capacity and a 29% increase in active surface area, coupled with the existing sensible thermal mass. Under 18
laboratory conditions the PCM addition saved an additional 0.1 kWh per day, delayed AC onset by 1.2 hours and 19
offered an average 1.0°C reduction in room temperature during eight hours of fixed cooling load, contrasted 20
against the original active thermal mass system. 21
KEY WORDS 22
1 Introduction
1
Worldwide, in 2011, 30EJ were consumed within service sector buildings, 26% of total built environment 2
consumption [1]. Assessing the end-use energy demand in such buildings (Figure 1.1), 33% of end-use energy 3
was consumed through space heating and cooling. The demand for energy supply continues to rise, putting extra 4
stress on energy markets and the environment, yet the energy intensity (energy consumption divided by 5
contribution to GDP) has not improved since the late 1980s, suggesting a lack of improvement in energy-6
efficiency [2]. To meet the UK government climate change targets (80% reduction by 2050), energy-efficient 7
measures, throughout the service sector built environment, are essential [3]. Through activation of building 8
thermal mass, space heating and cooling demands can be reduced and offset. 9
[image:2.595.158.433.306.506.2]10
Figure 1.1 - Service-sector Built Environment End-use Energy Breakdown for 2011 [1]
11
Active thermal mass systems utilise the intrinsic thermal mass of a building by incorporating an air network into 12
the mass. By embedding a fluid network into the thermal mass, the active heat transfer area is increased; 13
improving performance. Further, the conditioning of the air, through connected plant equipment, enables 14
temperature control of the thermal mass [4]. Heat recovery from the exhaust air through a thermal wheel 15
further improves efficiency. 16
Figure 1.2 demonstrates the temperature fluctuation and operation of the thermal mass in an active thermal 17
mass system. From point (1) to (3) internal gains from occupant behaviour and solar gains accumulate thermal 18
energy in the room, and subsequently in the thermal mass. The thermal mass moderates the temperature by 19
cooling system in the thermal mass until the required set point is reached ready for next day operation (points 1
(4) to (5)). 2
[image:3.595.53.513.126.449.2]3
Figure 1.2 - Diurnal temperature cycles for an active thermal mass application [4]
4
The popular Actimass and Termodeck [5] systems utilise ventilation air as the thermal fluid passing through an 5
air network in the hollow core slabs. The concrete hollow core absorbs heat from the room, whilst pre-6
conditioned ventilation air passes through the hollow core; before being released into the room, as 7
characterised in Figure 1.3. Invented in the late 1970’s a steady stream of computational and experimental 8
1
Figure 1.3 - Typical Hollow Core Air Network [6]
2
The ventilation air serves to maintain hollow core and room temperature. Air passing through the hollow core 3
en-route to the room increases the heat exchange rate through an increase in heat transfer area and forced 4
ventilation, whilst also enabling room temperature control through recycled heat. Heat transfer from the 5
thermal mass to room is no longer limited by the ceiling surface area, since pre-treated ventilation air conditions 6
the room also. 7
During hot spells night ventilation flushes the residual heat from the hollow core thermal mass. This extends the 8
operation envelope and ensures room temperatures never exceed the national standard office temperature 9
hours [7]. Night ventilation operation limits the applicability of the technology to buildings with intermittent 10
occupancy patterns. The temperature profiles, in Figure 1.4, demonstrate the twenty-four hour operation the 11
ventilated TES undertakes; maintaining comfort temperatures during occupied hours, and then discharging the 12
1
Figure 1.4 - 24hr Hollow Core Operation [6]
2
Commercial studies, to date, have focussed on building performance reviews; whilst most academic interest has 3
sought to characterise performance through computational modelling. Ren [8] used a simplified-combined-4
resistance or lumped-parameter method to model the hollow core network. The work suggested that the heat 5
transfer coefficient around the bend in the air network was fifty times greater than in the straight duct. However 6
modelling by Barton [9], using a two-dimensional finite-difference model, found minimal effect on overall heat 7
transfer due to the air network bends. Suggestion by Green [10] of additional internal baffles, to enhance heat 8
transfer, was made following validated CFD and laboratory investigations on a two-core test slab. 9
A three-year investigation by Winwood [5, 11, 12] used a CFD model of the hollow core to characterise the 10
performance under ventilated conditions. The work culminated in a full building assessment offering suggestions 11
to improve the building’s poor annual operation [11]. The problems noted inappropriate control, which 12
significantly hindered building energy reduction. To improve the active thermal mass system variable-speed fans 13
with high efficiencies was suggested. Additionally, the monitoring also revealed that during hot periods, where 14
ambient temperature was too high to achieve night cooling, little could be done except to switch off night 15
ventilation and wait for the next cool night. This hindrance highlighted the need to maximise the energy storage 16
capacity in the active thermal mass system and improve predictive control mechanisms that minimise daily 17
temperature gain in the thermal mass. 18
Since Winwood’s monitoring and analysis the control system and plant design of active thermal mass buildings 19
Traditionally additional chiller capacity in the plant is designed to satisfy peak cooling demand. The addition of 1
further thermal mass may offer a low energy alternative to chiller reliance. Based on European climate data, 2
free cooling via night ventilation is available through ninety-six percent of the year [13]. Although inhibiting to 3
active thermal mass efficiencies the occurrence of peak periods without available night cooling are rare in the 4
UK. 5
The work presented, in part, investigates whether additional latent thermal mass can mitigate saturation 6
temperatures during peak cooling load periods. Phase change material (PCM) addition, with specific melt 7
temperature, was used to increase the energy storage capacity of active thermal mass systems during 8
temperature operating regions where overheating threatened. Further, since peak periods account for less than 9
four percent of UK weather the work considered the benefit of PCM addition to a typical active thermal mass 10
system under typical free cooling conditions. Expected energy savings were investigated as well as thermal 11
comfort benefits. 12
PCM offers viable lightweight thermal energy storage (TES) solutions for energy savings within the built 13
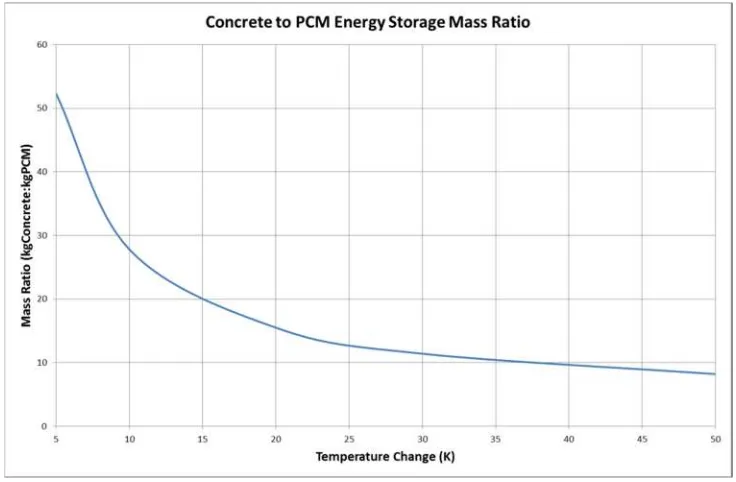
environment. Theoretically, PCM is capable of up to fifty times the energy storage density as concrete, assuming 14
all mass is evenly heated over a five kelvin range that includes the PCM melt temperature (Figure 1.5). 15
Applications of PCM as energy saving systems within the built environment vary from impregnated wall-board, 16
1
Figure 1.5 - Variation of Concrete to A22H PCM mass ratio with respect to thermal mass temperature change
2
PCM enhancement to concrete has long been studied. Three common methods for incorporating the PCM have 3
been investigated [15]: 4
1) Immersion [16, 17]: the solid concrete is immersed in liquid PCM causing PCM to solidify in the concrete 5
pores. 6
2) Impregnation [18, 19]: prepared porous aggregates are immersed in PCM liquid and allowed to cool. 7
Following saturation the PCM loaded aggregates are added to the concrete mix. 8
3) Direct mixing [18, 20]: the PCM is pre-encapsulated in microscopic capsules. The microencapsulated 9
PCM is subsequently mixed directly into the concrete mix. 10
From these methods both immersion and impregnation suffer from PCM leakage, inhibiting applications. Direct 11
mixing methods make use of microencapsulated PCM to avoid PCM leakage during their melt phase. 12
Additionally to the generic methods of PCM application to concrete outlined above, further research [21] sought 13
to optimise use of PCM in a thermally active building system (TABS). In the TABS a layer of PCM-concrete was 14
cast onto the ceiling soffit of prefabricated TABS. The investigation tested zero to six weight percent PCM-15
concrete mixes. Direct mixing using microencapsulated PCM was used. This method benefits from easy mixing 16
and application whilst avoiding leakage. Total levels of PCM however are limited based on the percentage of 17
Further, the investigation found that PCM addition to the concrete soffit inhibited the heat transfer from the 1
TABS since the PCM-concrete layer had a lower thermal conductivity than pure concrete. For effective use of 2
active thermal mass systems exposure of the soffit is paramount. Any further development of a PCM-concrete 3
active thermal mass system must consider the positioning of the PCM to maximise the latent benefits without 4
inhibiting the sensible thermal mass aspects. 5
The PCM system investigated in this work has been designed with retrofit of active thermal mass systems in 6
mind; therefore both a pilot-scale active thermal mass system and a prototype PCM system were designed, built 7
and tested to maintain an exposed soffit and maximise the active heat transfer surface. The key outputs 8
monitored are: 9
temperature reduction, 10
temperature offset, 11
energy savings, 12
and daily average cooling efficiency. 13
2 Background work
1
Prior to the laboratory investigation the pilot-scale active thermal mass system (hollow core) was modelled, 2
designed, built and installed into the test chamber. Additionally the PCM system prototype was modelled, 3
designed, built and installed. 4
2.1 Test facility
5The hollow core and PCM systems were installed into a purpose built test facility at the University of Nottingham. 6
The facility consisted of two comparable chambers (Room A and B), with a floor area of 4.3m2. Each chamber
7
was fitted with a heat pump air conditioning (AC) system providing mechanically ventilated air into the space. 8
K-type thermocouples were installed into both chambers to monitor room temperature. 9
The thermal mass system was installed into Room A, in addition to the AC system. Room B featured no thermal 10
mass and was conditioned using save for the AC system alone, and acted as a reference chamber to track 11
performance of the thermal mass system against. Power meters were fitted to the variable speed fan and AC 12
systems in both Room A and B to record energy consumption. Radiant heat mats were installed into both 13
chambers to mimic internal cooling loads. 14
2.2 Hollow core
15The pilot-scale hollow core system was constructed from an exhibition sample measuring 1.2 by 1.5 meters, with 16
a depth of 0.325 meters. The sample was made up of six cores, four of which running the length of the sample 17
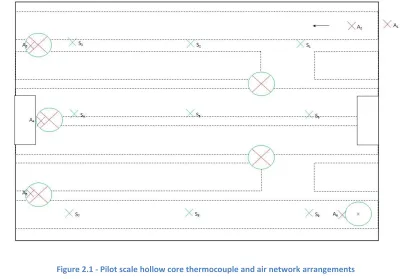
and two running three quarters of the length. An air network was prepared by drilling 125 millimetre cross-overs 18
and a 125 millimetre outlet as shown in Figure 2.1. The air network had an approximate active surface area of 19
3.8m2, more than two hundred percent greater than the soffit surface area alone. K-type thermocouples were
20
suspended throughout the air network and embedded in the slab, 40 to 70 millimetres from the soffit surface. 21
Additional concrete (40 to 70 millimetres deep) was laid to embed the sensors giving a total sample depth of 22
approximately 0.375 metres. The exposed cores were sealed using wooden boards and a variable-speed fan was 23
1
Figure 2.1 - Pilot scale hollow core thermocouple and air network arrangements
2
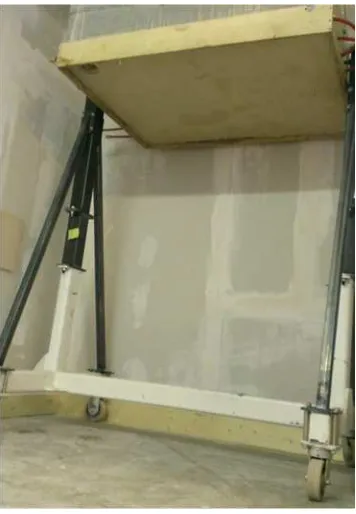
The sample, weighing 1.27 tonnes, was raised 2.1 metres above chamber floor level on a purpose built steel box 3
frame. The hollow core and frame were wheeled into the chamber. Subsequently the chamber floor and final 4
wall was constructed around the hollow core sample. The air network and thermocouples were connected. 5
6
Figure 2.2 - Pilot scale hollow core prior to modification and installation
[image:10.595.187.409.437.630.2]1
Figure 2.3 - Installed hollow core sample
2
2.3 PCM system
3The PCM system container was constructed from three millimetre aluminium sheeting and honeycomb. The 4
system contained 7.5 kilograms of PCM with an average melt temperature of 24.5°C and laboratory measured 5
latent heat of 164.6kJ/kg. The PCM was selected based on cost benefit analysis and to offer latent cooling 6
benefits when slab overheating threatened. The PCM system was retrofitted as part of the hollow core sample, 7
adding approximately 12.5 percent of thermal energy storage capacity and increasing the active surface area by 8
twenty-nine percent. 9
3 Method
1
To determine the thermal (temperature reduction) and energy saving benefits (temperature offset, measured 2
energy savings and daily average cooling efficiency) of the thermal mass technologies investigated combined 3
chamber tests were designed and conducted. The hollow core and PCM system were fitted into the thermal 4
mass chamber. Both the thermal mass and reference chambers were fitted with AC units, to thermo-regulate 5
the chambers, and a heat mat, to mimic internal gains. 6
Fixed occupancy, peak periodanddiurnal swingtests were conducted in the chambers to determine the energy 7
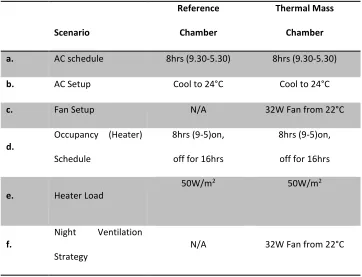
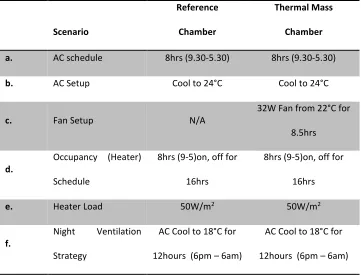
saving and thermal reduction benefits. Table 1 documents thepeak periodtest conditions for each thermal mass 8
system. Table 2 and Table 3 document thediurnal swing andfixed occupancyconditions respectively.Peak 9
periodtests were conducted over five consecutive days, thediurnal swingtests were conducted over three 10
consecutive days and thefixed occupancyconditions were maintained for twelve hours. For each of the test 11
conditions the ventilated hollow core (VHC) was tested initially, followed by the VHC retrofitted with the PCM 12
[image:12.595.117.479.438.715.2]system (VPHC) under the same conditions. 13
Table 1 – Peak Period Test Conditions
14
Scenario
Reference
Chamber
Thermal Mass
Chamber
a. AC schedule 8hrs (9.30-5.30) 8hrs (9.30-5.30)
b. AC Setup Cool to 24°C Cool to 24°C
c. Fan Setup N/A 32W Fan from 22°C
d. Occupancy (Heater) Schedule
8hrs (9-5)on, off for 16hrs
8hrs (9-5)on, off for 16hrs
e. Heater Load
50W/m2 50W/m2
f. Night Ventilation
Strategy N/A 32W Fan from 22°C
Table 2 – Diurnal-swing Test Conditions
1
Scenario
Reference
Chamber
Thermal Mass
Chamber
a. AC schedule 8hrs (9.30-5.30) 8hrs (9.30-5.30)
b. AC Setup Cool to 24°C Cool to 24°C
c. Fan Setup N/A 32W Fan from 22°C for
8.5hrs
d.
Occupancy (Heater) Schedule
8hrs (9-5)on, off for 16hrs
8hrs (9-5)on, off for 16hrs
e. Heater Load 50W/m2 50W/m2
f. Night Ventilation
Strategy
AC Cool to 18°C for 12hours (6pm – 6am)
AC Cool to 18°C for 12hours (6pm – 6am)
2
Table 3 – Fixed-occupancy Test Conditions
3
Scenario
Reference
Chamber
Thermal Mass
Chamber
a. AC schedule Off Off
b. AC Setup N/A N/A
c. Fan Setup N/A 32W Fan
d. Occupancy (Heater)
Schedule 12hrs On 12hrs On
e. Heater Load 50W/m2 50W/m2
f.
Night Ventilation
Strategy None None
Throughout the chamber tests temperatures and energy consumption were monitored. The peak period 4
conditions represent the times when no night cooling (free cooling) is available and active thermal mass typically 5
[image:13.595.121.479.435.686.2]this period was not monitored to represent free night cooling. Thefixed occupancyconditions were used to 1
observe temperature savings achieved by the enhanced system. During thediurnal swingandpeak periodtests 2
the AC cooling strategy was initiated when room temperatures exceeded 24°C. This strategy was used to 3
maintain comfort temperatures within each space, however, due to the PCM melt temperature (24.5°C) it is 4
understood that by initiating the AC unit before the majority of PCM has melted the associated energy savings 5
available will not be maximised. 6
7
4 Results and Discussion
1
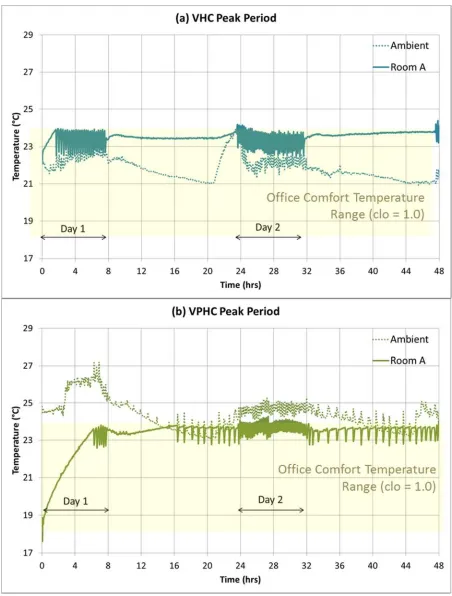
Temperature profiles for the first forty-eight hours underpeak periodconditions are presented in Figure 4.1 2
along with the office comfort temperatures, based on a clo figure of 1.0 [22]. The solid lines plot the average 3
temperatures in Room A. AC usage can be identified through sudden peaks and troughs in the room temperature 4
data. In both cases the VHC and VPHC systems failed to maintain comfort temperatures into the second day 5
without assistance from the AC unit. Significant night time cooling was required for the VPHC system to maintain 6
the room temperature at 24°C. This was due to the melt temperature of the PCM inhibiting the natural cooling 7
1
Figure 4.1 - 48 hour Ambient and Room A temperature profiles under peak period conditions
2
Diurnal swingconditions were investigated to observe the benefits of the PCM addition when free cooling was 3
available. The temperature profile plots for the first forty-eight hours for both the VHC and VPHC systems are 4
night cooling period (between the hours of eight and twenty, and, thirty-three and forty-five) the AC system and 1
fan power was not monitored by the power meter to represent free cooling. The energy usage per day (kWh) in 2
Table 6 and daily average cooling efficiency figures (Table 8) accounted for operation during the heated period 3
only. 4
Evidence from the Room A temperature profiles for both VHC and VPHC systems demonstrates peak 5
temperature delay during both of the ‘occupied’ heated day periods (zero to eight hours and twenty-four to 6
1
Figure 4.2 - 48 hour Ambient and Room A temperature profiles under diurnal swing conditions
4.1 Temperature reduction
1The temperature reduction represents the additional cooling achieved in the room due to the active thermal 2
mass systems. To assess the temperature reduction benefits of the PCM active thermal mass system 3
enhancement, the results from thefixed occupancytest were assessed. 4
[image:19.595.66.517.183.476.2]5
Figure 4.3 - VHC Temperature profiles after 12 hours under a 50W/m2 load
1
Figure 4.4 – VPHC Temperature profiles after 12 hours under a 50W/m2load
[image:20.595.192.403.416.566.2]2
Table 4 - Temperatures after 8 hours under 50W/m2Load
3
VHC VPHC
°C °C
Ambient 24.1 24.3
Room A 25.4 24.9
Room B 29.1 29.9
A – B -3.7 -5.0
The temperature against time plots (Figure 4.3 and Figure 4.4) plot the laboratory, the thermal mass chamber 4
(Room A) and reference chamber (Room B) temperatures for the twelve hour long tests. An internal load of 5
50W/m2was applied throughout the duration of the test. Figures in Table 4 were taken from the profiles in
6
Figure 4.3 and Figure 4.4 after eight hours of fixed occupancy heating. The VPHC system reduced Room A 7
temperature by 0.5°C against the VHC scenario. In commercial projects temperatures are designed to remain 8
In the Room A temperature curve the VPHC profile tracks the VHC trend for the first four hours. Once above 1
24°C the rate of temperature increase in Room A reduces in the VPHC case. At its most extreme this deflection, 2
caused by the melting PCM achieves a 0.9°C reduction in average room temperature. At the end of the twelve 3
hours the VPHC Room A temperature was 0.7°C below that of the VHC system. 4
To further assess the temperature savings the average occupied temperature difference was calculated. During 5
thefixed occupancyconditions the temperature saving benefit was observed. The differences in ambient and 6
reference temperatures were accounted for. Under these conditions the VPHC demonstrated an average 1.0°C 7
improvement respectively, against the VHC system. Therefore, where no backup AC system is present, VPHC 8
systems will offer greater comfort during hot periods. 9
4.2 Temperature delay
10The temperature delay represents the additional time the taken for the thermal mass chamber (Room A) to 11
reach peak temperature compared to the reference chamber. A peak temperature of 24°C was used since once 12
this temperature was exceeded the AC was initiated to maintain comfort conditions. Any temperature delay 13
achieved by the VHC or VPHC systems would therefore constitute energy savings to the building user by reducing 14
the electrical demand from the AC system. To determine the temperature delay the temperature profiles from 15
the first day of thepeak periodtests were observed. In Table 5 the peak delay was calculated as the time taken 16
[image:21.595.123.475.544.720.2]to go from 22°C to 24°C. 17
Table 5 – Day 1 peak temperature delay under peak period conditions
18
VHC VPHC
A: Peak Temperature
Delay Hours 1.7 2.7
B: Peak Temperature
Delay
Hours 0.9 0.7
A-B: Peak Temperature
Based on the findings in Table 5 the VHC delayed AC onset and peak temperature delay by 0.8 hours over Room 1
B. Comparatively the VPHC system delayed AC onset by 2.0 hours against Room B, 1.2 hours longer than the 2
VHC system. 3
The temperature profile (Figure 4.1) demonstrates that overnight the slab remains at a high temperature, 4
therefore no cooling capacity is replenished in the slab. Consequentially no peak delay is evident in day two. 5
Contrastingly, thediurnal swingtemperature profile (Figure 4.2) demonstrates that the cooling capacity of both 6
systems was replenished during the night and utilised during the first half of each day. The VPHC system 7
increases the peak temperature delay by up to one hour per day underdiurnal swingconditions. 8
4.3 Energy Savings
9The energy consumption figures for Room A and B in Table 6 were gathered from data collected by the power 10
meters in each chamber. The total energy consumption recorded has been converted into a kWh per day figure. 11
The energy savings achieved by in the thermal mass chamber were calculated from Room A energy consumption 12
[image:22.595.78.514.445.647.2](kWh) minus Room B energy consumption (kWh). 13
Table 6 - Energy usage under peak and diurnal swing conditions
14 VHC Peak Period VPHC Peak Period VHC Diurnal Swing VPHC Diurnal swing
A: Energy usage per day
(kWh) 3.2 4.2 1.5 1.4
B: Energy usage per day
(kWh)
2.2 3.4 1.8 2.2
A – B: Energy difference
per day (kWh) 1.0 0.8 -0.3 -0.8
During thepeak periodconditions the active thermal mass system, VHC, required an additional 1.0 kWh per day 15
more than the reference chamber (Room B). Although energy savings were observed in day one, subsequent 16
days, following nights without free cooling, required additional AC cooling during the occupied day. This was in 17
line with work conducted by Winwood [11]. In an effort to increase the thermal mass capacity, whilst reducing 18
was tested underpeak periodconditions. As with the VHC system, the absence of free night cooling limited the 1
thermal mass cooling effect to the first day. Following the first warm night additional cooling of 0.8 kWh were 2
required to maintain comfort temperatures in Room A, compared to Room B. The VPHC system used 0.2 kWh 3
per day less than the VHC system underpeak periodconditions. 4
The figures in Table 6 demonstrate that under synthesised free coolingdiurnal swingconditions, 1.7 and 2.8 5
kWh per day less energy was used to maintain comfort conditions than under thepeak periodconditions, for 6
the VHC and VPHC systems respectively. The VPHC system saved 0.1 kWh per day, based on Room A energy 7
usage, against the VHC usage; however saved 0.8 kWh per day, 0.5 kWh more than the VHC system’s savings of 8
0.3 kWh per day, based on the relative difference between Room A and B energy usage. 9
The lack of energy savings underpeak periodconditions was due to the thermal mass acting as a storage heater 10
into the day two ‘occupied’ period and beyond. Without free night cooling during subsequent nights there was 11
insufficient capacity in the system to provide cooling from the thermal mass. The additional PCM exacerbated 12
the problem, adding further mass to act as a storage heater throughout night and day (‘occupied’) periods. 13
Under diurnal swing conditions the energy saving benefits of the VPHC system were demonstrated. The 14
additional thermal mass increases the cooling capacity of the system, postponing AC usage and thus saving 15
energy through ‘occupied’ hours. The VPHC system offered a 0.1 kWh per day improvement on the VHC 16
performance (based on the VPHC to VHC Room A usage difference in Table 6). This translates to a 7% saving, 17
from an additional 12.5% thermal capacity. This under performance is likely due to the PCM not fully melting 18
during the ‘occupied’ period. With an average melt temperature of 24.5°C, above the AC onset temperature of 19
24°C, the full capacity of the PCM system was not utilised. 20
4.4 Daily Average Cooling Efficiency
21The daily average cooling efficiency (DACE) was calculated to give a representation of the system’s ongoing 22
operational efficiency under the test conditions. It has been calculated following an equivalent method to the 23
European Seasonal Energy Efficiency Ratio (ESEER) [23] which quantifies the effective energy out, divided by the 24
input energy. The figure is akin to the coefficient of performance (COP) and energy efficiency ratio (EER) figures 25
for heat pumps; which each quantify the ratio of useful output to energy input [24]. The greater the ESEER, the 26
Monodraught’s Cool-Phase system has an ESEER of 7.3. Due to the limited time period and conditions tested 1
there was insufficient data to calculate the ESEER, therefore the DACE was calculated. 2
4.4.1 DACE Calculation Method 3
ܦܣܥܧ=ܧ݊݁ݎ݃ݕ ܥ݊ݏݑ݉ ܷ݁݀ݏ݂݁ݑ݈ܥ݈݅݊݃ (1)
The (DACE) was calculated based on equation (1) above. The measure of energy efficiency was calculated based 4
on theuseful cooling (kWh) of the active thermal mass system, divided byenergy consumed (kWh) during 5
occupied periods (eight hours per day) [24]. Theuseful coolingwas calculated from the component equations 6
(2) to (3).Energy consumedwas read daily from energy meters monitoring the AC and fan equipment. 7
ܦܣܥܧ=∑ݍ௦+∑ݍெ∑ܳ+∑ݍ− ∑ܳ௪ ௧௦
+∑ܳ
(2)
ݍ௦,=݉௦ܿ,௦൫ܶത௦,−ܶത௦,൯ (3)
The slabuseful coolingcomponent (qslab) at time, j, was calculated from equation (3). The temperature of the
8
entire slab has been approximated equal to the average slab temperature, measured at a depth of 50mm from 9
the soffit surface by nine embedded type-K thermocouples. 10
ݍ,=݉̇ܿ,൫ܶത,−ܶ ௧,൯
(4)
The airuseful coolingcomponent (qair) at time, j, was calculated from equation (4), where the mass flow rate
11
was calculated from equation (5). The temperature difference was based on the average room temperature, at 12
time j, and the slab inlet air temperature from the previous time step, i. 13
݉̇=ߩܦݒ (5)
Where applicable, The PCM useful coolingcomponent (qPCM) was a function of the PCM latent and sensible
14
cooling loads, the PCM mass and the PCM temperature between time j and i, as shown in equation (6). 15
To approximate the combined cooling load, effective heat capacity (Ceff(TPCM,i)) figures were calculated at half
1
degree increments, based on physical properties of the installed PCM using the Gausian equation below [25]. 2
Inputs for each physical property can be found in Table 7. 3
ܿ(ܶெ,) =ܿ௦+ܽ݁ି.ହ൬ ்ುಾ,ି்
൰
మ
(7)
To account for chamber heat loss, heat transfer through the chamber wall was calculated, Qwall transfer, based on
4
the wall properties and ambient and average room temperature differentials (equation (8)). 5
ܳ௪ ௧௦,=ܷ௪ ܣ௪ ൫ܶ ,−ܶത,൯ (8)
The figures,QACand Qfan, on the bottom of equation (2) were measured during the experiments using energy 6
meters. Each cooling component was summed throughout the occupied hours of the test; therefore the DACE 7
[image:25.595.82.501.391.725.2]figure represents an occupied efficiency only. Table 7 details the inputs used throughout the analysis. 8
Table 7 – Equation Inputs
9
Symbol Term Units
݉௦ Mass of Slab 1269.8 kg
ܿ,௦ Concrete Specific Heat 0.9 kJ/kgK
ܶത௦,
Average Slab Temperature
time dependant, measured
variable °C
ܶത௦,
ߩ Air density 1.2 kg/m2
ܦ Outlet Diameter 0.125 m
ݒ Air Velocity at Outlet 2.5 m/s
ܿ, Air Specific Heat 1.005 kJ/kgK
݉ெ Mass of PCM 7.5 kg
ܿ(ܶெ,) Effective Heat Capacity seeFigure 4.5 J/kgK
ܿ௦ Heat Capacity in Solid State 1.9 kJ/kgK
ܶெ, PCM Temperature time dependant, measured
variable °C
Tm Melt Temperature 24.5 °C
b Melting Width Factor (Standard Deviation, Function of Purity)
2.5 °C
Uwall Heat transfer coefficient 0.65 W/m2K
Awall Area of chamber wall 17.64 m2
Tamb,i Ambient Temperature time dependant, measured
variable
°C
ܶത, Average Room Temperature °C
1
[image:26.595.52.527.72.632.2]2
Figure 4.5 - Effective Heat Capacity for the installed PCM over a 0 to 50°C temperature range
3 4
Table 8 - DACE figures under peak and diurnal swing conditions
5
Room A
Occupied
Totals Units
VHC
Peak
Period
VPHC
Peak
Period
VHC
Diurnal
Swing
VPHC
Diurnal
swing
VHC
Fixed
Occupancy
VPHC
Fixed
Occ. Hours Hours 40 40 24 24 18 18
qslab kWh -2.6 0.1 3.6 3.4 2.8 2.8
qPCM kWh - 0.2 - 1.6 - 1.6
qair kWh 2.5 2.8 0.2 -0.04 -1.0 -1.0
Qwall transfer kWh 8.3 9.4 6 6.1 3.8 3.9
QAC+Qfan kWh 16.2 20.9 4.4 4.2 0.6 0.6
A: DACE 0.51 0.60 2.23 2.63 9.33 12.17
A – B: DACE -2.79 -2.44 0.46 0.86 -
-Table 8 displays the components and DACE figures for the thermal mass systems underpeak period, diurnal 1
swingandfixed occupancyconditions. The occupied totals have been converted into kWh from W based on the 2
duration of occupied hours for each respective investigation. The DACE figures have been calculated using 3
equation (2). 4
The VPHC system demonstrated greater DACE than the VHC system, an improvement of 0.4 underdiurnal swing 5
conditions. This was due to the additional thermal mass offering additional useful cooling during the daily 6
‘occupied’ period. This improvement represents an 18% increase in energy efficiency performance, from an 7
addition of 12.5% thermal capacity. 8
Underfixed occupancyconditions the AC onset temperature of 24°C was removed, therefore the energy input 9
(QAC+Qfan) was made up solely of the fan power. The great reduction in energy input resulted in a significant
10
increase in DACE. Thefixed occupancyfigure represents the efficiency possible if the system follows a control 11
strategy capable of alleviating backup AC usage. The VPHC performance improvement, over the VHC system 12
underfixed occupancyconditions, represents a 30% gain. A DACE figure for Room B during thefixed occupancy 13
test was not possible since there was no energy input, since no cooling system was in operation. The fixed 14
occupancyfigure does not take into account any pre-cooling or subsequent night cooling required to recharge 15
for the next ‘occupied’ period. 16
In addition to minimising AC power, the fixed occupancy performance improvement can be attributed to 17
[image:27.595.57.538.72.297.2]PCM B bulk temperatures reached a maximum of 25.4 and 22.9°C respectively. Underfixed occupancyconditions 1
the same readings reached a maximum of 29.4 and 25.3°C respectively. This increase in temperature under the 2
latter conditions demonstrates a complete usage of the latent capacity in PCM A, and greater usage of the latent 3
capacity available in PCM B. Further optimisation to ensure year round usage of available latent capacity within 4
the room operation temperature envelope will improve energy savings and the energy efficiency of the systems. 5
5 Conclusions
6
Thermal comfort and energy saving benefit of hollow core system was improved by the addition of active PCM 7
thermal mass, avoiding the inhibiting effects of poor PCM thermal conductivity observed in [21]. Underpeak 8
periodconditions where no free night cooling was available the active PCM addition was unable to reduce energy 9
usage. AC backup was required to maintain comfort conditions. 10
After eight hours offixed occupancyconditions the VPHC system saved 1.3°C more than the VHC system, against 11
the reference chamber (Room B) temperatures. Duringdiurnal swingtesting the VHC and VPHC registered daily 12
average cooling efficiency (DACE) figures of 2.2 and 2.6 respectively, suggesting an energy efficiency benefit 13
when sufficient free night cooling is available. Underfixed occupancyconditions the VHC and VPHC DACE was 14
9.3 and 12.2 respectively, highlighting the benefit of minimising AC and fan usage, whilst maximising latent 15
thermal energy storage. 16
On an energy-saving level the VPHC system saved 0.1 kWh per day more than the VHC system underdiurnal 17
swingconditions. Underpeak periodconditions the VHC and VPHC systems used 1.0 and 0.8 kWh per day more 18
than the reference chamber (Room B). The thermal mass chamber (Room A) used more energy under these 19
conditions due to the absence of free night cooling. Thus the thermal mass no longer cooled the space, but 20
heated it, requiring additional cooling from the backup AC system. 21
Overall the VPHC system offered energy savings in two out of the three conditions tested. The additional thermal 22
mass did not mitigate AC usage during peak periods, however saved energy when free cooling was available 23
(96% of the time in a European climate [13]). Further development of accompanying control strategies that 24
design to ensure full latent thermal energy storage is utilised during a typical eight-hour occupied period would 1
see improvements in energy efficiency. 2
6 Acknowledgements
3
This research has been supported through an Innovate UK grant led by industrial partner, Actimass Ltd. 4
7 References
5
1. International Energy Agency (IEA),Energy Technology Perspectives. 2014. 6
2. Wade, J., Pett, J., Ramsay, L.,,Energy efficiency in offices: Assessing the situation.The Association for 7
the Conservation of Energy, 2003. 8
3. Davey, E.,The Energy Efficiency Strategy: The Energy Effciency Opportunity in the UK, D.o.E.a.C. Change, 9
Editor. 2012. 10
4. Lehmann, B., V. Dorer, and M. Koschenz,Application range of thermally activated building systems tabs. 11
Energy and Buildings, 2007.39(5): p. 593-598. 12
5. Winwood, R.B., R. and R. Edwards, Advanced fabric energy storage I: Review. BUILDING SERVICES 13
ENGINEERING RESEARCH TECHNOLOGY, 1997.18(1): p. 1-6. 14
6. Xu, X., et al.,Research and application of active hollow core slabs in building systems for utilizing low 15
energy sources.Applied Energy, 2014.116(0): p. 424-435. 16
7. Olesen, B.W. and K.C. Parsons,Introduction to thermal comfort standards and to the proposed new 17
version of EN ISO 7730.Energy and Buildings, 2002.34(6): p. 537-548. 18
8. Ren, M. and J. Wright,A ventilated slab thermal storage system model.Building and Environment, 1998. 19
33(1): p. 43-52. 20
9. Barton, P., C. Beggs, and P. Sleigh,A theoretical study of the thermal performance of the TermoDeck 21
hollow core slab system.Applied Thermal Engineering, 2002.22(13): p. 1485-1499. 22
10. Green, N.,Characterising the thermal energy transfer within a ventilated hollow core slab system. 2010, 23
University of Bath: Bath. 24
11. Winwood, R., R. Benstead, and R. Edwards, Advanced fabric energy storage IV: Experimental 25
monitoring.Building Services Engineering Research and Technology, 1997.18(1): p. 25-30. 26
12. Winwood, R., R. Benstead, and R. Edwards, Advanced fabric energy storage II: Computational fluid 27
dynamics modelling.Building Services Engineering Research and Technology, 1997.18(1): p. 7-16. 28
13. Artmann, N., H. Manz, and P. Heiselberg,Climatic potential for passive cooling of buildings by night-29
time ventilation in Europe.Applied Energy, 2007.84(2): p. 187-201. 30
14. Whiffen, T.R. and S.B. Riffat, A review of PCM technology for thermal energy storage in the built 31
environment: Part II.International Journal of Low-Carbon Technologies, 2012. 32
15. Ling, T.-C. and C.-S. Poon,Use of phase change materials for thermal energy storage in concrete: An 33
overview.Construction and Building Materials, 2013.46(0): p. 55-62. 34
16. Hawes, D. and D. Feldman,Absorption of phase change materials in concrete.Solar Energy Materials 35
and Solar Cells, 1992.27(2): p. 91-101. 36
17. Lee, T., et al.,Control aspects of latent heat storage and recovery in concrete.Solar energy materials 37
and solar cells, 2000.62(3): p. 217-237. 38
18. Bentz, D.P. and R. Turpin, Potential applications of phase change materials in concrete technology. 39
Cement and Concrete Composites, 2007.29(7): p. 527-532. 40
19. Zhang, D., et al.,Development of thermal energy storage concrete. Cement and concrete research, 41
2004.34(6): p. 927-934. 42
20. Hunger, M., et al., The behavior of self-compacting concrete containing micro-encapsulated Phase 43
21. Pomianowski, M., P. Heiselberg, and R.L. Jensen, Dynamic heat storage and cooling capacity of a 1
concrete deck with PCM and thermally activated building system.Energy and Buildings, 2012.53(0): p. 2
96-107. 3
22. CIBSE,The Limits of Thermal Comfort - Avoiding Overheating in European Buildings - CIBSE TM52: 2013. 4
2013, CIBSE. 5
23. Monodraught Ltd,Cool-Phase: Low energy cooling and ventilation system. 2014. 6
24. Butcher, K.J.,CIBSE Guide F - Energy Efficiency in Buildings (3rd Edition). 2012, CIBSE. 7
25. Darkwa, K. and P.W. O’Callaghan,Simulation of phase change drywalls in a passive solar building. 8
Applied Thermal Engineering, 2006.26(8–9): p. 853-858. 9
![Figure 1.1 - Service-sector Built Environment End-use Energy Breakdown for 2011 [1]](https://thumb-us.123doks.com/thumbv2/123dok_us/8662847.375499/2.595.158.433.306.506/figure-service-sector-built-environment-end-energy-breakdown.webp)
![Figure 1.2 - Diurnal temperature cycles for an active thermal mass application [4]](https://thumb-us.123doks.com/thumbv2/123dok_us/8662847.375499/3.595.53.513.126.449/figure-diurnal-temperature-cycles-active-thermal-mass-application.webp)
![Figure 1.3 - Typical Hollow Core Air Network [6]](https://thumb-us.123doks.com/thumbv2/123dok_us/8662847.375499/4.595.143.446.68.318/figure-typical-hollow-core-air-network.webp)
![Figure 1.4 - 24hr Hollow Core Operation [6]](https://thumb-us.123doks.com/thumbv2/123dok_us/8662847.375499/5.595.103.484.68.279/figure-hr-hollow-core-operation.webp)