To Replicate or Not To Replicate? Exploring Reproducibility in
Economics through the Lens of a Model and a Pilot Study
ByZACHARIASMANIADIS, FABIOTUFANO ANDJOHNA. LIST*
The sciences are in an era of an alleged ‘credibility crisis’. In this study, we discuss the reproducibility of empirical results, focusing on economics research. By combining theory and empirical evidence, we discuss the import of replication studies, and whether they improve our confidence in novel findings. The theory sheds light on the importance of replications, even when replications are subject to bias. We then present a pilot meta-study of replication in experimental economics, a subfield serving as a positive benchmark for investigating the credibility of economics. Our meta-study highlights certain difficulties when applying meta-research to systematise the economics literature.
Is the model of self-correcting science and cumulative knowledge growth a fitting description of the contemporary world of academic research? An active debate about whether this is the case has recently developed, both among academics (e.g., Ioannidis, 2005; 2008; 2012) and the popular press. Other critics have joined, arguing that there is a ‘credibility crisis’ in
several scientific disciplines, including psychology (Nosek et al., 2012), management (Bettis,
2012), and several branches of the biological and human sciences (e.g., Jennions and Moller, 2002; Ioannidis, 2005).1 The word ‘crisis’ refers to a widespread concern that there is a reproducibility problem due to a sizable fraction of published findings being type-I errors, or ‘false positives’ (i.e., scientific ‘discoveries’ of statistical relations that are in fact not true). Given the great importance of science and the amount of resources with which society entrusts it, an excess of false positives constitutes a severe problem.
This credibility concern has led to the development of empirical studies that offer a birds-eye view of the literature. Many of these developments have taken place in psychology, with methodological advances (e.g., Simonsohn, 2015) special issues in elite journals (e.g., Pashler and Wagenmakers, 2012) and large scale collaborations (Open Science Collaboration, 2012) having been devoted to the topic. This, in its turn, has led to a heated debate (e.g., Gilbert et al., 2016) regarding the state of the discipline. Given the import of the potential problem and the substantial methodological differences of economics from biomedical disciplines and psychology, one may ask: are these techniques and insights transferable to economics? And, should they be applied more frequently?
Importantly, the relative degree to which economics research suffers from the reproducibility problem is still not fully understood. Camerer et al. (2016) replicated several well-known experiments in economics following the approach of large-scale replication of
the Open Science Collaboration. Based on a smaller number of replications, Camerer and colleagues found that experimental economics research published in top journals is more reproducible than psychological research. The crisis from other disciplines and the novel focus on reproducibility have also spurred responses, including the new Berkeley Initiative for Transparency in the Social Sciences and the launch of the Journal of the Economic Science Association devoted to methodology and replication. In addition to proposing replicability strategies employed in other disciplines, it is important to examine whether it is possible to employ tools from the new discipline of meta-research (Ioannidis et al., 2015) to identify and explore the critical dimensions of the reproducibility of economic research.
In this paper we follow this approach. We first add structure to the concept of ‘measuring the credibility of a research’ using an extension of the Bayesian framework employed in Ioannidis (2005) and Maniadiset al. (2014) to derive the Post-Study Probability (ܲܵܲ) that an association is true. Our framework shows that to assess if we should update our priors upon receiving new results, we should be interested in much more than p-values. Indeed, any appropriate updating requires information not only on received p-values, but also critically depends on research priors and statistical power of the experiment. We illustrate how the nature of the inference problem, given current practices, can lead to unreliable results and we discuss the lack of quantification of research priors and statistical power in economics. But, even if initial results are unreliable, does replication not ensure that the economics literature is credible as a whole?
presence of a set of replication results containing both successes and failures our posteriors can be particularly low if the relevant designs had high average power.
We then perform a pilot meta-study of experimental economics, the sub-discipline of empirical economics with arguably the best a priori credibility (Harrison and List, 2004; Duflo, 2006; Angrist and Pischke, 2010).2Our approach is to emulate a meta-research model from psychology (Makelet al., 2012). Our empirical attempt reveals substantial difficulties in translating the methodology to economics, partly stemming from the lack of a tradition in meta-research in our discipline. Developing such a tradition will enhance the potential of quantitative methods to study reproducibility practices and outcomes in economics.3 However, it will also come at a cost, since it entails some effort by individual researchers to specify primary hypotheses and to be clear about the type of study they are conducting (original study, conceptual replication, etc.).
The remainder of the paper is organised as follows. Section 1 introduces the basic framework of analysis and provides thought examples. Section 2 discusses the existing evidence in economics. Section 3 presents the model of biased replication and its implications for inference. Section 4 describes our empirical study and presents its results. Section 5 addresses what our empirical results entail within the model of replication. Section 6 concludes with a discussion of future research avenues.
1. Newly Discovered Associations: A Methodological Appraisal
Given publication of a newly discovered finding, how much confidence should we have that it is true? Following Maniadis et al. (2014), we use a framework developed in the life
2In our empirical study, we focus on the sub-discipline of experimental economics, but our approach speaks generally to empirical analyses. In fact, experimental economics is a limiting case of empirical economics in which researchers have higher degrees of control on the data-generation process. Therefore, it can constitute the basis for comparison to other empirical fields in economics. For Ioannidis and Doucouliagos ‘experimental designs have inherently better protection from many confounding biases than observational data’(Ioannidis and Doucouliagos, 2013, p. 4), a view that recent empirical evidence appears to corroborate by reporting that experimental economics exhibits abnormal patterns of statistical results to a smaller degree than other empirical fields in economics (Brodeuret al., 2016).
sciences (Wacholder et al., 2004; Ioannidis, 2005) to assess the fraction of findings corresponding to false positives; and, therefore, to derive a measure of the confidence with which we should view empirical results. The model pertains to classical experiments with simple linear hypotheses, which are not only easy to model, but also whose design facilitates replication attempts.
We denote݊as the number of research questions4examined in a specific field,ߨ݊of which are actually true.5Using standard terminology,ߙis the typical significance level in the field (usuallyߙ= 0.05) and1 −ߚis the typical power of an experimental design in this field. We can think of the process with which ‘Nature’ determines whether two phenomena are associated with each other as a random experiment. Using this interpretation,ߨis a probability, and we are interested in the Post-Study Probability (PSP) that a research finding is true. The PSP is given by dividing the number of true associations declared true by the number of all associations which are declared true:
ܲܵܲ=(1 −ߚ()1 −ߨ+ߚߙ)(ߨ1 −ߨ). (1)
It is natural to ask: what factors can affect the PSPand, in general, our confidence in the published literature? Several factors are relevant for a given discipline:(݅)research priors and the existence of structured theory testing,(݅݅)study power and sample size,(݅݅݅)biases and conflicts of interest,(݅ݒ)researcher competition in the presence of publication bias, and
(ݒ)the frequency of replication studies. Point(݅ݒ)is discussed in Maniadiset al. (2014) and
(ݒ)will be tackled thoroughly in our main model. We shall now expand on the first three factors.
4Each question examines an ‘association’ or ‘relationship’ between variables, and thus we shall be using the terms ‘association’, ‘relationship’, and ‘research question’ interchangeably.
5ߨcan also be defined as the prior probability that the alternative hypothesis߅
ଵis actually true when performing a statistical test of the null
1.1.Priors and Theory Testing vs. Exploration
From equation 1, a key determinant of the PSP is the level of the research prior,ߨ. To illustrate the importance of this variable, let us start from the hypothetical case where for a given scientific field, ‘surprise’ discoveries (rather than theory-driven ones) are necessary in order to achieve publication in a major academic journal. For simplicity, assume that the research design has maximum power (ߚ= 0) and the usualߙ= 0.05. Further, assume that ‘surprise’ associations are those findings that are ‘1 in 100 results.’ That is, of 100 potentially surprising associations studied, one is known to be true (ߨ= 0.01). In this case, the probability of both a true association and a rejection of the null hypothesis is 0.01*1 = 0.01. And, the probability that there is both no association and rejection of the null hypothesis is 0.99*0.05 = 0.0495. Thus, the total probability of rejection is 0.01 + 0.0495 = 0.0595. Thus, when a researcher rejects the null hypothesis in this case, there is an 84 percent (0.04995/0.0595) chance that there is no association (a false positive). Accordingly, there is only a 16 percent chance that the statistically significant finding represents a true association.
The question of where exactly these priors come from is a fundamental problem for Bayesian analysis. One possible answer is straightforward: it is past scientific knowledge that informs our priors for future explorations. In this way, theory is the bridge between existing knowledge and predictions about the results of future studies. Accordingly, in disciplines where empirical studies are based on well-grounded theory, we should expect that research priors are ‘better defined’ (i.e., theory driven research has higher priors, ceteris paribus). On the other hand, in disciplines where exploration and ‘discovery’ tends to play a larger role than theory, we should expect more sceptical priors.
epidemiology there are a huge number of genes that may potentially be associated with some health conditions. Accordingly, since empirical studies are typically not theory-driven, meta-researchers have made the claim that studies that uncover very strong statistical associations should be seen with much skepticism and their findings be assigned a very low PSP (Ioannidis, 2005).The reason is that, since there is no a priori reason to expect one particular gene plays the specific role discovered by a given study, any reasonable prior for the association should be in the order of one in the millions.
On the other hand, provided there is a plausible biological mechanism that can be used to pinpoint the specific gene that is being examined in a given epidemiological study, the prior should be associated with the plausibility of the theoretical mechanism and not just with the number of possible genes. In general, the existence of a tradition of theory-testing tends to change the set of questions that are being examined in a discipline, causing a selection effect of focusing on more plausible associations.6
1.2.Power and Sample Size
Equation (1) suggests that a research finding is more likely to be true than false if[(1 −ߚ)ߨ/
(1 −ߨ)] >ߙ: that is, for a given significance level the pre-study odds are beneficial and the study is powerful enough. This conveniently allows us to expressPSPas a function of sample size via the power of the experimental design. Under several simplifying assumptions, Listet al. (2011) show that the optimal sample sizes for an experimental control (ܰ∗) and treatment
(ܰଵ∗ ) group are equal toܰ∗= ܰଵ∗ =ܰ∗ =ቂ2൫ݖఈ/ଶ+ݖఉ൯ଶ(ߪ ߜ⁄ )ଶቃ.7 Here, 2 is the conditional variance of the outcome of both control and treatment groups, is the minimum economically relevant difference between mean control and treatment outcomes, andݖis the p-quantile of the standard normal distribution.
If one follows the literature and uses a significance level of 0.05, and sets experimental power to 0.80, we haveݖఈ/ଶ = 1.96and ݖఉ = 0.84 from standard normal tables. However, we may also consider lower power levels, say0.50or0.20, which can be observed in the literature (Zhang and Ortmann, 2013; Ioannidis et al., forthcoming). Then, theݖఉ from standard normal tables are0.00and−0.84. In order to detect a one (resp. one-half) standard deviation change in the outcome variable, this would lead to sample sizes of ܰ∗ = 8(resp.ܰ∗ = 31) with a0.50power andܰ∗ = 3(resp.ܰ∗ = 10) with a0.20power.
This is in contrast with the sample sizeܰ∗= 16 (resp.ܰ∗= 63) that we would need in order to achieve power equal to0.80. To obtain a clearer idea about the relationship between sample size and thePSP, notice that the approximate power function is:
1 −ߚ=ܲݎ{ܼ< −ܼఈ ଶ⁄ ݎܼ> ܼఈ ଶ⁄ |ܪଵ݅ݏݐݎݑ݁} =
= 1 − Φቀܼఈ ଶ⁄ − √ܰߜ ඥൗ 2ߪଶቁ+ Φቀ−ܼఈ ଶ⁄ − √ܰߜ ඥൗ 2ߪଶቁ=
= Φቀ−ܼఈ ଶ⁄ +√ܰߜ ඥൗ 2ߪଶቁ+ Φቀ−ܼఈ ଶ⁄ − √ܰߜ ඥൗ 2ߪଶቁ,
withΦ(z)being the cumulative density function of a standard normal random variable. It follows thatPSPcan be rewritten as:
7These optimal sample sizes are the smallest sample sizes that achieve a given power level(1 −ߚ)for a fixed significance levelߙand varianceߪଶ.The researcher makes a two-sided test of the hypothesis thatߤ=ߤଵ,and specifies a minimum scientifically relevant level of the treatment effect (ߜ=ߤଵ−ߤ> 0). The estimation of power is based on the sampling distribution that occurs when the true effect
equals δ. In our calculations here we assume that the experimental treatment might affect the mean, but not the variance of the outcomes.
ܲܵܲ=
ቈΦቆ−ܼఈ ଶ⁄ + √ܰߜ
√2ߪଶቇ+ Φቆ−ܼఈ ଶ⁄ − √ ܰߜ
√2ߪଶቇߨ ቈΦቆ−ܼఈ ଶ⁄ + √ܰߜ
√2ߪଶቇ+ Φቆ−ܼఈ ଶ⁄ − √ ܰߜ
√2ߪଶቇߨ+ߙ(1 −ߨ)
. (2)
This is increasing in N. Thus, asN becomes larger, PSP increases. That is, from equation 2 we learn that we should be more secure in our initial findings with larger sample sizes, and by specifying the terms of this equation we may gain quantitative insights by just how much.
From this, one might conclude that if a treatment effect is statistically significant with ܰ observations, it will necessarily be statistically significant withܰ+ 1observations. The model highlights that this common intuition is flawed. What is true is that as Nincreases we are more likely to find the truth—that is because as N grows the empirical estimate approaches the truth. The implication is that if a research study rejects a true null (reports a false positive), it is not more likely to reject a true null with a larger sample size. In fact, it is less likely to report a false positive because a larger sample size increases the chances of finding the truth.8
As we shall show later in our model with biased replication (which abstracts away from publication bias), these insights are not generally true when we conduct inference from multiple replications and evidence is mixed. In ex-post inference, if we condition on a set of results that have positive as well as negative replications, the negative ones are extremely unlikely to be obtained under a true association if studies are well-powered.
1.3.Research Bias
To all the factors described above, one should add the subjective element that stems from the fact that study design and empirical data analysis involves a series of subjective choices, which are likely to bias research outcomes whenever the interests of researchers favour a specific pattern of results. This does not necessarily entail fraud, but most often is caused by a natural human tendency to interpret ambiguous signals in a self-serving way (Babcock and Loewenstein, 1997; Dawson et al., 2002). The ‘research bias’ ݑ is defined as ‘the combination of various design, data, analysis, and presentation factors that tend to produce research findings when they should not be produced’ (Ioannidis, 2005, p. 697). Notice that the bias does not refer to chance variability or ideological bias in researchers’ beliefs (Maniadiset al., 2014). In the model, the research bias is captured by assuming that a fraction ݑof the times where a non-significant outcome should not be declared, in fact it isdeclared significant (because of research bias). Hence, thePSPin the presence of bias (PSPBias) will be equal to:
ܲܵܲ௦= (1 −ߚ)ߨ+ߚߨݑ
(1 −ߚ)ߨ+ߚߨݑ+ [ߙ+ (1 −ߙ)ݑ](1 −ߨ). (3)
The derivative of this expression with respect toݑis negative ifߨ(1 −ߨ)[ߙ+ߚ−
1] < 0, which is typically true. The concept of bias is multi-dimensional, and in particular we hypothesise thatݑ= ݂(݀,ߤ,ߦ). For illustration, in what follows we use the simple functional form ݑ=݀ߤߦ. The first determinant of the bias, represented by the parameter 0 ≤݀≤
to which researchers have less opportunities to publish non-significant outcomes, which entails strong preferences for some specific pattern of outcomes (it is not only good methodology that matters). As long as there is no preference for positive results (ߤ= 0) there can be no distortion of the sort we have assumed here (which simply tends to declare results as significant when they should not be declared as such).
The third component of the bias, represented by the parameter0 ≤ߦ≤ 1,measures the publication pressure and captures the publish-or-perish culture (or, put differently, represents the returns from publication). The variablesߤandߦmediate the transformation of degrees of freedom into biased research – there is empirical evidence that publication pressures tend to increase the bias (Fanelli, 2010a). It is the interaction of these three dimensions that generates the bias; in our illustration, this happens in a multiplicative way: degrees of freedom leave room for biases that materialise if there is both an editorial aversion to papers with non-significant effects and strong incentives for publication.
2. The Existing Empirical Evidence in Economics
journals in the last 40 years (e.g., Nikiforakis and Slonim, 2015). Accordingly, the field of experimental economics represents a positive benchmark for investigating the credibility of economics.
Let us first consider what we know about research priors: does it seem to be the case that ‘surprising results’ are necessary in order to publish in economics? Economics tends to be theory driven. In fact, young PhD students are immersed in the realm of formal (normative) theory much more than other disciplines. This is still true despite a reverse trend in recent years, especially in applied microeconomics, where structural analysis has become somewhat less popular. A movement in experimental economics toward structural work should also be noted (see Della Vignaet al., 2012, and the references therein). This focus on theory may have beneficial side effects for the reliability of empirical economics, since the benchmark predictions of standard economic theory serve as a protective firewall against excessively exploratory research. Hence, the predominance of formal economic theory should result in much experimental research going beyond exploration to theory testing, a feature that tends to increase priors in our model.
What does empirical evidence tell us about the degree to which economics hinges upon theory? Card et al. (2011) focused on a particular set of empirical studies, field experiments, and estimated that 68% of field experiments are purely exploratory, lacking any explicit theory.9The other evidence concerning priors that we are familiar with is the work of DeLong and Lang (1992), who examine major economics journals to find articles in which the central null hypotheses set forth by the authors was not rejected. Under their model, they estimated that noneof the unrejected nulls is true. Their main interpretation of this evidence
is that economics journals tend to publish null results only if the pre-study priors of a true association are particularly high.
What do we know about the power of empirical designs in economics? In economics there are limited domains where power analysis is discussed, and especially presented formally in papers (one of these exceptions is revealed preference tests: see the review in Andreoni and Harbaugh, 2005).10 Importantly, it is still possible to estimate power retrospectively by means of meta-analytic estimates (or, in general, assumptions about the actual effect size). Until now, there seems to have been very little relevant research in economics: the only analysis we are familiar with is Zhang and Ortman (2013), who estimate the post-hoc statistical power for the dictator-game experiments included in the meta-analysis by Engel (2011) and find median power equal to0.25. This (scarcity of) evidence should be juxtaposed with psychology and related disciplines such as marketing, which have a much deeper tradition of retrospective power analysis.11
Filling the power gap in economics, in an accompanying paper of this Features issue, Ioannidis et al. (forthcoming) uses 159 economic meta-analyses of 6,700 studies and over 64,000 estimates to assess statistical power. In particular, they find that across these literatures, the median of the median power in each literature is, at most, 18%. In addition, the median proportion of adequately powered studies (power ≥ 0.8) in a given research literature is no more than 10.5%.
Other key parameters include the degree of competition among research teams in economics and publication pressure in economics relative to other fields (in our model,ߦ). Unfortunately, we are not aware of any formal study addressing these questions. One would need to resort to anecdotal evidence for insights. On the one hand, the functioning of the economics knowledge system is characterised by long-run uncertainty about the intrinsic value of research and by a funnel-shaped publication system (e.g., Oswald, 2007). On the other hand, there has been a significant creation of new prestigious journals by major economic associations. In addition, many of the aforementioned features of the system are common to other competitive disciplines, such as bio-medical sciences (e.g., Young et al., 2008). Additional anecdotal evidence indicates that economics is not considered among the most difficult disciplines for advancing the academic ladder, especially in the US. Fresh economics PhDs compete for assistant professor jobs, whereas in the biomedical and natural sciences they need to pass through a series of post docs. In any event, we know very little on ߦ.
The field where evidence in economics is not lacking concerns pure publication bias. For instance, Doucouliagos and Stanley (2013) examine publication biases across different economic literatures and show how these biases depend on the degree of competition between schools of thought. This evidence (along with the interdisciplinary comparisons by Fanelli, 2010b), point toward a moderately high value ofߤfor economics, since there exists disproportionately many positive empirical results. But, notice that hard evidence – for example in the form of a study such as Franco et al. (2014), who utilise a unique preregistration pool to derive an estimate of publication bias – has not been provided yet in economics.
fraction of economists (about 4%) has committed a serious research crime (such as data falsification) at least once. Feld et al. (2012) report evidence consonant with the insights in List et al. (2001), and reveal that more than 30% of total researchers admit using strategies that would bias behaviour towards reporting positive results (selectively report of findings, stopping experimentation when finding desired results, etc.). These results point to large empirical degrees of freedom and the potential for research bias, although evidence for the publication pressure in economics relative to other disciplines is lacking.
3. Can we Trust Replications to Ameliorate the Credibility Problem?
We have already seen that the Bayesian model points to key parameters that affect the credibility of results: p-values, priors, theory-testing, power, researchers’ incentives, degrees of freedom, etc. Yet, unfortunately in economics we do not have enough rigorous evidence about these variables. Still, it might well be the case that the protective guardianship of replications ensures the reliability of received results.
Before moving to our framework, we should take care to address what is actually a replication. In our theoretical model, we employ the second notion of replication as defined in Levitt and List (2009): implementing an experiment under the same protocol as the original experiment to check whether similar results can be obtained using different subjects.12However, research bias is likely to affect original research from several angles. Since there should be no presumption that replication is impervious to bias, one can wonder if replication can achieve its role when it is afflicted by biases itself. This begs the need to
12To add more detail, in the empirical part we use the similar – but extended – definitions of direct and conceptual replications of Schmidt (2009), summarised by Makelet al. (2012):
In a direct replication, the new research team essentially seeks to duplicate the sampling and experimental procedures of the original research by following the same ‘experimental recipe’ provided in the methods section of the original publication […] In a conceptual replication, the original methods are not copied but rather purposefully altered to test the rigor of the underlying hypothesis. Whereas direct replication examines the authenticity of the original data, in conceptual replication, the replicator tests the construct and not the datum.
(Makelet al., 2012, p. 538) In this regard Schmitdt states: ‘Whereas a direct replication is able to producefacts,a conceptual replication may produceunderstanding’
model explicitly how new evidence helps us update our beliefs in the presence of potentially biased replication research.
When no research bias is at work, Moonesinghe et al. (2007) and Maniadis et al. (2014) show that a few replications are enough for our beliefs to converge to the truth. It is important to emphasise that in the background of this basic model there is publication bias.13 For their calculations it is assumed that there are at leastݎsuccessful replications out of݊ trials, meaning that the other(݊−ݎ)studies are potentially unpublished, and therefore we do not know if they are positive or negative. We want to work in an environment where there is no such implicit publication bias.
To establish this environment, we assume that it is known that there are exactly݊ ‘independent’ replications of each study, and all results from these replications are published. Of course, we are fully in agreement with the concept that publication bias afflicts replication studies, but we focus on inference that can be made in the presence of replication that is biased at the researcher level.
We illustrate our ideas in four models of replication. In the first, our benchmark model, only unbiased replication takes place. In the second, only biased replication exists, with a bias aligned with the original result (we call this an environment of ‘sympathetic replications’). According to the third model of ‘adversarial replication’, replication attempts are biased towards providing evidence opposing the original finding. The fourth, and final, model assumes that there are some unbiased, some sympathetic, and some adversarial replicating researchers. We are interested in examining how each of these replication models helps us to converge to the truth in terms of our posteriors. Does the existence of biases entail that replication can no longer serve its purpose? How does it depend on the environment?
Of course, ‘[t]he patterns of bias can be complex and may also depend on the timing of the research results and their relationship with previously published work’. (Pfeifferet al., 2011, p. 1). Hence, we will work with simplifying assumptions that will deliver tractable models that provide useful insights. We assume that there is an initial positive result having declared the existence of an association and that it is known that there is a fixed number݊of replication attempts. Consider the random variable ܺ, namely the number of successful replication studies,14distributed according to the Binomial distribution with probability of successand number of trials݊. The probability of findingݎsuccessful replications out of݊ trials is given by:
ܾ(ǡݎǡ݊)ൌ ܲݎ{ܺ ൌ ݎ}ൌ ቀ݊ݎቁ(ͳെ )ି.
The key question is: what is the Post-Study Probabilityሺܲܵܲ)of a given positive finding to be true after ݎsuccessful replications out of݊total replication studies? We are particularly interested in the updating of our beliefs due to replication, relative to the beliefs held after the initial study was published – which are captured by the priorsߨin our model.
3.1.Unbiased, Sympathetic and Adversarial Replications
Conditional on a true association (and given powerͳെ ߚሻ, the probability of observingݎ successes in݊replications isܲݎ{ܺ ൌ ݎ}ൌ ܾ(ͳെ ߚǡݎǡ݊)ൌ ቀ݊ݎቁ(ͳെ ߚ)ߚି. Conditional on a false association (and given significance level ߙሻ, this probability is ܲݎ{ܺ ൌ ݎ} = ܾ(ߙǡݎǡ݊)ൌ ቀ݊ݎቁ(ߙ)(ͳെ ߙ)ି. Accordingly, our posterior after all the evidence is:
ܲܵܲ = [௧௬௧௦௦௧௧௨ௗ௩௦௨௦௦௦௧௦]
[௧௬௩௦௨௦௦௦௧௦] = =ܾ(ͳെ ߚǡݎǡܾ݊(ͳെ ߚǡݎǡ݊)ߨ ܾ(ߙǡݎǡ݊)ߨ )(ͳെ ߨ). (4)
Recall thatߨis the probability of the association being true after the original (positive) result has been published.
Now, let us consider the possibility of researcher bias in the conduct of replications. First, a bias in favour of the original result may exist if the replication is made by research teams friendly to the original research team. In accordance with Ioannidis (2005), we assume that in each occasion where the replication would have been declared unsuccessful, it will be declared successful (meaning, positive), a fraction0 <ݒ≤ 1of the time, due to the bias. Now, what is the probability of the association being true and declared true inݎout of݊ replications? Conditional on the association being true, it will be declared true in a given replication study either because the study will not make a type-II error, or, if the study falls prey to type-II error, because of the biasݒ. Hence, the Bernoulli probability of each ‘success’ must now be given by the ‘sympathetic bias’ formula:(1 −ߚ) +ߚݒ.
Similarly, if the association is false, it will be declared true in a given replication study either because the study makes type-I error, or, if the study avoids type-I error, because of the biasݒ. Hence, the Bernoulli probability of each ‘success’ must now be given byߙ+
(1 −ߙ)ݒ. In other words, conditional on a true association there is a chanceܾ[(1 −ߚ) + ߚݒ,ݎ,݊]of declaringݎsuccessful replications out of݊total replications and conditional on false there is a chanceܾ[ߙ+ (1 −ߙ)ݒ,ݎ,݊]of declaringݎsuccesses out of݊replications. Accordingly, theܲܵܲin the presence of sympathetic replication biasݒbecomes:
ܲܵܲௌ= ܾ[(1 −ߚ) +ߚݒ,ܾݎ[(,݊1 −]ߨ+ߚ) +ܾ[ߙߚݒ+ (,ݎ1 −,݊]ߨߙ)ݒ,ݎ,݊](1 −ߨ). (5)
fraction߱ of the time. What is the probability of the association being true and declared true inݎout of݊replications? Conditional on the association being true, it will be declared true in a given replication study only if the study does not fall prey to type-II error, and at the same time it avoids the ‘adversarial bias’. Hence the Bernoulli probability of each ‘success’ must now be given by(1 −ߚ)(1 −߱). Similarly, if the association is false, it will be declared true in each replication study only if the study makes type-I error and simultaneously avoids the ‘adversarial bias’. Hence, the Bernoulli probability of each ‘success’ must now be given byߙ(1 −߱).
In other words, conditional on the association being true, there is a chanceܾ[(1 − ߚ)(1 −߱),ݎ,݊] of declaring ݎ successful replications out of ݊total replications, and conditional on a false association there is a chanceܾ[ߙ(1 −߱),ݎ,݊]of declaringݎsuccessful replications out of݊total replications. Accordingly, theܲܵܲin the case of adversarial bias becomes:
ܲܵܲ= ܾ[(1 −ߚ)(1 −ܾ߱[(),1 −ݎ,݊] ∙ߚ)ߨ(1 −+ܾ߱),[ߙݎ(1 −,݊] ∙߱ߨ),ݎ,݊] ∙(1 −ߨ). (6)
3.2.Heterogeneity across Replicating Teams
Now, let us assume that there is heterogeneity across replicating teams. In particular, a fraction0 < ߮< 1is sympathetic (with biasݒas above), a fraction0 <߰ < 1is adversarial (with bias߱ as above), and the remaining fraction(1 −߮−߰)is neutral. What should the academic community infer on the basis of observingݎsuccessful replications out of݊total replications?
Bernoulli experiment with probability of success߯ଵ≡ ߮∙[(1 −ߚ) +ߚݒ] +߰∙[(1 −ߚ)(1 − ߱)]+(1 −߮−߰) ∙ (1 −ߚ).15Now assume the association is false. Then, the probability of a given replication being successful (meaning, declaring a positive result) is the weighted sum of the probabilities of positive results for each type of researcher. Accordingly, each replication is a Bernoulli experiment with probability of success߯ଶ ≡߮∙[ߙ+ (1 −ߙ)ݒ] + ߰∙[ߙ(1 −߱)] + (1 −߮−߰) ∙ߙ.
Therefore, conditional on a true association there is a chanceܾ(߯ଵ,ݎ,݊)of declaringݎ successful replications out of݊total replications,and conditional on a false association there is a chance ܾ(߯ଶ,ݎ,݊) of declaring ݎsuccessful replications out of ݊total replications. Finally, theܲܵܲin the heterogeneous case becomes:
ܲܵܲு= ܾ(߯ ܾ(߯ଵ,ݎ,݊) ∙ߨ
ଵ,ݎ,݊) ∙ߨ+ܾ(߯ଶ,ݎ,݊)∙(1 −ߨ). (7)
3.3Updating on the Basis of Replications
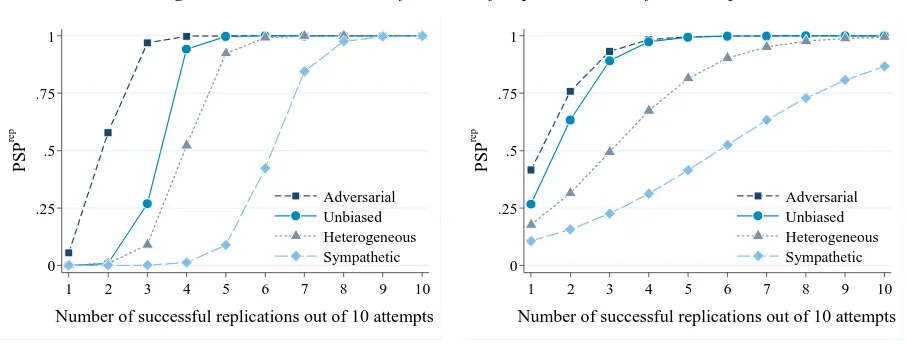
Figure 1 illustrates thePSP as a function of the number of successful replications, when the total number of replications is fixed to10. That is, we follow our model and plot thePSPfor a number of successful replications out of 10 (denoted PSPrep) in Figure 1, assuming two different power levels, and ߙ= 0.05,݊= 10,ݒ= 0.3,߱ = 0.4,ߨ= 0.5, ߮ = 0.33,߰ =
0.33. We believe that the specification of Figure 1 is realistic with respect to the priorߨ, because as Ioannidis (2005) and Maniadiset al. (2014) have shown, it is not unreasonable to expect that after the initial study our beliefs for the truthfulness of the association remain small.
Insights from Figure 1 teach a few useful lessons. First, by comparing the left and right panels, we see the importance of power: regardless of the chosen replication model,
power importantly influences the PSP. We return to this point below. Second, in disciplines where there is a strong element of competition we might generally expect replications to be adversarial. Hence, our updating on the basis of a fixed number of replications should be larger, relative to a discipline with neutral researchers, and much larger than in disciplines with sympathetic replications.
[image:21.595.75.528.498.670.2]Accordingly, in disciplines where there is an aversion to contradicting the authors of initial studies we should feel less secure in using the standard Bayesian model when updating – the role of replications for establishing convergence of beliefs to the truth is less powerful. Using similar logic, this means that in a ‘sympathetic replicators’ environment more successful replications are needed in order to establish the result. For instance, if we wish to achieve ܲܵܲ of at least 80%, the left panel of Figure 1 shows that seven successful replications are required, whereas only three replications are enough in the ‘adversarial replicators’ regime. Figure 1 also importantly highlights the need to establish the regime in which replication takes place, since different replication regimes entail very different inference from a given pattern of replication results.
Figure 1.ܲܵܲas a Function of Number of Replications out of 10 Attempts
a.(1− β) = 0.7 b.(1− β) = 0.2
Note: For the calculations, equations 1 and 5-7 were used while assuming thatߙ= 0.05,݊= 10,ݒ= 0.3,߱= 0.4,ߨ= 0.5,
߮= 0.33,߰= 0.33.
0 .25 .5 .75 1 P S P re p
1 2 3 4 5 6 7 8 9 10
Number of successful replications out of 10 attempts
Adversarial Unbiased Heterogeneous Sympathetic 0 .25 .5 .75 1 P S P re p
1 2 3 4 5 6 7 8 9 10
Number of successful replications out of 10 attempts
Perhaps surprisingly, our model predicts that (for a large range of parameters) conditional on a set of mixed replication results, disciplines where studies are known to be more powerful can be associated with lowerPSP. To illustrate, let us consider the derivatives of theܲܵܲin each regime. For the unbiased regime theܲܵܲis decreasing in power(1 −ߚ) as long asߚ< [(݊−ݎ)⁄ ]݊ , for the sympathetic replication regime the same holds ifߚ<
[(݊−ݎ)⁄݊(1 −ߥ)] and for the adversarial regime it holds as long as ߚ<
[݊(1 −߱) −ݎ] [⁄ ݊(1 −߱)]. This non-monotonicity implies that in an environment of low power (economics is one such environment, according to the results of Ioannidis et al., forthcoming) low success rates of replications may often be less condemning (in terms of the PSP) relative to a high-power environment.
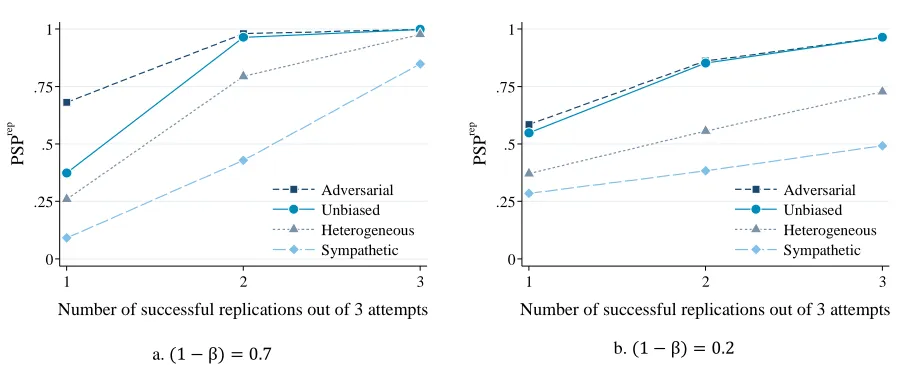
The intuition for this paradox is that more power is always beneficial ex ante, in order to increase the chances of obtaining a positive result. However, at the ex-post stage it is often the case that a given set of replication results is more likely to have originated from a true association if the power is low, rather than high. The reason is simple: in our model we condition on a number of replications that include successes as well as failures. If power is high, numerous failures are very unlikely if the association is true, because the probability of type-II error is low. If the evidence is mixed, it is possible that disciplines with low average power feel more comfortable for the truthfulness of their results. Illustrating this point, the right panel of Figure 1 shows that when (1-ߚ) = 0.2theܲܵܲfor low levels of replication is higher than in the high-power environment (left panel) of Figure 1. In particular, in the ‘unbiased’ and ‘adversarial’ regimes, three replications are enough to establish aܲܵܲof at least 0.8.
of the authors of the initial study. Given these presumed incentives, it is worth exploring whether the policies of top economic journals regarding the availability of data and complementary material are enough to encourage replication studies. It is even possible that actual replications may not be declared as such, especially those that contradict original findings. These issues require systematic study and we shall now make a first step in that direction, presenting a pilot study that attempts to quantitatively assess replication.16
4. A Pilot Study of Replication in Experimental Economics
We have seen how in the absence of relevant evidence about the credibility of initial findings, the role of replication becomes critical. Replication is the cornerstone of the scientific method, and we have shown that it should be considered a safeguard against the false positives problem even if it is practiced with biases, and even if our studies have low power. We now examine empirically the degree to which replication is playing its role for the subfield of experimental economics. We use a large sample of papers from the most prestigious economics journals to assess the feasibility of meta-research approaches in providing an overview of the frequency with which replication has been conducted recently in experimental economics. This will help to inform us about the following: on the basis of how many replications do we update our beliefs about initial findings?
As emphasised earlier, we focus on studies of causal analyses in economics with relatively simple hypotheses, typically based on reduced forms (standard experimental techniques). This provides a benchmark to examine replicability, since many other fields in economics employ complex structural analyses which make them difficult to replicate using different data sets, especially since field evidence is constrained by the data availability.
From experiments, experts would argue that they understand the robustness of phenomena, such as preference reversal over a pair of alternatives conditional on the elicitation method, giving in ultimatum games, the decline over time of cooperation in public good games, and the convergence to the equilibrium in competitive markets with classic double auctions design, to mention a few examples. What does a quantitative meta-research study have to offer? First, often expert opinion might not be enough, as evidenced by the fact that in Camerer et al. (2016)’s study, the predictive accuracy of experts about replicability did not outperform objective indices such as sample size and p-value. Moreover, Della Vigna and Pope (2016) find that several dimensions of expertise such as academic rank, citations and even local expertise do not improve predictive forecasting performance for a series of experimental treatments (on the other hand, confidence in one’s forecast is moderately correlated with performance). Second, systematic meta-research studies allow the examination of trends in the overall literature and facilitate quantification of critical variables. This approach is complementary to expert opinion and can yield new insights, especially in the current era characterised by enormous, fast-growing, scientific production and increasing specialization. For instance, our pilot study finds that very few experiments in the discipline are declared as replications, a practice that may make it difficult for obtaining unambiguous meta-analytic summaries for certain effects.
There are several additional research questions that we aim to address. What fraction of experimental economic papers in each journal, and in the whole literature, are replications? How does experimental economics fare relative to other fields, such as experimental psychology?17 It has also been argued that many implicit replications take place in experimental economics, in the form of ‘benchmark studies’ that emulate prior designs and
serve as controls to compare new treatments. To what extent is the existence of these implicit replications true, and how do reporting practices in the discipline affect the meta-researcher’s capacity to measure replicability? In addition, how does the fraction and number of replications move over time in the experimental economics literature? Do other parameters such as authorship overlap, etc., seem to affect the rate of success of replications?
We used EBSCOhost to search into EconLit database (searching in EconLit via EBSCOhost appears more easily manageable relatively to accessing EconLit directly). We restricted our searches to the top 150 journals in economics according to the Eigenfactor Score18of ‘ISI Web of Knowledge Journal Citation Reports 2013 Social Science Edition (JCR for short).19We first retrieved all documents published in English in the years 1975-2014 in the identified top 150 journals in economics. Looking for experimental studies, we restricted our search among the papers that used the root ‘experiment*’ anywhere in the article. We then focused our attention on the subset of papers that used both the root ‘experiment*’ and ‘replicat*’ in order to analyse whether they represented actual replications of experimental studies. Because the use of the root ‘replicat*’ is neither necessary nor sufficient for a paper to contain a replication, we searched for replications in the totality of experimental papers.20
To this end, we also considered papers that used the root ‘experiment*’ but not the root ‘replicat*’. First, we wanted to learn how many of those papers reported actual experiments. Hence, we first randomly selected a stratified21sample of 2001 of these papers
18The definition from the JCR interface states: ‘TheEigenfactorScore calculation is based on the number of times articles from the journal published in the past five years have been cited in the JCR year, but it also considers which journals have contributed these citations so that highly cited journals will influence the network more than lesser cited journals. References from one article in a journal to another article from the same journal are removed, so thatEigenfactorScores are not influenced by journal self-citation’.
19A complete list of the top 150 journals can be obtained from JCR 2013 Social Science Edition (as described in the Online Appendix). According to Eigenfactor Score in the ‘JCR 2013 Social Science Edition’ theAmerican Economic Reviewis ranked 1st, while theNational
Tax Journalis ranked 150th.
20As noted above, many papers contain only one ‘arm’ of a given treatment that appeared in an earlier study. These studies were classified as ‘quasi replications’. Such studies do not add to our knowledge in the same manner as basic replications since there is no actual ‘treatment effect’ to compare with the original study. We choose to measure the quasi-replications because they are often invoked as salutary practices, but their existence may give a potentially illusory sense of reproducibility in the discipline.
and examined whether they constituted actual experimental studies. In the next stage of our analysis, in order to verify the existence of ‘implicit’ replication studies,22we carefully went through 500 randomly selected studies among those that we categorised as experimental to determine which studies constitute replications.
In the final part of our analysis, we went through all of the papers that we categorised as replications (either having the root ‘replicat*’ or not) to categorise important variables that may affect the degree to which replication studies tend to confirm the original results (we call this ‘success rate’). Some of these variables include direct replication (vs. conceptual), number of times the original study has been cited, overlap in the authorship of the original and the replication, the replication being published in the same journal as the original study, and others.23
In a recent paper, Duvendack et al. (2015) review all replications in economics and among them are a few experimental studies. However, since their search of replications is not systematic and their main focus is not on experimental economics, their evidence does not inform us greatly about the frequency of replications in the experimental economic literature. This is one of the variables that we are quite interested in determining.
4.1.Results
In total, 206,522 papers were retrieved, after searching for all papers in English in the top 150 journals according to theEigenfactor Scoreof JCR. Among them, 8,886 papers contained the
22Assuming that replication studies may score lower in terms of novelty in the eyes of other scholars, it could be possible that authors may refrain from using the root ‘replicat*’ even when implementing a replication. By contrast, we do not anticipate any reasons that may make authors of an experimental study avoid the use of the root ‘experiment*’; hence, if authors of experimental studies do not use the root ‘experiment*’ we expect that this would have happened for causes orthogonal to our research questions.
term root ‘experiment’, with 1,158 papers containing both the roots ‘experiment*’ and ‘replicat*’. Examining studies using both the roots ‘experiment*’ and ‘replicat*’, we found that 654 out of 1,158 papers contained actual experiments. In order to estimate the representation of experiments in the literature as a whole, and to perform our robustness check, we first randomly sampled (in a stratified fashion) 2,001 papers from the 7,754 papers using the root ‘experiment*’, but not ‘replicat*’, and examined them in detail. Only 1,037 of the 2,001 of the sampled papers were found to be actual experiments (see the online appendix for the exact way in which we completed this task).
Second, we estimated the number of experimental papers that are actual replications, among those that contained the root ‘replicat*’ and among those that did not. Among the former 654 papers, 99 turned out to be actual replications. In order to examine the latter, we drew randomly 500 papers among the 1,037 experimental papers that did not contain the root ‘replicat*’. Among those, only 12 were replication papers. Note that in our sample there are 111 replications of which 26 are quasi-replications, which we have excluded from the current analysis.
In the end, we estimated the fraction of total papers in economics that contain new experimental data to be 2.3%.24The fraction of replication studies over the total number of experimental studies is 4.2%,25 of a similar magnitude as observed in marketing and psychology (Evanschitzkyet al., 2007; Makelet al., 2012). An interesting novel aspect of our study design relative to Makel et al. (2012) is the fact that in our estimation we also try to account for ‘implicit replication’ studies that do not declare themselves as such.
Concerning the replication results themselves, an interesting insight is that we found a ‘success rate’, based on 85 replications, of 42.3%. This means that roughly 40% of papers 24Given that only1,037/2,001of the sampled papers are actual experiments, we estimate that4,018 = (1,037/2,001 ∗ 7,754)of the
7,754papers using the root “experiment*”, but not “replicat*”, are actual experiments. Thus, the fraction of total papers in economics that contain new experimental data is estimated to be2.3% = [(4,018 + 654)/206,522]∗ 100.
25The fraction of actualreplication papers out of the sample of 500 experimental papers not using the root “replicat*” is0.024 =
(12/500). Thus, the fraction of replication studies over the total number of experimental studies (which we estimate equal to4,672 =
that were published as replication studies successfully replicated another experiment. This is somewhat higher than the outcome of the recent large-scale replication initiative from psychology (Open Science Initiative, 2015) and Duvendacket al. (2015), which both found a success rate of about a third, while, also in psychology, Makelet al. (2012) found a very high success rate of 73%.
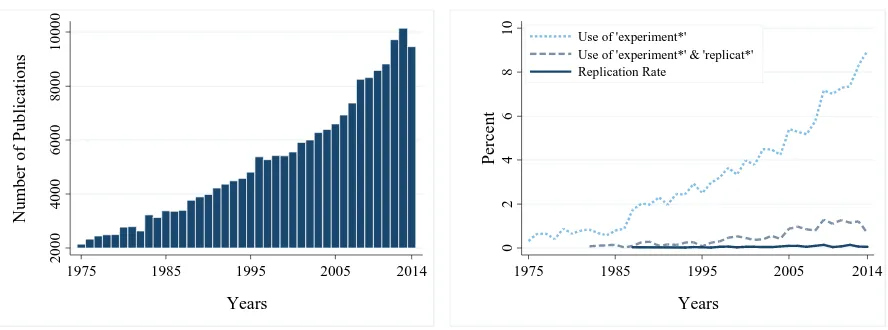
Figure 2. Publications and Replication rates in the top 150 journal in Economics according to the Eigenfactor Score
a. Number of publications in top economics journal b. Use of the roots ‘experiment*’ and ‘replicat*’ along
with replication rates in top economics journal
Note: In panel a., the bars represent the total number of articles published yearly in the top 150 economic journals. In panel b., the dotted line reports the percentage of those publications that used the term “experiment*’; the dashed line
represents the percentage of those publications that used both the term ‘experiment*’ and the term ‘replicat*’. The solid line
describes the total fraction of papers that contain experimental replications relatively to the total yearly publications in the
top 150 economic journals.
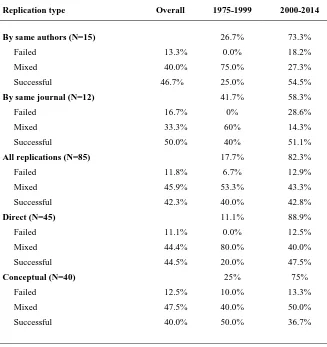
Figure 2 illustrates the basic trends of economic research over time in our data. The fraction of papers that use the root ‘experiment*’ increases steadily through time (recall that we estimated that about half of those are actual experiments). In addition, the use of the root ‘replicat*’ seems also to increase through time. Notwithstanding, the replication rate appears to be low and fairly stable over time. Table 1 contains detailed information from our set of 85 replications. As can be seen from this descriptive analysis, there is a much larger number of replications in the last 15 years, and the success rate went up slightly. This certainly represents a positive direction for empirical research in terms of replications.
2 0 0 0 4 0 0 0 6 0 0 0 8 0 0 0 1 0 0 0 0 N u m b er o f P u b li ca ti o n s
1975 1985 1995 2005 2014
Years 0 2 4 6 8 1 0 P er ce n t
1975 1985 1995 2005 2014
Years
Use of 'experiment*'
Table 1. Success Rates in Detail
Replication type Overall 1975-1999 2000-2014
By same authors (N=15) 26.7% 73.3%
Failed 13.3% 0.0% 18.2%
Mixed 40.0% 75.0% 27.3%
Successful 46.7% 25.0% 54.5%
By same journal (N=12) 41.7% 58.3%
Failed 16.7% 0% 28.6%
Mixed 33.3% 60% 14.3%
Successful 50.0% 40% 51.1%
All replications (N=85) 17.7% 82.3%
Failed 11.8% 6.7% 12.9%
Mixed 45.9% 53.3% 43.3%
Successful 42.3% 40.0% 42.8%
Direct (N=45) 11.1% 88.9%
Failed 11.1% 0.0% 12.5%
Mixed 44.4% 80.0% 40.0%
Successful 44.5% 20.0% 47.5%
Conceptual (N=40) 25% 75%
Failed 12.5% 10.0% 13.3%
Mixed 47.5% 40.0% 50.0%
Successful 40.0% 50.0% 36.7%
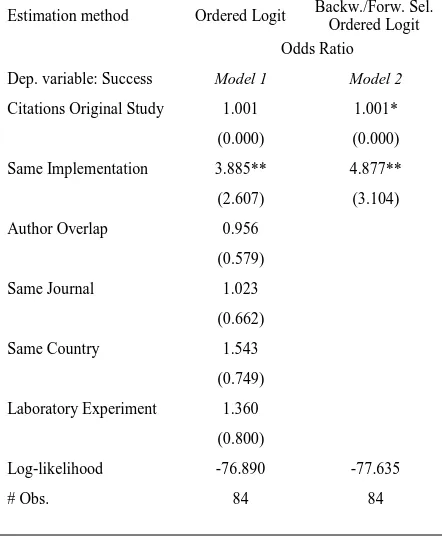
To delve more deeply into the determinants of replication success we employ ordered logit estimations. Our dependent variable is ‘Success’, which assumes three values: 2 (replication success), 1 (mixed result), or 0 (replication failure). As explanatory variables, we use the number of citations of the original study (i.e., ‘Citation Original Study’) together with dummy variables for identical implementation protocol (i.e., Same Implementation), for overlapping research teams (i.e., Author Overlap), for the replication having been published in the same journal as the original study (i.e., Same Journal), for running the replication in the same country as the original study and for laboratory experiments (i.e., Laboratory Experiment).
when the analyst departs from the protocol used in the original study. Other possible determinants of replication success in our model do not appear to have predictive power at conventional levels.
Table 2. Ordered Logit Regressions of Replication Success Estimation method Ordered Logit Backw./Forw. Sel.
Ordered Logit Odds Ratio Dep. variable: Success Model 1 Model 2
Citations Original Study 1.001 1.001* (0.000) (0.000) Same Implementation 3.885** 4.877** (2.607) (3.104) Author Overlap 0.956
(0.579) Same Journal 1.023
(0.662) Same Country 1.543
(0.749) Laboratory Experiment 1.360
(0.800)
Log-likelihood -76.890 -77.635
# Obs. 84 84
Notes:Successtakes value 2 for a successful replication, 1 for a replication with mixed results, and 0 for a failed replication.Citations Original Studies
counts the number of citations of the original study being replicated (median=106; range=1–4691).Same Implementationtakes the value 1 if the implementation protocol of the original study and the replication are the same and 0 otherwise.Author Overlaphas value 1 if the original research team has overlapping members with the replication team, and 0 otherwise.
Same Journaltakes the value 1 if both the original and replication studies are published in the same journal, and 0 otherwise.Same Countrytakes the value 1 if both the original and replication studies were implemented in the same country (0 otherwise).Laboratory Experimentreflects the nature of the experiment and assumes value 1 for ‘conventional lab’, 0 for ‘field’ experiments. Standard errors are given in parentheses.
** Significant at the 5 percent level. * Significant at the 10 percent level.
explanatory variables may either be due to a non-existing link between the dependent variable and a given independent variable, but it might also result from the fact that in our econometric analysis there are only 84 observations27and our data are noisy. Given that the majority of the dependent variables entered in Model 1 do not impact significantly on the chances of success, we implemented both a backward and a forward selection procedure to identify the more parsimonious model.
The two procedures lead to the same model, namely Model 2 in Table 2. This model contains only Citations Original Study and Same Implementation as explanatory variables. The former variable appears now significant at p < 0.10, but the magnitude of its effect on the odds of success is very small. The coefficient of the variableSame Implementationappears to slightly increase in the specification of Model 2, which does not present an important worsening of the log-likelihood.
In summary, the only predictor of replication success that emerges from the econometric analysis of our limited data set is Same Implementation. However, despite the fact that citations of the original study do not explain the odds of success of a replication attempt, it may still be interesting to examine the correlations between citations of replication studies, citations of the original studies, and replication success: after all, many view citations as the primary currency for the advancement of scholars’ careers. By testing for pairwise correlation, it turns out that citations of replication studies are positively correlated with those of the original study (correlation = 0.3215; p=0.003) and with the success of the replication attempt (correlation = 0.2487; p=0.022).
5. A Tentative Meta-Research Assessment of Experimental Economics
culture in research reporting, meta-research endeavours suffer from a great degree of subjectivity. Authors are hesitant to declare their study a replication and more so to indicate the replication type. It is very difficult for the meta-researcher to gauge information beyond authors’ reports. Accordingly, the results of our pilot study are tentative and higher quality data will come from conceptual developments and more informative reporting. The overall lessons are not very encouraging in terms of the easy transferability of meta-research methods. Costly effort shall be needed in terms of changing reporting practices in the discipline. An assessment of the opportunity-cost of those changes is very much needed for economics. With this regard, a pivotal role may be played by professional associations, funding agencies and scientific journals in assessing and, if beneficial, in promoting possible changes.28
Bearing in mind the above considerations, what can we say about the experimental economics literature on the basis of our model and pilot empirical results? Unlike clinical trials in medicine, where funding agencies, pharmaceutical companies, and other bodies support independent exact replications, our empirical study tentatively indicates that a benchmark of10replications might be difficult to achieve in experimental economics. In particular, about 4.2 percent of the published experimental papers in economics appear to contain replications. This is somewhat larger than in psychology and marketing (Evanschitzkyet al., 2007; Makelet al., 2012), but of similar order of magnitude.
Accordingly, an average of10replications in today’s research publishing market is probably too optimistic. Although the number of replications has increased substantially in the last fifteen years, with the incentives for replication today we can think of three total replications as a very optimistic scenario. Figure 3 illustrates this case for the same set of parameters that we examined earlier. As can be seen, even two successful replications out of
three are able to establish a very goodܲܵܲin our environment, provided that we are not in the ‘sympathetic replication’ regime. Clearly, additional evidence is needed in order to pinpoint the set of parameters with greater accuracy.
[image:33.595.76.528.418.603.2]In particular, a key question is whether we can use the empirical evidence to infer what kind of environment we currently reside within experimental economics. This is beyond the scope of our study; however, we argue that survey tools can be devised to elicit the perception of experimental economists concerning the preference of editors for replication studies. In addition, it is possible that by comparing the results of the pre-registered replications with the results of other replication studies we could more fully understand the exact regime in place. Discrepancies may be interpreted as evidence of bias. Since as we have shown the strength of bias depends on the incentives for finding certain types of results, this can inform the possible direction of bias for experimental economists.
Figure 3.ܲܵܲas a Function of Number of Replications out of 3 Attempts
a.(1− β) = 0.7 b.(1− β) = 0.2
Note: For the calculations, equations 1 and 5-7 were used while assuming thatߙ= 0.05,݊= 3,ݒ= 0.3,߱= 0.4,ߨ= 0.5,
߮= 0.33,߰= 0.33.
6. Conclusions
In this article, we illustrated the approach of incorporating meta-research tools in examining the credibility of economics research, both theoretically and empirically, by focusing on experimental economics. Our results about study reproducibility suggest that not
0 .25 .5 .75 1 P S P re p
1 2 3
Number of successful replications out of 3 attempts
Adversarial Unbiased Heterogeneous Sympathetic 0 .25 .5 .75 1 P S P re p
1 2 3
Number of successful replications out of 3 attempts
enough information can be inferred about the credibility of our discipline on the basis of existing evidence, and that replication should not be assumed to automatically work. In the current context of the confidence crisis, economists should develop an awareness of the dangers involved and foster institutions, incentives, and practices that prevent a confidence drift or even strengthen the credibility of economic science. It is now time for economists to understand where we stand, and where we should go in terms of the reliability of our accumulated knowledge.
Increasingly, economists have turned to the experimental model of the physical sciences as a method to understand human behaviour. Much of this research has taken the form of laboratory experiments in which volunteers enter a research lab to make decisions in a controlled environment. Over the past few decades, economists have increasingly made use of field experiments to explore economic phenomena. Whether experimenting in the lab or field, important open questions revolve around optimal experimentation and inference drawn from the experiments. Accordingly, the degree to which we trust that experimental results are credible is of particular import.
Moreover, other fields have accumulated enough evidence about these issues, and for them the challenge appears to be to correct institutional incentives by designing appropriate rules (Noseket al., 2012). In fact, proposals for changing the rules of the game have attracted great attention in several scientific disciplines (e.g., Simmons et al., 2011; Landis et al., 2012; Fanelli, 2013; Miguel et al., 2014). Yet, the study of behavioural responses to incentives provided by institutions is beyond the scope of these afflicted disciplines, and therefore the proposed rule changes are not accompanied by rigorous evaluation. This generates a clear and important role for economics to examine the trade-offs and interdependencies of behaviour. We therefore call for a more central role of theoretical and empirical mechanism design in attacking this potentially severe problem in modern science.
In this Features issue, Di Tillio et al. (forthcoming) illustrate the power of economic theory by showing how strategic choice of the characteristics of an experimental subject can lead to biased inference. Importantly, economic theory does not only offer a diagnosis, but it ‘dissects the patient’ showing what exact types of interventions are likely to work in a given environment. This is fundamentally important before evaluating proposals for reforming science. As Ioannidis (2012) has forcefully argued, rigorous evidence is required (including experimental studies) in order to assess reform practices in science and to avoiding ending up in a worse state of affairs.
References
Alempaki, D, Canic, E., Matthews, W., Mullett, T., Stewart, N., Starmer, C. and Tufano, F. (2016). ‘Examining how utility and weighting functions get their shapes: A multi-level, quasi-adversarial, replication’, Working Paper, University of Nottingham.
Andreoni, J. and Harbaugh, W. (2005). ‘Power indices for revealed preference tests’, Working Paper, Social Systems Research Institute, University of Wisconsin.
Angrist, J. and Pischke, J.S. (2010). ‘The credibility revolution in empirical economics: How netter research design is taking the con out of econometrics’, Journal of Economic Perspectives, vol. 24(2), pp. 3-30.
Babcock, L. and Loewenstein, G. (1997). ‘Explaining bargaining impasse: The role of self-serving biases’,Journal of Economic Perspectives, vol. 11(1), pp. 109-126.
Bakker, M., van Dijk, A. and Wicherts, J.M. (2012). ‘The rules of the game called psychological science’,Perspectives on Psychological Science, vol. 7(6), pp. 543-554. Bettis, R.A. (2012). ‘The search for asterisks: compromised statistical tests and flawed
theories’,Strategic Management Journal, vol. 33(1), pp. 108-113.
Brodeur, A., Lé, M., Sangnier, M. and Zylberberg, Y. (2016). ‘Star wars: The empirics strike back’,American Economic Journal: Applied Economics, vol. 8(1), pp. 1-32.
Camerer, C.F., Dreber, A., Forsell, E., Ho, T.-H., Huber, J., Johannesson, M., Kirchler, M., Almenberg, J., Altmejd, A., Chan, T., Heikensten, E., Holzmeister, F., Imai, T., Isaksson, S., Nave, G., Pfeiffer, T., Razen, M. and Wu, H. (2016). ‘Evaluating replicability of laboratory experiments in economics’,Science, vol. 351(6280), pp. 1433-1436.
Card, D., Della Vigna, S. and Malmendier, U. (2011). ‘The role of theory in field experiments’,Journal of Economic Perspectives, vol. 25(3), pp. 39-62.
Cohen, J. (1962). ‘The statistical power of abnormal-social psychological research: A review’, Journal of Abnormal and Social Psychology, vol. 65(3), pp. 145-153.
Dawson, E., Gilovich, T. and Regan, D.T. (2002). ‘Motivated reasoning and performance on the Wason Selection Task’, Personality and Social Psychology Bulletin, vol. 28(10), pp. 1379-1387.
Della Vigna, S., List, J.A. and Malmendier, U. (2012). ‘Testing for
altruism and social pressure in charitable giving’,Quarterly Journal of Economics,
vol.127(1), pp. 1-56.
DeLong, J.B. and Lang, K. (1992). ‘Are all economic hypotheses false?’,Journal of Political Economy, vol. 100(6), pp. 1257-1272.
Di Tillio, A., Ottaviani, M. and Sorensen, P.N. (forthcoming). ‘Persuasion bias in science: can economics help?’Economic Journal.
Doucouliagos, C. and Stanley, T.D. (2013). ‘Are all economic facts greatly exaggerated? Theory competition and selectivity’,Journal of Economic Surveys, vol. 27(2), pp. 316-339. Duflo, E. (2006). ‘Field experiments in development economics’, in (R. Blundell, W.K.
Newey and T. Persson, eds.), Advances in Economics and Econometrics Theory and Applications, Ninth World Congress, vol. 2, pp. 322-348, Cambridge: Cambridge University Press.
Duvendack, M., Palmer-Jones, R.W. and Reed, W.R. (2015). ‘Replications in economics: A progress report’,Econ Journal Watch, vol. 12(2), pp. 164-191.
Engel, C. (2011). ‘Dictator games: a meta study’,Experimental Economics, vol. 14(4), pp. 583-610.
Evanschitzky, H., Baumgarth, C., Hubbard, R. and Armstrong, J.S. (2007). ‘Replication research’s disturbing trend’,Journal of Business Research, vol. 60(4), pp. 411-415.
Fanelli, D. (2010). ‘Do pressures to publish increase scientists’ bias? An empirical support from US states data’,PLoS ONE, vol. 5(4), pp. 1-7.
Fanelli, D. (2010). ‘‘Positive’ results increase down the hierarchy of the sciences’, PLoS ONE, vol. 5(3), e10068.
Fanelli, D. (2013). ‘Redefine misconduct as distorted reporting’, Nature, vol. 494(7436), p. 149.
Feld, L.P., Necker, S. and Frey, B.S. (2012). ‘Scientific misbehaviour in economics-evidence from Europe’, Working Paper, Walter-Euken Institute and University of Freiburg.
Franco, A., Malhotra, N. and Simonovits, G. (2014) ‘Publication bias in the social sciences: Unlocking the file drawer’,Science, vol. 345(6203), pp. 1502-1505.
Gilbert, D.T., King, G., Pettigrew, S. and Wilson, T.D. (2016). ‘Comment on ‘Estimating the reproducibility of psychological science’’,Science, vol. 351(6277), pp. 1037a-1037b. Goodman, S.N., Fanelli, D. and Ioannidis, J.P.A. (2016). ‘What does research reproducibility
mean?’Science Translational Medicine, vol. 8(341), 341ps12, pp. 1-6.
Harrison, G.W. and List, J.A. (2004). ‘Field experiments’, Journal of Economic Literature, vol. 42(4), pp. 1009-1055.