Joint Special Interest Group meeting between euspen and ASPE
Dimensional Accuracy and Surface Finish in Additive Manufacturing
,
KU Leuven, BE, October 2017
www.euspen.euOptimisation of surface topography characterisation for metal additive
manufacturing using coherence scanning interferometry
Carlos A. Gómez
1, Rong Su
1, Adam Thompson
1, Jack DiSciacca
2, Simon Lawes
1and Richard K. Leach
11University of Nottingham, UK
2Zygo Corporation, USA
Abstract
The surface topography of metal additive manufactured (AM) parts can be challenging to measure due to the presence of complex features, such as high slopes, step like recesses and protuberances, and local variations in reflectance. Recent innovations in coherence scanning interferometry (CSI) technology, such as high dynamic range of exposure and adjustable data acquisition rates for noise reduction, have augmented the baseline sensitivity of a measurement. This enhanced sensitivity expands the capability of CSI instruments to measure surface textures with high slopes or low reflectance, making CSI a potentially valuable tool for process development and quality control of metal AM. This study presents an empirical sensitivity analysis of a CSI system for the top and side surfaces of metal AM parts made from different materials (Ti-6Al-4V and Al-Si-10Mg) and processes (laser powder bed fusion (LPBF) and electron beam powder bed fusion (EBPBF)). The aim of this work is to demonstrate the feasibility of using CSI for characterisation of metal AM surfaces, and to evaluate the effectiveness of relevant CSI measurement settings. Topographic measurements are described through the use of ISO 25178-2 areal surface texture parameters Sq and Sdq and are analysed for data coverage, measurement time and area. The results show that the CSI technique can provide surface topography measurements for metal AM surfaces with a wide range of surface features. Finally, recommendations for optimisation of future measurements on metal AM surfaces using CSI are provided.
Coherence scanning interferometry, metal additive manufacturing, surface topography, metrology, roughness
1. Introduction
High-performance engineering and biomedical materials, including titanium and aluminium alloys are suitable for AM production [1, 2]. Amongst metal AM processes, powder bed fusion (PBF) has been the process with the greatest economic impact, and is the subject of much research [3]. The two most common PBF processes are laser PBF (LPBF) and electron beam PBF (EBPBF). LPBF is a process in which a laser is rastered over the surface of a bed of fine powder, in an inert gas environment, causing selected areas to fuse. By depositing and fusing successive layers, complex three-dimensional parts can be formed. EBPBF is based on the same principles as LPBF, but the source is an electron beam rather than a laser, and the chamber is held under vacuum [1, 2].
A current limitation of these AM techniques is the poor quality of dimensional tolerance, surface texture and surface integrity when compared to subtractively manufactured components [1 3], caused by the thermal distortions of a highly energetic process and by the irregularity of partially melted particles adhered to the part surface [4, 5]. PBF has proven to be a complex and difficult process to control [2], but it has been observed that key process conditions may be identifiable from the specific surface features that they produce [1]. As such, there is a clear drive to achieve fast and reliable topographic measurement of metal AM surfaces. Both LPBF and EBPBF surfaces present significant challenges for any measurement technique: high feature density, high spatial frequency bandwidth, high surface slopes, varying surface texture and reflectivity, frequent discontinuities and re-entrant features.
A number of technologies have recently gained traction as methods of areal topography measurement, most notably using optical techniques [6]. Measuring instruments based on optical imaging are significantly faster than stylus instruments that require mechanical raster scanning to cover a surface area. While other technologies exist, optical methods currently gaining industrial acceptance include confocal microscopy [7, 8], coherence scanning interferometry [9-11] and focus variation microscopy [12, 13]. Height map data acquired using these systems can be used to calculate areal surface texture parameters (e.g. Sa, Sq) [14, 15] that are considered to be a more complete descriptions of surface structure than the analogous line profile parameters (e.g. Ra, Rq) [16, 17].
Recent innovations in CSI technology have increased the baseline sensitivity of a measurement. This improved sensitivity increases the capability of CSI instruments to measure surface features with high slopes or low reflectance [19], making CSI a potentially valuable tool for process development and quality control of metal AM parts. The objectives of this study are to demonstrate the feasibility of using CSI for the measurement of metal AM surfaces, to evaluate the effectiveness of relevant and novel CSI measurement settings on these surfaces, and to provide recommendations for optimisation of future measurements on metal AM surfaces using CSI.
2. Relevant measurement settings and functions in CSI
With recent advances, CSI now allows for an improved SNR and measurement accuracy for rough surfaces [20, 21]. Major improvements include the development of sophisticated fringe analysis methods, and the possibility of performing a measurement with high dynamic range (HDR) lighting levels and control of the data acquisition bandwidth. The effects of these measurement settings are investigated, as well as the effect of spectral filtering of the broadband source.
2.1. Topography reconstruction method
In CSI, surface topography is derived from the interference fringes that are observed as the objective is scanned in the direction of surface heights. The CSI signal for each pixel appears qualitatively as interference fringes modulated by a coherence envelope corresponding to the spectrally-broadband, extended illumination [22]. The position of the envelope function provides a first estimate of height and a determination of the integer fringe order, while the fringe phase information refines this estimate [22]. In practice, it is not always possible to perform the second step of evaluating fringe phase, resulting in a loss of precision at the price for greater tolerance of surface texture [23].
2.2. Filtering of the source spectrum
[image:2.612.316.529.635.698.2]Typically, CSI instruments use a broadband source, e.g. a light-emitting diode (LED), with a bandwidth of between 100 nm and 150 nm [23]. The bandwidth will determine the coherence length, where a larger bandwidth will provide a smaller coherence length, and a narrower bandwidth will provide a larger coherence length. As an example, a white light source of a bandwidth of 100 nm, will give a coherence length of a few micrometres, which is suitable for acquiring data from most surfaces. However, rough surfaces featuring high slopes, may cause a CSI instrument to be prone to data dropout, which can be reduced by increasing the coherence length of the system [23, 24]. This is achieved by narrowing the bandwidth of the source spectrum, either through the use of bandwidth narrowing filters, which can be introduced into the optical path, or by using multiple sources of different bandwidths [23]. As a rule of thumb, data dropout will be reduced if the surface roughness is less than the coherence length [23, 24], nonetheless, this technique will also broaden the fringe envelope, and thus reduces measurement precision [23].
2.3 Signal oversampling
A conventional CSI measurement may yield only sparse data for surface regions featuring high slopes and low reflectivity. This missing data may be detectable if the measurement is sufficiently sensitive. One technique for enhancing the sensitivity is sampling at smaller phase increments by increasing the number of camera acquisitions over each interference
fringe. This method is sometimes referred to as signal oversampling [10, 19]. Increasing the signal oversampling factor, i.e. increasing the number of camera acquisitions over each fringe, improves the SNR and has been recently included by some commercial CSI systems, aiming to extract very weak signals from challenging surfaces [10, 21].
2.4 HDR lighting levels
For a conventional CSI measurement, light level is adjusted to avoid sensor saturation and is driven by the highest reflectance at the surface. This affects low-reflectance regions, already more prone to data drop-out due to their low contrast interferometric signal, by additionally starving them of light. HDR illumination lifts the signal level, and becomes particularly helpful in the case of measuring surfaces with a wide variation in reflectivity [19]. When a HDR measurement is used, multiple exposures are collected in sequence, varying either illumination or exposure time, and a composite image is formed from the image data with the greatest information content, commonly gauged by the contrast each pixel has to its neighbours [19].
3. Method
3.1 Instrument
[25] CSI system for this work. The instrument is located in a temperature controlled facility (20 ± 1) °C, isolated from noise and dust. Three objective lenses were investigated, with magnifications of 1.4× [26], 5.5× and 20× [27] respectively, and combined with 0.5× and 1× zoom lenses. In the NewView system, the fringe analysis method can be selected between one that uses the coherence envelope (to determine the surface height), and one that uses a combination of coherence and phase information. The user can select either a wide or a narrow bandwidth illumination by manually changing the filter of the source in the instrument between a neutral density (attenuating) filter and a 40 nm band-pass (BP) filter. The number of camera acquisitions over each fringe can be
multiple of the unit camera acquisition number can be selected. HDR of two or three lighting levels can be activated through the , in order to optimise the measurement for the highly and weakly reflecting areas respectively.
3.2 Samples
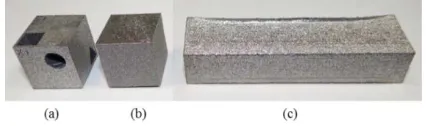
Ti-6Al-4V and Al-Si-10Mg exhibit good strength-to-weight ratios, high resistance to fatigue and corrosion, leading to automotive and aerospace applications [28, 29]. Ti-6Al-4V is also biocompatible, making it suitable for biomedical applications [30]. These materials were selected to build three customised artefacts to be used as samples for this study, from the LPBF and EBPBF metal AM processes described in section 1. The first and second artefacts consist of 20 mm Al-Si-10Mg and Ti-6Al-4V LPBF cubes, shown in Figure 1(a) and Figure 1(b), respectively. The third sample is a 20 mm × 15 mm × 75 mm Ti-6Al-4V EBPBF rectangular prism, shown in Figure 1(c).
3.3 Experimental design
The experimental work conducted through this study is designed to provide evidence as to whether CSI is suitable for measuring metal AM surfaces, to demonstrate the effects of implementing the selected advanced functions and settings of a modern CSI system in measurement of metal AM surfaces, and to provide good practice guidelines for using CSI to measure metal AM surfaces.
The experiments were designed according to the two following aspects: 1) four common metal AM surfaces that cover a large range of surface texture, slope distribution and characteristic topography. 2) A series of measurements performed by using a combination of three objective lenses and two zoom lenses, two spectral filters, two fringe analysis methods, five settings of signal oversampling and two HDR lighting levels. For each surface, optimised measurement methodologies are suggested in terms of data coverage, measurement area and time.
4. Results
4.1 Areal surface texture measurements
Surfaces were evaluated using the ISO 25178-2 areal surface texture parameters Sq and Sdq [14, 31]. The Sq parameter is a height parameter calculated from the root mean square (RMS) of the ordinate values within a defined area, while the Sdq parameter is a hybrid parameter calculated from the RMS of the surface gradient within a defined area. The values of the parameters shown in Table 1 were taken from the best measurements in terms of data coverage (above 99 %), using a 5.5× objective lens at 1× zoom. An S-filter with a nesting index of 3 µm and an L-filter with a nesting index of 1250 µm were applied (filtering of the surface was performed to remove only high frequency noise and long scale waviness/form, with the intention of maximising the examined measurement bandwidth).
[image:3.612.320.524.52.246.2]Uncertainties in the parameters are somewhat complex to calculate [32]. However, with the complex surfaces used in this paper, the standard uncertainty contribution to the variation across the surface will dominate when the combined uncertainty is calculated. Therefore, we have only used this influence factor in this work.
Table 1. Results of the areal surface texture parameters.
Surfaces Sq /µm Sdq
S1 LPBF Al-Si-10Mg cube, top surface 19 ± 2 0.6 ± 0.1
S2 LPBF Al-Si-10Mg cube, side surface 20 ± 3 1.0 ± 0.2
S3 LPBF Ti-6Al-4V cube, top surface 22 ± 3 1.1 ± 0.1
S4 EBPBF Ti-6Al-4V rectangular prism, top surface 34 ± 2 1.7 ± 0.2
[image:3.612.323.518.400.700.2]The measured topographies of the sample surfaces are shown in Figure 2.
Figure 2. CSI measurements of metal AM surfaces: (a) S1 using a 1.4×
objective lens, 1× zoom, (b) S2 using a 5.5× objective lens, 0.5× zoom. A 5.5× objective lens, 1× zoom was used for (c) S3 and (d) S4.
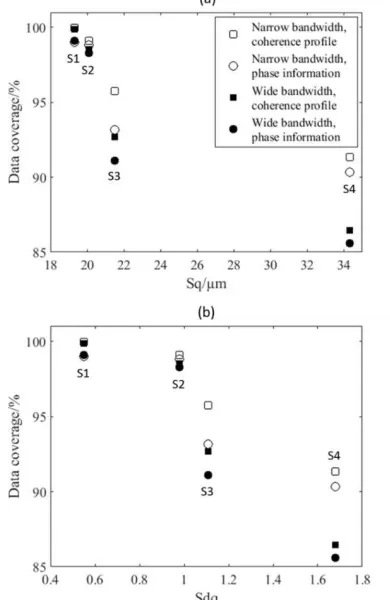
4.2 Effects of spectral filtering and fringe analysis methods As observed from Figure 3, results suggest that using a narrow bandwidth source spectrum (i.e. by the 40 nm BP filter) when measuring metal AM surfaces, will be generally helpful to achieve better measurements in terms of data coverage compared to the wide bandwidth source spectrum. The fringe analysis method based on the coherence profile provides slightly better data coverage compared to that using the phase information.
[image:3.612.79.299.534.635.2]It should be noted that higher data coverages are achieved for the surfaces that are relatively smoother, and the degree of improvement by using a narrow spectrum correlated with the height and slope parameters. In general, a level of data coverage above 90 % can be achieved for the measurements of AM surfaces using a low magnification lens.
4.3 Effects of signal oversampling
[image:4.612.93.272.236.376.2]Additionally, increasing the signal oversampling factor has been shown to be especially useful when attempting to obtain the best possible results, further expanding data coverage, as can be observed from Figure 4. Nevertheless, there is also a trade-off in measurement time, thus using a substantial signal oversampling factor will increase the total measurement time by the same factor.
Figure 4. Effects of signal oversampling on data coverage. 5.5× objective lens (1× zoom), narrow bandwidth spectrum and coherence profile fringe analysis method were used.
[image:4.612.328.508.339.477.2] [image:4.612.89.291.473.689.2]For rougher surfaces, such as the EBPBF Ti-6Al-4V rectangular prism top surface (S4), significant improvements were achieved, as shown in
Figure 5.
Figure 5. Effects of signal oversampling on data coverage for S4. 5.5× objective lens (0.5× and 1× zoom), narrow bandwidth spectrum and coherence profile fringe analysis method were used. (a) The effect of the camera exposure time; (b) original measurement without using signal
oversampling (0.5× zoom); and (c) result with 8× signal oversampling (0.5× zoom).
Regions presenting steep slopes, peaks and pits that previously caused the instrument to gather scarce data, as seen in
Figure 5(b), were fully covered after using 8× signal oversampling, as shown in
Figure 5(c), where the data coverage was increased from 70 % to 95 % for 5.5× objective lens (0.5× zoom). The improvement is more pronounced for the case of a lower system NA.
4.4 Effects of HDR lighting levels
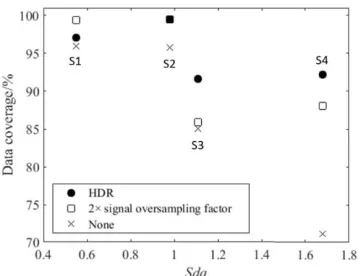
Enabling the HDR function for lighting levels may enhance data coverage, as shown in Figure 6. Measurement time is doubled if two levels of lighting are used, so it follows to also compare the results with those obtained using 2× signal oversampling. For rough surfaces featuring a large number of high slopes, the HDR function generated better results than that obtained by using the signal oversampling function, given that the total measurement time is equal (twice the time for a single scan). In the case of smoother surfaces, using 2× signal oversampling provided similar or slightly better data coverage compared to HDR. It is clearly shown that both of these two advanced functions provide improved measurements, especially for very rough surfaces.
Figure 6. Comparison of performance between HDR (2 light levels) and
signal oversampling (2×). The data coverage is plotted as a function of
Sdq. The result of the original measurement without using any of the advanced functions is shown as the crosses. Measurements were performed using the 5.5× objective (0.5× zoom), narrow bandwidth spectrum and coherence profile fringe analysis method.
4.5 Recommendations for the optimisation of the measurement
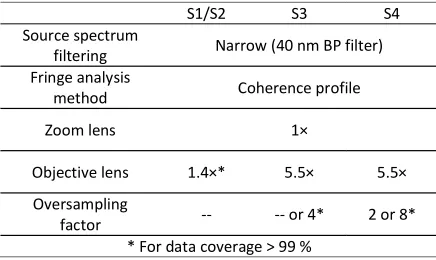
Table 2. Measurement optimisations for metal AM surfaces (95% data coverage by default).
S1/S2 S3 S4
Source spectrum
filtering Narrow (40 nm BP filter) Fringe analysis
method Coherence profile
Zoom lens 1×
Objective lens 1.4×* 5.5× 5.5× Oversampling
factor -- -- or 4* 2 or 8* * For data coverage > 99 %
5. Conclusions
AM surfaces are relatively rough and contain a large number of high slopes and loose particles. Thus, it is challenging to accurately measure the surface topography with high resolution. CSI was originally designed for measuring relatively smooth surfaces (e.g. optics). CSI has not previously been considered feasible for measuring AM surfaces; however, recent progress in the development of CSI allows a significantly enhanced detection sensitivity through some advanced measurement functions, such as filtering of the source spectrum, HDR lighting levels, adjustable number of camera acquisitions over each interference fringe and sophisticated topography reconstruction algorithms. In this paper, the effects of the advanced measurement functions on the measurements of several typical AM surfaces have been demonstrated. The result shows that CSI is a suitable technique for surface topography measurement of metal AM surfaces. Recommendations are provided for optimisation of the measurement for metal AM surfaces in terms of time, measurement area and data coverage.
Acknowledgements
This work was supported by the Engineering and Physical Sciences Research Council [grant numbers EP/M008983/1, EP/L01534X/1] and 3TRPD Ltd.
References
[1] Gibson I, Rosen D W, and Stucker B 2015 Additive manufacturing technologies (New York, NY, USA: Springer)
[2] National Institute of Standards and Technology 2013
Measurement science roadmap for metal-based additive manufacturing (Columbia, MD, USA: Energetics Incorporated) [3] Taylor J S 2015 Surface characteristics of additive-manufactured
components 15th international conference on metrology and properties of engineering surfaces (Charlotte, NC, USA: University of North Carolina at Charlotte)
[4] Townsend A, Senin N, Blunt L, Leach R K and Taylor J S 2016 Surface texture metrology for metal additive manufacturing: a review Precis. Eng. 46 34 47
[5] Gu D 2015 Laser additive manufacturing of high-performance materials (Berlin: Springer-Verlag)
[6] Leach R K 2014 Surface topography measurement instrumentation Fundamental principles of engineering nanometrology (Oxford, UK: Elsevier) pp 115 175
[7] ISO 25178-602:2010 Geometrical product specification (GPS) -- surface texture: areal -- part 602: nominal characteristics of non-contact (confocal chromatic probe) instruments
[8] Artigas R 2011 Imaging confocal microscopy Optical measurement of surface topography ed R K Leach (Berlin, Germany: Springer-Verlag) pp 237 286
[9] ISO 25178-604:2013 Geometrical product specifications (GPS) -- surface texture: areal -- part 604: nominal characteristics of non-contact (coherence scanning interferometry) instruments. [10] de Groot P 2015 Principles of interference microscopy for the
measurement of surface topography Adv. Opt. Photon.7 1 65 [11] Schmit J 2013 White-Light Interference 3D Microscopes
Handbook of Optical Dimensional Metrology ed K Harding (Boca Raton, FL, USA: Taylor & Francis) pp 395-418
[12] ISO 25178-606:2015 Geometrical product specification (GPS) -- surface texture: areal -- part 606: nominal characteristics of non-contact (focus variation) instruments
[13] Helmli F 2011 Focus variation instruments Optical measurement of surface topography ed R Leach (Berlin, Germany: Springer-Verlag) pp 131 166
[14] ISO 25178-2:2012 Geometrical product specifications (GPS) -- surface texture: areal -- part 2: terms, definitions and surface texture parameters
[15] Leach R K 2013 Characterisation of areal surface texture (Berlin, Germany: Springer-Verlag)
[16] ISO 4287:1997 Geometrical product specifications (GPS) -- surface texture: profile method -- terms, definitions and surface texture parameters
[17] Leach R K 2014 The measurement of surface texture using stylus instruments NPL measurement good practice guide no. 37 (UK: National Physical Laboratory)
[18] Lehmann P and Xie W 2015 Signal formation in depth-scanning 3D interference microscopy at high numerical apertures Proc. SPIE 9660, SPECKLE 2015: VI International Conference on Speckle Metrology (Guanajuato, Mexico, 24 26 August 2015) ed F Mendoza and E Méndez (Bellingham, WA, USA: SPIE) [19] Fay M, Colonna de Lega X and de Groot P 2014 Measuring
high-slope and super-smooth optics with high-dynamic-range coherence scanning interferometry Classical Optics 2014 OSA Technical Digest (online)
[20] Fay M,Badami V and Colonna de Lega X 2014 Characterizing additive manufacturing parts using coherence scanning interferometry 2014 ASPE Spring Topical Meeting on Dimensional Accuracy and Surface Finish in Additive Manufacturing (Berkeley, CA, USA: University of California at Berkeley)
[21] Schmidt M, Gilfoy N and Fay M 2014 High slope metrology with non-contact interferometry Quality Magazine
[22] Leach R K, Brown L, Jiang X, Blunt R, Conroy M and Mauger D 2008 Guide to the measurement of smooth surface topography using coherence scanning interferometry NPL measurement good practice guide no. 108 (Teddington, Middlesex, UK: National Physical Laboratory)
[23] Petzing J, Coupland J and Leach R K 2010 The measurement of rough surface topography using coherence scanning interferometry NPL measurement good practice guide no. 116
(Teddington, Middlesex, UK: National Physical Laboratory) [24] Roth J and de Groot P 1997 Wide-field scanning white light interferometry of rough surfaces Spring Topical Meeting on Advances in Surface Metrology: Proc. ASPE pp 57-60 [25] Zygo Corporation 2015 NewView 8300 specification sheet
SS-0100 01/15
[26] de Groot P and Biegen J 2016 Interference microscope objectives for wide-field areal surface topography measurements Opt. Eng. 55(7) 074110
[27] Zygo Corporation 2015 Nexview / Newview 8000 / ZeGage objective chart specification sheet SS-0101 12/15
[28] ASM Aerospace Specification Metals 2015 Titanium Ti-6AL-4V-AMS-4911
[29] Brandl E, Heckenberger U, Holzinger V and Buchbinder D 2012 Additive manufactured AlSi10Mg samples using selective laser melting (SLM): microstructure, high cycle fatigue, and fracture behavior Mater. Des. 34 pp 159 169
[30] Sidambe A T 2014 Biocompatibility of advanced manufactured titanium implants a review Materials 7 pp 8168 8188 [31] Leach R K 2011 Optical measurement of surface topography
(Berlin: Springer-Verlag)