A tale of two lakes: a multi-proxy comparison of
Lateglacial and Holocene environmental change in
Cappadocia, Turkey
NEIL ROBERTS,1* SAMANTHA L. ALLCOCK,1FABIEN ARNAUD,2JONATHAN R. DEAN,3,4,5WARREN J. EASTWOOD,6 MATTHEW D. JONES,4,5MELANIE J. LENG,3,5SARAH E. METCALFE,4EMMANUEL MALET,2JESSIE WOODBRIDGE1 and HAKAN YIGITBAS ¸IOGLU 7
1School of Geography, Earth and Environmental Sciences, Plymouth University, Plymouth PL4 8AA, UK
2
CNRS EDYTEM Laboratory, University of Savoie, Chambery, France
3NERC Isotope Geosciences Facilities, British Geological Survey, Keyworth, Nottingham NG12 5GG, UK
4
School of Geography, University of Nottingham, Nottingham NG7 2RD, UK
5Centre for Environmental Geochemistry, University of Nottingham, Nottingham NG7 2RD, UK
6
School of Geography, Earth and Environmental Sciences, University of Birmingham, Birmingham B15 2TT, UK
7Department of Geography, Ankara University, Turkey
Received 30 August 2015; Revised 4 March 2016; Accepted 10 March 2016
ABSTRACT: Individual palaeoenvironmental records represent a combination of regional-scale (e.g. climatic) and site-specific local factors. Here we compare multiple climate proxies from two nearby maar lake records, assuming that common signals are due to regional-scale forcing. A new core sequence from Nar Lake in Turkey is dated by varves and U–Th to the last 13.8 ka. Markedly dry periods during the Lateglacial stadial, at 4.3–3.7
and at 3.2–2.6 ka BP, are associated with peaks in Mg/dolomite, positive d18O, elevated diatom-inferred
electrical conductivity, an absence of laminated sediments and low Quercus/chenopod ratios. Wet phases
occurred during the early–mid Holocene and 1.5–0.6 ka BP, characterized by negative d18O, calcite
precipitation, high Ca/Sr ratios, a high percentage of planktonic diatoms, laminated sediments and high
Quercus/chenopod ratios. Comparison with the record from nearby Eski Acıgo¨l shows good overall
correspondence for many proxies, especially for d18O. Differences are related to basin infilling and lake
ontogeny at Eski Acıgo¨l, which consequently fails to register climatic changes during the last 2 ka, and to increased flux of lithogenic elements into Nar Lake during the last 2.6 ka, not primarily climatic in origin. In attempting to separate a regional signal from site-specific ‘noise’, two lakes may therefore be better than one.
Copyright#2016 The Authors.Journal of Quaternary SciencePublished by John Wiley & Sons Ltd.
KEYWORDS: eastern Mediterranean; Holocene; isotopes; lakes; multi-proxy.
Introduction
Most records of past climatic and environmental change derive from a specific archive at a defined location, such as a lake, a cave or a peat bog. Temporal changes in proxies for climate or vegetation at an individual site are then assumed to be representative of a wider spatial area. If proxies were a perfect match for environmental variables, if chronological control were perfect and if environmental variability across space were minimal (as in the open ocean), then proxy records from otherwise similar sites in the same region should show a near linear correspondence. In fact, this is not case. It remains an open question how far any individual sequence represents a signal of regional-scale environmental change, and how much of it comprises site-specific factors which palaeoclimatologists, for example, might view as local-scale ‘noise’. How can we know this, and how far does the
signal-to-noise ratio vary between different proxies? A priori, the
separation of local from regional factors is more significant and more challenging in some archives than others, for example lacustrine compared to marine sediments.
The issue of spatial representativeness has been investi-gated in previous studies for several different domains. They include pollen recruitment models that attempt to estimate the contributions of local versus extra-local versus regional pollen (e.g. Prentice, 1985) and studies of inter-profile variability across individual peat bogs, linked to the different environmental responses of hummocks and pools (e.g. Barber
et al., 1998). Local-scale replication of ring widths and densities between individual trees is an integral part of dendroclimatological calibration studies (Cook and Kairiuk-stis, 1990). By contrast, there have been fewer systematic inter-site comparisons of lacustrine records of palaeoenviron-mental change. A common approach is to compare curves for individual proxies from a series of archives, on the basis that common features are likely to have a common cause. Daley
et al. (2011), for example, plotted stable isotope variations from individual lakes, peat bogs, marine and ice cores around the circum-North Atlantic region between 9.2 and 7.4 ka BP, to define the timing and duration of the 8.2-ka climatic excursion. The comparative approach assumes that the large-scale climatic signal is represented by the common trend within a defined geographical area, while inter-site differ-ences represent local factors or chronological imprecision. This assumption lay behind Alayne Street-Perrott’s innovative multi-site compilation of African, and later global, lake-level data, which could then be converted into maps and graphs of past hydrological status (Street and Grove, 1979;
Street-Perrott and Roberts, 1983; Street-Street-Perrottet al., 1985). It also
underpins the construction of stacked records from multiple sites, for example of Mediterranean lake isotopes (Roberts
et al., 2008, 2011) or bog-surface wetness in British peat records (Charman, 2010).
By comparing the records from sites of similar type in the same geographical area, which would have experienced the
same history of climate (e.g. Schmieder et al., 2011; Mills
et al., 2014), it is possible to conduct natural experiments to explore further the issue of replicability. In this study we Correspondence: N. Roberts, as above.
E-mail: cnroberts@plymouth.ac.uk
Copyright#2016 The Authors. Journal of Quaternary Science Published by John Wiley & Sons Ltd.
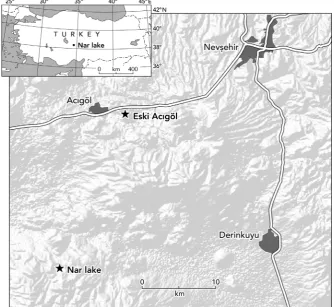
adopt this approach using two maar lakes from central
Turkey, located25 km apart (Fig. 1). We compare multiple
proxies of environmental change over the last 14 ka to
establish how well individual proxies match between the two sites. We hypothesize that those proxies showing a good correspondence reflect regional-scale climatic and
environ-mental change most clearly (¼ ‘signal’), while those proxies
that have a poor correspondence also carry a strong,
site-specific local component (¼‘noise’).
Study sites
The two volcanic maar sites used for this comparison are
Eski Acıgo¨l (38˚3300100N, 34˚3204100E; 1270 m above sea
level, masl) and Nar Lake (38˚2002400N, 34˚2702300E; 1363
masl). The first is a small, former brackish lake, drained in 1972, which had no inflow streams and a surface catch-ment not much larger than the lake itself. Nar Lake, by contrast, is still extant with a maximum water depth of 21–26 m over the past decade. Its waters are oligosaline
(electrical conductivity, EC¼2.5–3.7 mS cm1), alkaline
(pH¼7.4–8.5), stratified below 8 m depth, and with a
residence time of 8–11 years (Jones et al., 2005;
Wood-bridge and Roberts, 2010; Dean et al., 2015a). It is
depositing annual varve layers at the present day. Like Eski
Acıgo¨l, Nar Lake is relatively small (0.7 km2
) but it has a
watershed catchment of 4 km2, which on the south
side of the lake is drained by ephemeral streams that have formed a fan-delta. The southern headwalls of the lake catchment are steep and actively eroding today, and have formed a badland morphology, including some ‘fairy chimneys’ (hoodoos) typical of Cappadocia. Both sites are hydrologically closed in terms of surface outflows, and are sensitive to climatic changes. They are located in the oak parkland zone that covers much of the Anatolian plateau and they share the same continental Mediterranean climate.
There is no permanent habitation inside either catchment today. In the eroding headwall south of Nar Lake there are several cave dwellings, probably excavated around the 11th century AD, at which time there would have been a small human population in residence.
Eski Acigo¨l was formed around 20–25 ka BP within a set of rhyolitic eruptions, the products of which bury a pre-Tertiary substratum of diabases and granites. In contrast, Nar Lake lies within a volcanic context mixing Mio-Pliocene rhyolitic ignimbrites, Mid-Pleistocene rhyolitic domes and Upper
Quaternary to recent basalt flows (Kuzucuoglu et al., 1998;
Gevrek and Kazanci, 2000; Mouraliset al., 2002). The age of
the Nar maar is not known, but it is likely to be older than
that of Eski Acigo¨l. There is an old carbon effect of3 ka at
Eski Acıgo¨l (Roberts et al., 2001) and15 ka at Nar (Jones,
2004) due to volcanic out gassing and/or old carbon source rocks at depth in the groundwater catchments of these lakes.
Given the substantial old carbon effects,14C was not used to
date the 2010 Nar Lake cores.
The sedimentary record from Eski Acıgo¨l extends back to around the time of the Last Glacial Maximum, although it is
poorly resolved for the last two millennia (Roberts et al.,
2001; see below for further explanation). Its sediments are laminated for the Late Pleistocene and Early Holocene, but
non-laminated after 6.5 ka BP. Dating control is provided
primarily by U–Th and Ra–Th dates with relatively large
standard errors ( 250 years). The record has been analysed
for stable isotope composition of bulk carbonates, for
mineralogy and for diatoms (Robertset al., 2001), with pollen
analysis carried out on a parallel core (Woldring and Bottema, 2003). Analytical methods for the Eski Acıgo¨l core sequence can be found in these two papers.
The late Holocene sedimentary record from Nar Lake has been previously analysed at high temporal resolution for
stable isotopes (Jones et al., 2006), pollen (England et al.,
[image:2.595.219.554.475.782.2]2008) and diatoms (Woodbridge and Roberts, 2011). These
cores (NAR01/02) span the last 1700 years and are continuously varved. In July 2010, a new coring programme at Nar Lake led to the recovery of longer cores extending back to Lateglacial times. This NAR10 core sequence has been analysed for multiple geochemical and palaeoeco-logical proxies, and has been dated by U–Th and varve counting. Stable isotope, carbonate chemistry and U–Th
methods and results have reported by Dean et al (2015b),
while elemental and organic geochemistry, diatom and pollen results are described here for the first time. Because they are new, we first describe these data before going on to make a comparison with those from Eski Acıgo¨l. Most of the data sets from the NAR10 cores are being, or will be, published separately.
Methods
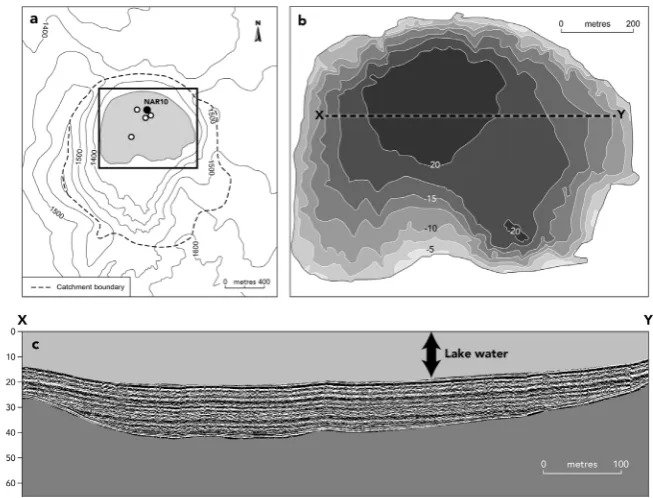
Before the start of coring at Nar in July 2010, a seismic survey of the lake bed and its underlying sediments was carried out using a Boomer system, coupled to a high-precision GPS. Fifty-three transect lines were made across the lake with an interval spacing of 30 m, east–west and north–south, to create a detailed bathymetric map and cross-section profiles of the
upper 20 m of the lake sediments (Fig. 2), so helping to
locate the best places for subsequent coring. These results also clearly highlight the morphology and internal sedimen-tary structures of the sub-aqueous fan-delta on the south side of the lake.
Coring took place at 21.5 m water depth from a platform using a UWITEC stationary piston corer. The sediments
contained gas (probably methane and CO2) that led to
expansion of some cores within the tube liner after extraction, due to depressurization. Coring went down to 22.5 m below the lake bed without reaching non-limnic sediments. At the main core site, triple overlap parallel cores were recovered in close proximity (NAR10 cores 1, 2 and 4). The NAR10 cores were opened, split in two lengthwise, described and photo-graphed in September 2010 in the laboratory at Plymouth University, with one half being kept as an archive. The three core sequences were correlated visually at tie-points and best sections from three parallel cores were spliced together to create a Master Sequence 21.69 m long (Supporting
Information, Fig. S1). For laminated parts of the core sequence, chronologies were established by layer counting. Counts were made independently by two people and recounted until agreement (to within five varve years) was reached.
Stable isotope analysis, carbonate mineralogy and
U–Th dating
Different mineralogies of CaCO3 were measured by X-ray
diffraction. Samples containing just calcite and/or aragonite
were analysed for d18Ocarb and d13Ccarb via a VG Optima
mass spectrometer, with data reported as per mil deviations
from VPDB. Samples containing <20% dolomite were
analysed differently to exclude the dolomite component, and
samples with >20% dolomite were not used (for details see
Deanet al., 2015b). X-ray diffraction was carried out on most but not all stable isotope samples, so the carbonate mineral-ogy record is not as complete. Carbon isotope and C/N ratios of the organic sediment fraction were also determined, but at
a lower (200 years) resolution than the 25-year interval
used for d18Ocarb and d13Ccarb. Organic fractions were
disaggregated in HCl for 24 h and then washed with deionized water. Dried samples were homogenized and
analysed for C/N andd13Corgon a Carlo Erba NA1500 and a
VG Optima mass spectrometer (for details see Dean, 2014). Uranium–thorium (U–Th) dating was undertaken on the NAR10 cores. Because Th can be incorporated from detrital material as well as via the water column, samples were analysed using a total dissolution isochron approach (see Dean et al., 2015b). Dating was carried out using this approach at six levels in the NAR10 master sequence, although only two of these resulted in usable ages, due to large statistical uncertainties arising from low concentrations of U and high concentrations of Th.
Elemental chemistry
A fast and non-destructive analysis of elemental geochemistry can be achieved through the use of ITRAX X-ray fluorescence
core scanning (Croudace et al., 2006; Rothwell and Rack,
[image:3.595.50.377.535.784.2]2006). This is a particularly useful technique to use on long, continuous laminated core sequences. Cores covering the master sequence were scanned at the Aberystwyth University
ITRAX facility in November 2010. Measurement was con-ducted using a Cox Analytical Systems scanner at 200-mm
sampling interval resolution (400mm for non-laminated
sec-tions) (for details see Allcock, 2013). One drawback of ITRAX scanning is that it is hard to achieve accurate analysis of lighter elements (e.g. Mg). They can, however, be detected with
hand-held XRF analysers (Kylander et al., 2012). The cut NAR10
core master sequence was therefore also analysed using a Thermo Scientific Niton XL3t GOLDD series XRF hand-held scanner at Plymouth University. A sampling resolution of every 8 cm was used with a collimated 3-mm spot (Allcock, 2013). By using the two XRF techniques together, a broader array of elements was determined and cross-correlations could be made to ensure that ITRAX readings are an accurate reflection of geochemical variations in the Nar Lake sequence.
A Skalar Primacs Series Total Carbon Analyser was used to measure the abundance of organic and inorganic carbon in the NAR10 sediments. However, the results for the organic component were internally inconsistent for some core sections (Allcock, 2013). Consequently the incoherence/ coherence (Inc/Coh) ratio from ITRAX is used here as a proxy for organic matter content. Because organic carbon has a lower average atomic mass than carbonates, silica or alumi-nosilicates, an increase in the Inc/Coh ratio suggests a greater organic carbon concentration, and indicates a higher organic
matter content (Jenkins, 1999; Burnettet al., 2011). There is a
close comparison between the Inc/Coh ratio and the total organic carbon values for several core sections, notably those with higher organic matter content (e.g. unit 1), implying that the Inc/Coh ratio can be used as a reliable proxy for total organic carbon content.
Diatom analysis
Sub-samples for diatom analysis were obtained by cutting sediments from core half sections using a scalpel. Where
possible, three varve year samples of approximately 0.5 cm3
were taken at200-year time intervals. The diatom
prepara-tion procedure follows standard methods adapted from
Battarbee et al. (2001), with 300–400 diatom valves counted
in transects on each slide. Species identification is based on Krammer and Lange-Bertalot (1991a,b, 1997a,b, 2000). Multi-dimensional scaling was performed on percentage data to identify major axes of data variability and significant zone boundaries were identified using a constrained incremental sum-of-squares cluster analysis (CONISS) and the broken-stick approach with the Rioja Package in R software (R Core Team, 2015). Transfer function training sets provided by the European Diatom Database (EDDI) (Juggins, 2015) were applied to the NAR10 diatom data. Training sets and models were selected based on the percentage of fossil sample species represented in the modern data set, the number of sites in which these
species are present and the model performance (r¼0.36 and
RMSEP¼0.47). The combined salinity training set (comprising
data from East Africa, North Africa and Spain) by weighted averaging with inverse deshrinking was identified as satisfying these criteria best and analyses were carried out using C2 software (Juggins, 2003–2006).
Pollen analysis
Sub-samples of sediment (1 cm3in volume) were analysed
for pollen at 200-year intervals through the NAR10
sequence. Extraction and identification followed the standard procedure of Faegri and Iverson (1989) as modified by
England et al. (2008). Pollen grains were counted until a
pollen sum of 300 grains was reached (excluding spores, aquatic, exotics and Cyperaceae). The delimitation of local
pollen assemblage zone boundaries was aided by a CONISS analysis. The summary pollen diagram was constructed using TILIA2 and TILIAGRAPH (Grimm, 2004).
Results
Master sequence stratigraphy and chronology
Seven major lithostratigraphic units have been identified in the NAR10 master sequence, along with a number of sub-units (Fig. 3; Table S1). Four sub-units are finely laminated, with a fifth (unit 3) comprising mainly thicker laminations. Two units (2 and 6) are largely non-laminated. We have previouslyshown (Jones et al., 2005) that the laminations in unit 1
represent annual varve couplets. Based on the high ‘quality’ (i.e. clarity) of the laminations and the regularity of the sedimentary couplets (confirmed by thin sections and ITRAX), it appears that this also applies to the laminations in units 3, 4, 5 and 7. If this is correct, laminae counting can be used to build a floating chronology for these parts of the NAR10 core sequence.
As the core sequence was not laminated throughout, additional age estimates were needed. These have been provided primarily by dating from two aragonite-rich layers. U–Th analyses from 1949 cm depth have given an isochron
age of 11.820.52 ka, while those from 1021 cm gave an
age of 4.41þ0.16–0.17 ka (for further details see Deanet al.,
2015b). The first of these U–Th ages comes from near the
bottom of unit 5, and is close to and in good agreement
with the stratigraphically inferred Pleistocene–Holocene
[image:4.595.313.550.485.743.2]boundary in the NAR10 master sequence. The second U–Th date lies within unit 3 and provides a fixed datum for the mid-Holocene part of the core record. These U–Th ages have been used to pin ‘floating’ laminae counts for units 3, 4 and 5, while for the non-laminated parts of unit 2 linear sedimentation has been assumed. The basal, Lateglacial part of the NAR10 master sequence, represented by units 6 and 7, currently lacks independent radiometric age determination.
The inferred onset of the Lateglacial Stadial has therefore been assigned an age of 12.9 ka BP based on correlation with
NGRIP (Rasmussenet al., 2006), with laminae counts
extend-ing the basal age of unit 7 back to 13.8 ka BP (note that ages are quoted in years before 1950).
The age–depth relationship (Fig. 3) reveals that sedimenta-tion at Nar has been relatively constant for most of the
Holocene at 1.5 mm a1, although it has increased in unit 1
(last 2.6 ka, 2.3 mm a1) linked to the presence of increased
numbers of turbidites and decreased sediment compaction. The main exception to this linear age–depth relationship occurs between 598 and 1161 cm in units 2 and 3. There are strong indications that depositional rates changed substan-tially during this interval. Firstly, laminations between 798 and 1100 cm (in unit 3) are much thicker than in the rest of the cores (Table S1). If these thick laminae are annual, as laminae counts and U–Th age estimates would suggest, then this implies a four-fold increase in sedimentation rate
for this interval to 5.8 mm a1. Secondly and in contrast,
the sediments in unit 2 are highly compacted and where laminations are visible, they are very thin. This suggests slow sedimentation from 798 to 600 cm. Thirdly, the U–Th date of 4.41 ka at 1021 cm is well constrained, with relatively small uncertainties, and supports a non-linear sediment accumulation during units 2 and 3. Finally, there is a marked change in sediment lithology between the base of unit 3 and the top of unit 4, which would be consistent with a hiatus in sedimentation at this point. The duration of this hiatus is unknown, but it also means that we are unable to assign ages with confidence to samples from 1041 to 1139 cm. Because of these uncertainties, we have not plotted data for the period from 6.5 to 4.4 ka when using an age scale. For most of the NAR10 master sequence, we
estimate the error of our age model as <200 years, and for
the upper 6 m (last 2.6 ka)<20 years.
Stable isotopes and carbonate mineralogy
The NAR10 stable isotope and carbonate data have been spliced to those from the NAR01/02 core sequence to provide a single diagram covering the full 21.5-m core
depth. Dean et al. (2015b) describe these results in detail
along with their wider palaeoclimatic significance. Based on
modern studies and mass balance modelling (Jones et al.,
2005; Dean et al., 2015a), oxygen isotopes in Nar Lake
carbonates are interpreted as indicating variations between
wetter hydroclimatic conditionsi.e. a higher precipitation to
evaporation (P/E) ratio (more negative isotopic values) and
climatically drier phases i.e. lower P/E ratio (more positive
isotopic values). Carbonate mineralogy switches between calcite and aragonite dominance for most of the record, with briefer intervals when dolomite is also present, initially in unit 6 (Lateglacial Stadial) and then again at 1050– 923 cm (4.4–4.1 ka BP) and 684–558 cm (3.2–2.35 ka).
Isotope data from core sections where there was <20%
dolomite are not shown for the reasons outlined in Dean
et al. (2015b), thus forming isotopic ‘data gaps’ that are likely to represent the most evaporated (i.e. dry) conditions in the NAR10 record.
d13Ccarb values co-vary with those of d18O, as might be
expected in a non-outlet, evaporatively dominant lake system
(Talbot, 1990; Li and Ku, 1997; Hortonet al., 2016).d13Corg
displays a shift from lower values in units 4 and 5 to higher values in unit 2. C/N ratios, measured on the same samples
asd13Corg, show an overall trend from values >20 in unit 5
(Early Holocene) to values generally between 10 and 15 in the second half of the Holocene.
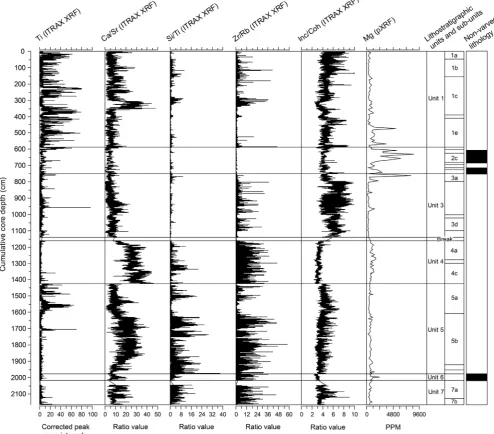
XRF elemental geochemistry
Selected key parameters are presented in Fig. 4, and show a close correspondence to visible lithostratigraphic units and sub-units. The clearest climatic signal in these geochemical data derives from the Ca/Sr ratio and from Mg concentra-tions. The former increases at times of positive water balance, whereas the latter increases at times of low lake level and negative hydroclimatic conditions (Cohen, 2003). There are three main periods when the Ca/Sr ratio was higher than average, namely sub-unit 5b (11.5–9.3 ka BP), unit 4 (8.2–6.5 ka) and between 352 and 286 cm within unit 1 (1.4–1.0 ka). In contrast, elevated Mg concentrations occur primarily at the end of unit 3 and during unit 2 (768– 600 cm; 3.8–2.6 ka).
A significant component of the NAR10 sediment record is of detrital origin, and some parts of the sequence show high concentrations of lithogenic elements Fe, Ti, K and Rb. These elements show very similar patterns and close correlations (Allcock, 2013); the relatively stable Ti is used here as representative of this group. The Ti record shows an up-core increase in concentration, notably in unit 1 (upper 6 m) where there are large amplitudinal fluctuations associated with the increased presence of turbidite/homogenite layers. This implies a major increase in catchment erosion during the last 2.6 ka. Elevated Ti concentrations also characterize sub-unit 5a (1606–1428 cm, 9.3–8.2 ka BP) indicating a period of significant inwash of clastic sediment during Neolithic times. The lowest Ti values in the record occur in the subsequent unit 4, dating to the early–mid Chalcolithic period (8.0– 6.5 ka).
The Si concentration data should be used with caution, because this light element lies at the limits of detection on the ITRAX settings that were used, and consequently has lower peak area integral values. However, the overall pattern of change is confirmed in Si measurements using a hand-held XRF. Si concentrations using both measurement methods (not shown) are highest in units 1 and 5, but for different reasons, as the Si/Ti ratio indicates (Fig. 4). Whereas most of the Si in unit 1 is of detrital origin, in the bottom half of the master sequence it primarily originates from diatom frustules. Thus, the Si/Ti ratio can therefore be considered as a proxy for biogenic silica abundance. Other than in unit 3, this shows a similar pattern of change to the Zr/Rb ratio, which relates to clastic inwash. More specifically, the Zr/Rb ratio may provide a proxy for grain size, with lower values reflecting typically finer-grained inwashed sediments, such as clay-size particles (Dypvik and Harris, 2001). The higher Zr/Rb ratios in most of units 4, 5 and 7 reflect the presence of medium–large silt-sized particles including endogenic calcite crystals and diatom frustules.
The Inc/Coh ratios in the ITRAX data are likely to be primarily related to their organic matter content, with low ratios indicating periods of well-oxygenated bottom waters and poor organic matter preservation. Not surprisingly, these periods include non-laminated units 2 and 6, when water levels were too low to permit lake stratification. More surprisingly, they also include unit 4, which mainly comprises finely laminated endogenic carbonates that are clearly well oxidized.
Diatoms
Following a preliminary evaluation (Busby, 2011), the NAR10 diatom data have been spliced together with those from the much higher resolution NAR01/02 core sequence to
provide a single diagram spanning the last 14 ka (Fig. 5).
those from the previous record for the interval between 411.3 and 361.2 cm. The NAR01/02 diatom data, spanning the last 1.7 ka, are not discussed in detail here, having been previously presented in Woodbridge and Roberts (2011).
The NAR10 sequence shows important up-core changes in diatom assemblages, with no stable baseline ecological state. Salt-tolerant taxa are common throughout the sequence, indicating that the lake was brackish to saline for most of the Lateglacial and Holocene. There are significant temporal
variations in the proportion of planktonicþfacultatively
plank-tonic versus benthic/periphytic taxa, primarily linked to fluctuations in lake water depth. There is a broad, but by no means perfect, correlation between % benthos/periphyton and diatom-inferred electrical conductivity (DI-EC: Pearson’s
r¼ þ0.673,R2¼0.4,p<0.001).
Based on multi-dimensional scaling and CONISS, we identify seven principal diatom biostratigraphic zones, as follows:
N10-D1: 2153–1875 cm (13.8–11.3 ka BP). This zone covers part of the Lateglacial period and the climatic transition at the start of the Holocene. Diatoms include a mix of saline and freshwater taxa, both planktonic and benthic/
periphytic. There are some significant changes in assemblage composition within the zone that will require future higher-resolution sampling to define. The newly described centric
taxon Clipeoparvus anatolicus (Woodbridge et al., 2010) is
common in both this and the following zone.
N10-D2: 1875–1590 cm (11.3–9.25 ka). These assemblages are dominated by planktonic or facultatively planktonic
diatoms such asSynedra acus,Nitzschia paleaceaand
Cyclo-tella meneghiniana, and DI-EC values are below 3000mS
cm1. This indicates that Nar Lake was at least as deep as
today and its waters were relatively dilute chemically, although probably not truly fresh.
N10-D3: 1590–1423 cm (9.25–8.2 ka). This zone is
domi-nated by the halophytic planktonic taxon C. meneghiniana,
which reaches over 80% dominance. DI-EC values are
between 3000 and 7200mS cm1, implying a rise in lake
water salinity, but with no corresponding fall in lake levels.
N10-D4: 1423–1161 cm (8.2–6.5 ka). This diatom zone, which corresponds to lithostratigraphic unit 4, begins with an
abrupt decline in C. meneghiniana and its replacement by
periphytic taxa (e.g. Epithemia, Gomphonema), indicating a
[image:6.595.51.546.56.490.2]short-lived lake level lowering. The remainder of the zone
Fi
gure
5.
Comb
ined
NAR
10
þ
NA
R01
diatom
diagram,
al
ong
with
diatom
-inferre
d
elect
rical
cond
uctivi
ty
(DI-EC)
and
the
first
two
mul
ti-di
mensi
onal
scal
ing
axes
.
The
sedim
ent
ar
y
log
(left
)
shows
the
ma
in
lit
hostrat
igraphi
c
units
(NL,
non-lam
inated
sedim
comprises a mix of planktonicC. meneghinianaand periphy-ton, implying intermediate water depths and salinity levels.
N10-D5: 1141–418 cm (>4.4–1.7 ka). This zone includes lithostratigraphic units 2 and 3, along with the basal part of unit 1. There is an abrupt change in assemblage composition between diatom zones D4 and D5, associated with an apparent stratigraphic hiatus. D5 is dominated by halophytic
taxa, mostly benthic/periphytic (notablyAmphora
coffeaefor-misandNavicula digitoradiata) along with some facultatively
planktonic types, notably Nitzschia palea. DI-EC values lie
between 2000 and 15 000mS cm1. According to the diatom
data, this is the time period when the lake was shallowest and most saline.
N10-D6: 418–358.5 cm (1.7–1.4 ka). This short-lived zone corresponds to ND1 of Woodbridge and Roberts (2011), and
is characterized by a peak inFragilaria construensvar.venter,
along with several salt-tolerant taxa (e.g.C. meneghiniana,
Rhopalodia operculata,Navicula halophila). The lake appears to have been relatively shallow and still saline, but may also have been affected by catchment disturbance.
N10-D7: upper 358.5 cm (1.4 ka to present). This corre-sponds to ND2, 3 and 4 of Woodbridge and Roberts (2011). This period is dominated by the facultative planktonic taxa
N. palaeacea and S. acus, along with C. anatolicus and
Achnanthidium minutissimum, indicating deep-water condi-tions and relatively dilute lake waters.
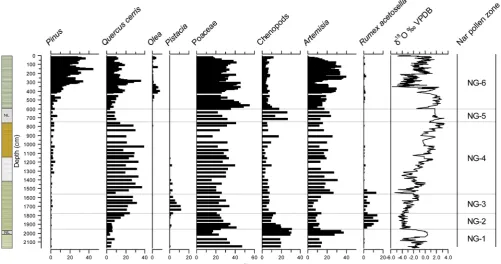
Pollen
To create the composite diagram shown in Fig. 6, counts from the NAR10 sequence (319–2153 cm depth) have been spliced together with those from the previously published NAR01/02 cores (0–414 cm), there being good overlap between the two
sequences. The NAR01/02 pollen data (England et al., 2008)
span the late Holocene at 20-year sampling resolution, whereas those from NAR10 have a lower mean sampling
interval of200 years. The full NAR10 pollen diagram will be
presented and described in detail in a later publication.
Based on CONISS, we identify six principal pollen zones, as follows:
NG-1: 2153–1960 cm (13.7–11.8 ka). This basal pollen zone is characterized by low arboreal pollen (AP) values and
a predominance of grasses and steppic herbs (Artemisia
and Chenopodiaceae). The proportion of the latter increases
sharply in the second part of this zone (<13.0–11.8 ka),
corresponding to the Lateglacial Stadial.
NG-2: 1960–1790 cm (11.8–10.7 ka). The succeeding zone NG-2 dates to the earliest part of the Holocene. It is ecologically transitional, being marked by a decline in
Artemisiaand Chenopodiaceae pollen, a rise in Poaceae and
Rumex acetosella and a more gradual increase in deciduous
oak [Quercus(d.)].
NG-3: 1790–1575 cm (10.7–9.2 ka). This zone is
character-ized by a marked peak inPistaciapollen, along withQuercus
(d.), Poaceae and Rumex. Since Pistacia is a low pollen
producer, it can be assumed that this tree was quite common at this time, whereas today, although found locally, it is relatively rare.
NG-4: 1575–740 cm (9.2–3.6 ka). At the start of this zone,
Pistacia declines to low values and is replaced by pollen assemblages comprising deciduous oak (25–30%), grasses and Artemisia. This rather stable, long-lived vegetation corresponds to the oak steppe-parkland of central Anatolia,
which according to Asouti and Kabukcu (2014) may
have been anthropogenically maintained. This pollen zone comes to an end during the first half of the second millennium BC.
NG-5: 740–600 cm (3.6–2.55 ka). In this zone, the
Quer-cus–Poaceae–Artemisia assemblages are replaced by pollen
spectra with much lower proportions of AP, mainly due to a decline in deciduous oak, and an increase in Chenopodia-ceae, indicating a loss of woodland and expansion of semi-arid herb-steppe.
[image:8.595.49.551.502.766.2]NG-6: <600 cm (post-2.55 ka). During this zone, cheno-pods decline and AP increases somewhat, but now includes cultivated trees (e.g. olive) and pine, as well as oak. Note that
pine does not grow locally in Cappadocia, except where
planted deliberately, so that much of thePinuspollen in this
zone must be due to long-distance transport. This zone overlaps stratigraphically with the NAR01/02 pollen diagram, and along with its sub-zones, it is described in detail by
England et al. (2008). One of the sub-zones dating to
Classical times between 2.1 and 1.3 ka (200 BCE to 670
CE) represents the Beys¸ehir Occupation phase, and is marked
by clear pollen indicators of agricultural land-use activity.
Discussion
Synthetic environmental reconstruction for the
NAR10 sequence
The range of proxy data described above can be compared and synthesized to provide an integrated reconstruction of
environmental change over the last14 ka. Our
reconstruc-tion does not include the period from 6.5 to 4.4 ka BP because samples between 1040 and 1161 cm cannot be assigned an age with confidence, and because of an inferred
hiatus at 115011 cm. The cause of the hiatus is not known,
but may have been related to local tectono-volcanic activity, judging from the highly deformed nature of the lake sedi-ments in the lower part of unit 3. Up-core variations in different indicators were the result of multiple agencies, both climatic and non-climatic. Non-climatic factors are discussed first, including human actions, ecological dynamics, geomor-phological processes and volcanic impacts.
Non-climatic factors
Evidence of human impact in the NAR10 record is most obvious during the last four millennia. This is unambiguous in the pollen record after 2.4 ka BP (Fig. 6), with the presence of
cultivated tree crops (e.g. olive), associated with the Beys¸ehir
Occupation phase (discussed in detail in England et al.,
2008). The decline in deciduous oak woodlands after 3.9 ka BP is also likely to have been due, at least in part, to human-induced deforestation, although it also coincided with a period of climatic drying, so that multiple factors were probably involved. Archaeologically, during the second millennium BC (Middle and Late Bronze Age) central Anatolia lay at the heart of the expanding Hittite Empire, with its demands for timber, wood fuel, grazing and agricultural land. It is therefore not surprising to see evidence of resource exploitation and deforestation in the NAR10 record at this time. A second potential line of evidence for anthropogenic landscape impact comes from indicators of catchment ero-sion, such as Ti (Fig. 4). The flux of Ti and other lithogenic elements into Nar Lake increases sharply in the upper 6 m of
the NAR10 master sequence, i.e. from 2.6 ka BP onwards.
This coincides with the beginning of Achaemenid Persian imperial rule in Anatolia and a period of increasing settlement density in Cappadocia (Allcock and Roberts, 2014). The lack of overall correspondence between what would normally be considered climatic and erosional indicators during the last 4 ka implies that climate change was not the likely underlying cause of the Late Holocene increase in Ti and other erosional indicators (e.g. K, Fe).
Intriguingly, ITRAX data indicate another phase of in-creased clastic influx earlier in the Holocene (sub-zone 5a, 9370–8150 yr BP), which would also have been linked to disturbance of the lake catchment, possibly anthropogenic. This period coincides with the Neolithic occupation at
C¸atalho¨yuk, the largest known settlement of this period in€
Anatolia (Hodder, 2014). One of the main sources of the
obsidian found at C¸atalho¨y€uk is Nenezi Dag, a hill located
3 km from Nar Lake, just outside its catchment (Carter, 2011). This ‘obsidian workshop’ would have been active throughout the ceramic Neolithic period, especially from 8.6 to 8.2 ka BP, probably on a seasonal basis. Nar Lake would have provided an obvious base for those who were mining the black volcanic glass, with freshwater springs around the lake providing a year-round water source. Lithic artefacts and
debitageare common around Nar Lake, although no occupa-tion site has so far been found. It is difficult to identify a diagnostic anthropogenic signal in the NAR10 pollen record at this time, although there is a sharp, short-lived fall in oak
pollen and increase in ruderal Rumex acetosellaat9.1 ka
BP. There were two episodes of climatic deterioration during this period (see below), which are also likely to have contributed to Neolithic landscape instability and catchment erosion around Nar Lake. Finally, there is evidence of a major eruption of one of Cappadocia’s strato-volcanoes during
Neolithic times (Mouraliset al., 2002; Zanchettaet al., 2011;
Schmittet al., 2014), which may account for a sharp peak in
Ti and other elements in the NAR10 master sequence at around 8.6 ka BP.
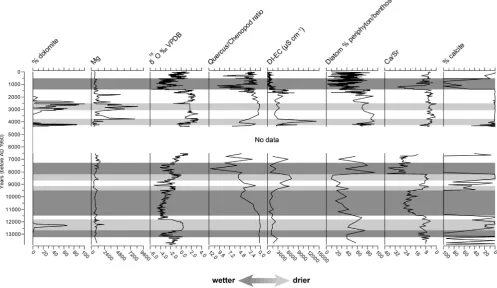
Climate
The strongest signal in the Nar Lake core record is linked to changes in climatic conditions over the last 14 ka. Multiple proxies for past climate are available, and a range of them are plotted in Fig. 7. The overall sequence of climatic change is well summarized by the oxygen isotope curve, reflecting long-term shifts between phases of wetter and drier hydro-climate. Periods of the most extreme dryness (i.e. most negative regional water balance) have been highlighted and are typically associated with peaks in Mg and/or dolomite, elevated DI-EC values, an absence of laminated sediments
and lowQuercus/chenopod ratios. During these periods, Nar
Lake would have been shallow, and its waters well mixed and strongly saline. By contrast, the wettest phases (also shown in Fig. 7) were characterized by calcite precipitation, high Ca/Sr ratios, a high percentage of planktonic diatoms,
laminated sediments and high Quercus/chenopod ratios. At
these times, Nar Lake would have been relatively deep and stratified, with dilute water chemistry and with the surround-ing hills well-wooded.
The basal part of the NAR10 sequence (units 6 and 7) covers the Lateglacial period, and indicates an initial phase of relatively deep-water conditions, with laminated sediments and an alternation between calcite and aragonite precipita-tion. By contrast, the surrounding landscape was open and steppic, with very limited tree cover. Chronologically, this phase corresponds to the latter part of the Bølling–Allerød
interstadial (¼Greenland Interstadial-1). During the
subse-quent phase (unit 6) laminations disappear, reflecting lake
shallowing, while d18O values increase from around 4 to
0‰, indicating a period of relative aridity. There is also a brief peak in dolomite precipitation and pollen show a strong
increase in Artemisiaand chenopods. However, diatoms do
not show any clear increase in halophytic taxa, nor do the ITRAX data indicate that there was any increase in catchment erosion. During this period, which coincides with the Younger Dryas stadial (Greenland Stadial-1), climatic con-ditions were probably both cold and dry.
The Pleistocene–Holocene transition is clearly registered in the NAR10 sequence, and shows a rapid climatic transition to wetter conditions. The subsequent period, from 11.4 to 9.45 ka BP, was one of relatively stable and humid climatic conditions (i.e. relatively high P/E), as indicated by negative
and the presence of finely laminated lake sediments. Detrital input was low, with laminae being composed of diatom frustules, endogenic calcite crystals and organic matter. In contrast to these physico-chemical indicators of climatic stability, biological indicators do show some changes during this period. Diatoms are dominated by planktonic or faculta-tively planktonic taxa, implying deep-water conditions, while pollen shows a gradual transition from grass steppe to oak–
Pistacia parkland. The lagged response to trees in inner Anatolia to climatic amelioration at the start of the Holocene is a widespread feature that has been much discussed in the
literature (Roberts et al., 2011; Asouti and Kabukcu, 2014;
Roberts, 2014). Although arboreal vegetation was not in equilibrium with climate for the opening part of the Holo-cene, the time lag for woodland re-advance at Nar was nonetheless much shorter than in eastern Anatolia and
north-west Iran, where it lasted up to four millennia (Djamaliet al.,
2010).
Between 9.45 and 8.1 ka BP (sub-unit 5a), the relatively wet Early Holocene period was interrupted by two phases of drier climate, as indicated by shifts in oxygen and carbon isotope composition, Ca/Sr ratios and a switch from calcite to aragonite precipitation. These dry phases appear to be broadly correlative with the 9.3- and 8.2-ka events recorded in Greenland ice cores, but they lasted significantly longer at
Nar (for further discussion see Deanet al., 2015b). The latter
may correspond to the Rapid Climate Change event described
by Rohling et al. (2002) in Aegean Sea core LC21. This
Neolithic period coincides with a ‘flooding phase’ on the
C¸ars¸amba river fan in the Konya plain, on which C¸atalho¨y€uk
is located (Boyeret al., 2006). These river floods were caused
by enhanced spring snowmelt, and might imply cold winters and increased snow cover, with less precipitation in other seasons. DI-EC at Nar Lake indicates higher inferred salinities,
associated with the planktonic taxonC. meneghiniana. While
this taxon has a high conductivity optimum in the European diatom database, it tolerates a wide range of alkalinity, and
other drivers of change can affect its abundance (Millset al.,
2014). C. meneghinianaalso increases at Nar at the time of
the Late Holocene Beys¸ehir Occupation phase of land-use
intensification, so this taxon may not have been responding only to changes in salinity. The early–mid Holocene increases in C. meneghiniana may therefore indicate at least in
parta response to non-climatic controls.
After 8.1 ka BP, limnological conditions changed once
more, with most proxies (e.g. d18O, Ca/Sr, calcite, DI-EC)
indicating a return to a wetter climate. Oak/chenopod ratios show their highest values of the entire record and oak woodland probably reached its maximum development at this time. Evidence suggests a very stable, well-vegetated landscape, minimal catchment disturbance and a ‘pristine’ lake, well-oxygenated with high water transparency and a diverse assemblage of periphytic as well as planktonic
diatoms. After7.5 ka BP, some indicators (e.g.d18O) show
a trend towards more arid conditions that continued until the end of unit 4 (6.5 ka BP).
Sedimentary and limnological conditions in unit 3 were radically different from those previously. Laminations are thick (1–5 mm per couplet) and rich in organic matter, but the lake was also clearly strongly saline, as indicated by a
dominance of halophytic diatom taxa such as A.
coffeaefor-mis and N. digitoradiata. Evaporated lake waters are also
indicated by strongly positive d18O values and low Ca/Sr
ratios, and these conditions continued through unit 2 and the lower part of unit 1. Within the overall period between 4.4 and 1.5 ka BP, two phases of extreme dryness stand out. The first of these covers the period from 4.3 to 3.7 ka BP, and is correlative with the widely recognized 4.2-ka dry event
(Cullen et al., 2000), while the second extends from 3.2 to
2.6 ka BP, and includes the ‘climatic crisis’ at the end of the
Bronze Age (Kaniewskiet al., 2015). The latter represents the
[image:10.595.51.549.54.342.2]most arid conditions during the last 14 ka at Nar, with largely non-laminated, highly compacted and cemented lake sedi-ments, indicative of a shallow, hyper-saline water body. After
1.5 ka BP, there was a rapid switch from dry to wetter
climatic conditions,i.e. an increase in P/E.
One important advantage of using multiple proxies is the possibility of comparing them to examine which trends are common. Although there is a high degree of similarity between the different proxies shown in Fig. 7, there are minor differences in the timing of changes between proxies, even where they might have been expected to correlate precisely (e.g. between Mg and dolomite). This highlights the dangers of relying on single proxies when attempting to identify rapid or short-lived palaeoclimatic events with sub-centennial chronological precision. The use of multiple proxies also allows ‘anomalous’ trends to be identified; for example, the oak/chenopod ratio at the start of the Holocene is out of line with other indicators, due to delayed re-advance of woodland.
Inter-site proxy comparison
Comparison of different proxies from a single site sequence provides one way of cross-validation in environmental
reconstruction; an alternative or additional approach is
to compare individual proxies between separate sites. This is attempted here using the composite Nar sequence compared to that from Eski Acıgo¨l, another maar lake located 25 km to the north. Individual proxies for the two sequences have been put on an independent timescale (i.e. with no tuning against each other) and plotted against each other for the last 14 ka (Fig. 8). If there is close correspondence between the two site records, this suggests that the proxy in question reflects regional-scale climatic and environmental changes, while a poor correspondence would imply the proxy has a strong, site-specific local component. A second reason why records might not agree is because of dating error and consequent miscorrelation. By contrast, this source of error would apply equally to all proxies and, as Fig. 8 shows, some proxies agree well between Nar and Eski Acıgo¨l, whereas others do not. In any case, dating error is more important for precise correlation of specific events than it is when comparing millennial-scale trends. Dating imprecision and sampling resolution does, however, make it difficult to undertake robust statistical correlation between records.
Of the different proxies shown in Fig. 8, the closest
[image:11.595.46.542.309.757.2]inter-site match is made byd18Ocarb. The two lakes’d18O records
are similar in terms of absolute isotopic values, long-term trends and also when matching specific events, such as the Lateglacial Stadial. This level of replication implies that their oxygen isotope profiles are likely to be a robust record of regional hydroclimatic change in central Anatolia during the Lateglacial and Holocene. Of course, the similarity in oxygen isotopes seen here does not apply to all lakes. If the
d18O records from these two maars were compared against
those of other eastern Mediterranean lakes with contrasting catchment morphology, then differences would be expected, as seen when comparing Eski Acıgo¨l with other sites in the
region (see Robertset al., 2008). For Nar and Eski Acıgo¨l, it is
clear that d18Ocarb carries a much clearer regional
hydro-climatic signal than do either d13Ccarb or d13Corg. Although
the carbon isotopes do include a climatic signature, they also contain a strong site-specific component in terms of carbon cycling, for example from deep geothermal sources. This explains why there are substantial offsets in absolute values
between d13C from Nar and Eski, even though trends are
often similar. Interestingly, the C/N ratio for the two sites shows similar trends and absolute values during the last 14 ka. From 12 to 9 ka BP, the C/N ratio at both sites is generally
>20. This then progressively declines to values of 10–15
between 4 and 1 ka BP, suggesting a regional shift from terrestrial to more algal sources of lake organic carbon through the Holocene (Meyers and Terranes, 2001). Either there was a long-term decline in soil and vegetation-derived organic material coming from the catchment, or there were more algae in the lake (e.g. linked to increased nutrients), or the ratio shift was caused by a combination of both factors.
While d18O may provide the best overall hydroclimatic
signal, in Nar and Eski Acıgo¨l it registers the most extreme phases of dryness less well. Instead these are identified in proxies specifically associated with highly evaporated lake waters, such as dolomite. Dolomite peaks occur in both lake
records between 4.4 and 1.5 ka BP, andalong with other
evidence imply that this time interval includes the driest
climatic conditions of the Holocene in the region. In contrast, there is a poor match between the two site records for calcite precipitation (Fig. 8a). Given that calcite matches well with other indicators of deep, dilute water conditions at Nar Lake, it seems probable that the Eski Acıgo¨l record is ‘anomalous’ in this regard. Calcite at Eski Acıgo¨l may be partly diagenetic, and in some cases it is associated with volcanic ash layers
(Robertset al., 2001). One further indication of past lake level
is provided by the presence of laminated sediments, reflecting lake waters that were sufficiently deep to allow stratification
(Ojalaet al., 2012). Both lakes deposited laminated sediments
during the first half of the Holocene, confirming this as a period of positive regional water balance. The synchronous ending of laminae formation at 6.5 ka BP in the two lakes was linked to falling regional water levels associated with the mid-Holocene climatic transition. Similarly, neither lake was stratified during the dry interval between 3.17 and 2.56 ka BP. Nar Lake deepened after this time, and it has deposited a continuous Late Holocene varve series, whereas Eski Acıgo¨l has remained shallow and its sediments have been non-laminated in recent millennia. Eski Acıgo¨l is smaller and almost certainly formed more recently than Nar, and it has become progressively infilled with sediment over the last
20 ka, leaving insufficient volume for a deep-water lake
even when climatic conditions permitted. Thus, while the presence of laminated sediments is a good indicator of deep-water conditions, their disappearance can be due to lake ontogeny as well as to climatic desiccation.
Biological indicators are compared in Fig. 8b. While the species composition of diatom assemblages in the two lakes
shows little overlap, there is a closer match when these data are transformed into DI-EC and aggregate life form; the former indicates lake salinity and the latter reflects lake water depth (e.g. via plankton/periphyton ratios). DI-EC shows a similar overall trend for the two records, with dilute lake waters during the Early Holocene and salinity levels reaching
a maximum between 5 and 1.5 ka BP. The NAR10 core
record shows an increase in DI-EC between 9.3 and 8 ka BP that is not shown at Eski Acıgo¨l. This increase is driven by the
centric taxon C. meneghiniana, often associated with
brack-ish waters, but here linked to catchment disturbance as well (see discussion above). The trend in the proportion of non-planktonic diatom taxa is similar between the two lake sequences, shifting from deep-water plankton dominance to
shallow-water benthos/periphyton dominance after8 ka BP.
However, comparison of the two sequences during the second half of the Holocene is hindered by the fact that diatom records are only partly complete, due to poor diatom preservation or sedimentary gaps. Figure 8b also compares biogenic Si (at Eski Acıgo¨l) with the Si/Ti ratio from Nar. Although these indices are based on different analytical methods, they both show a shift from greater abundance of diatom Si during the earlier part of both sequences to lower concentrations later in the Holocene (e.g. 3.5–1.3 ka BP). By contrast, the specific causes of these trends are probably not the same at the two lakes. At Eski Acıgo¨l, diatom silica was dissolved under highly saline–alkaline conditions at this time and recombined with Mg to form talc, whereas at Nar, biogenic Si was joined in the lake by non-biogenic Si linked to increased catchment erosion in the last 2.6 ka. There is no evidence of a similar Late Holocene increase in hillslope erosion at Eski Acıgo¨l where, for example, quartz has remained a very minor component of the lake sediments throughout.
For pollen, both lakes would have had primarily regional to extra-regional pollen recruitment areas, particularly Nar Lake which is 600–800 m in diameter. There are hills immediately south of Nar Lake, which supported woodland in the past, and which may have increased the share of AP at this site. Most of the major pollen taxa show good overall correspondence between the two sequences (Fig. 8b), imply-ing that they record faithfully regional-scale vegetation changes. The deciduous oak pollen curve is similar for Eski Acıgo¨l and Nar, although absolute per cent values are higher at the latter site, probably reflecting the proximity of wooded hills. One difference between the two records is the timing of
the mid-Holocene Quercusdecline, which appears to occur
800 years earlier in the Eski Acıgo¨l record. This apparent offset is probably an artefact of dating imprecision. The Eski Acıgo¨l pollen diagram was derived from a different core from that used for other proxies (e.g. isotopes, diatoms) at this site. Precise correlation between the two cores was achievable for the laminated part of the two Eski Acıgo¨l sequences before 6.5 ka BP, but not for the non-laminated part after this date
(see Roberts et al., 2001). Consequently there is some
uncertainty in absolute dating and correlation of the Eski Acıgo¨l pollen sequence during the second half of the
Holocene. The similarity of theQuercus curves for Nar and
Eski Acıgo¨l suggests that they are recording a synchronous regional decline in oak woodland cover, and that this decline occurred at the start of the second millennium BC rather than
during the early third millennium BC. Poaceae andArtemisia
show similar overall trends for the two records, including a peak in the latter during the Lateglacial Stadial, and a sharp
rise in the former (grass) at the start of the Holocene.Pistacia
significance of these vegetation phases. There are bigger
differences in the Pinus and chenopod records for Nar and
Eski Acıgo¨l, mainly in terms of per cent values rather than in long-term trends. Higher values of pine pollen at Eski Acıgo¨l suggest a more important long-distance pollen component here.
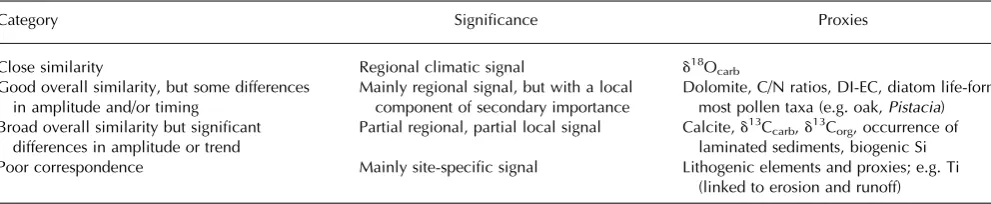
The inter-site comparison is summarized in Table 1, where different proxies have been put in different categories based
on the similarity in the two records. d18Ocarb provides the
reference for regional hydroclimatic reconstruction, while dolomite, C/N ratios, DI-EC, diatom life-form and most pollen taxa also register environmental changes at a wide spatial
scale. Some other proxies (e.g.d13Ccarb,d13Corg, biogenic Si)
contain significant local as well as regional signals, and on their own could be misinterpreted in terms of climatic history. Finally, lithogenic indicators reflect primarily site-specific conditions in these two lakes, and do not offer a reliable index of regional climatic change. Because ITRAX and other rapid methods of XRF were not widely available when the Eski Acıgo¨l cores were analysed in the laboratory, it is not possible to make a direct comparison between these and the NAR10 cores for erosion indicators. Nonetheless, it is clear that the Late Holocene increase in lithogenic elements at Nar Lake (e.g. Ti, Fig. 4) has no counterpart in the Eski Acıgo¨l sedimentary record. Lithogenic element concentrations or ratios (e.g. Ti/Ca) have increasingly been used as a proxy for runoff and rainfall in sedimentary records (e.g. Heymann
et al., 2013;Ulgen€ et al., 2012), but it is clear thatat least
in lakestheir explanation is catchment-specific rather than
universal. Their interpretation thus cannot be transferred directly from one basin to another. As with all proxies, lithogenic elemental flux must be understood within the context of each individual lake catchment ecosystem before their wider significance can be inferred.
Conclusions
The multi-proxy approach has rightly been applauded as a key way to achieve a ‘rounded’ reconstruction of past environmental conditions (Lotter, 2003). Combining this with a multi-site approach can offer additional insights, as we have tried to illustrate in this comparative study of two maar lake records. Overall, there is good coherence between the two records over the last 14 ka, but also some significant differences. Although numerous factors explain differences between the lake sediment records from Eski Acıgo¨l and Nar, two are of special importance. First, the Nar maar is larger in area and volume than that at Eski Acıgo¨l, and almost certainly significantly older. This has meant that basin infilling has led to a long-term trend towards lake shallowing at Eski Acıgo¨l unrelated to climate. Consequently this lake fails to register a shift from drier to wetter hydroclimatic conditions around 1.5 ka BP that is clearly evident at Nar. Eski Acıgo¨l therefore does not provide an accurate record of hydroclimatic changes in
the last two millennia. Ontogenetic changes in basin mor-phology are especially significant for interpreting proxies for lake water depth, including the presence or absence of laminated sediments, and diatom life-form (e.g. % plankton). Secondly, part of the Nar Lake catchment has been actively eroding in recent millennia, an acceleration in erosion that is not primarily climatic in origin. Eroded material has built up a fan-delta on the south side of the lake and has led to a significant component of lithogenic material within the lake’s Late Holocene sediments, mainly as turbidites. By contrast, the Eski Acıgo¨l maar has a small, relatively uneroded catchment and almost all of its sediments are authigenic rather than allogenic. For example, if the Ti signature for Nar Lake were used as a proxy for past climate (via runoff and precipitation), it would give an erroneous reconstruction, as other proxies and the neighbouring Eski Acıgo¨l sequence testify. Thus, just as multiple proxies can provide extra insights into long-term environmental dynamics and causal relations, so the examples discussed here provide evidence that multiple sites can enable regional and local-scale factors to be partitioned.
Supporting Information
Additional supporting information may be found in the online version of this article at the publisher’s web-site.
Figure S1. NAR10 composite master lithology and individual core sections.
Table S1. Description of NAR10 lithostratigraphic units.
Acknowledgments. We are delighted to dedicate this paper to Alayne Street-Perrott, whose contribution to Quaternary research has been of the highest scientific rigour. Her research has highlighted how lake sediments can be used as natural archives of earth system processes over millennial timescales, as exemplified by her investiga-tions of global silica cycling and the CO2fertilization hypothesis of
high-altitude tropical vegetation. N.R. and S.M. had the good fortune to work with Alayne linked to the Global Lake Level Database, which she had established in the late 1970s. This formed a key pillar of the pioneering data-model inter-comparison programme, COHMAP, funded by the US Department of Energy CO2research programme
[image:13.595.47.543.65.167.2]during the pre-IPCC era when human-induced climate change was not yet recognized as a reality. Among the outcomes of our work was the recognition in the African lake-level record (Street-Perrott and Roberts, 1983; Street-Perrottet al., 1985) of what is now known as the 8.2-ka climatic event more than a decade before it was identified in Greenland ice cores. Alayne thank you. The Nar Lake drilling project was supported by funding from the British Institute in Ankara, the National Geographic Committee for Research and Exploration, and from Plymouth University. Isotope work was funded by NIGFSC grants IP/1198/1110 and IP/1237/0511 to M.D.J., by NERC grant NE/ J012920/1 to N.R., and J.R.D. was supported by NERC PhD student-ship NE/I528477/1. We are grateful to Applied Acoustics Ltd for loan of seismic survey equipment, and to the Turkish Ministry of
Table 1. Categories of similarity for different proxies between two Cappadocian lake sediment records (Eski Acıgo¨l and Nar).
Category Significance Proxies
Close similarity Regional climatic signal d18Ocarb
Good overall similarity, but some differences in amplitude and/or timing
Mainly regional signal, but with a local component of secondary importance
Dolomite, C/N ratios, DI-EC, diatom life-form, most pollen taxa (e.g. oak,Pistacia) Broad overall similarity but significant
differences in amplitude or trend
Partial regional, partial local signal Calcite,d13Ccarb,d13Corg, occurrence of
laminated sediments, biogenic Si Poor correspondence Mainly site-specific signal Lithogenic elements and proxies; e.g. Ti
Environment and Forests for research permission. We also thank the Belediye and Muhtar of Nar ko¨y and Sofular. Additional team members for 2010 included seismic team Gwyn Jones and Ryan Smith (Plymouth), Ersin Ates¸(Ankara University), Ceran S¸ekeryapan (then at METU) and C¸etin S¸enkul (formerly Afyon University, now Isparta University). Stephen Noble, Hilary Sloane, Diana Sahy, Henry Lamb, Mike Marshall, Greg Busby and Andy Moss provided laboratory assistance and useful discussions.
Abbreviations.AP, arboreal pollen; CONISS, constrained incremental sum-of-squares cluster analysis; DI-EC, diatom-inferred electrical conductivity; Inc/Coh, incoherence/coherence; XRF, X-ray fluores-cence.
References
Allcock SL. 2013. Living with a changing landscape: Holocene climate variability and socio-evolutionary trajectories, central Turkey. PhD thesis, Plymouth University.
Allcock SL, Roberts N. 2014. Changes in regional settlement patterns in Cappadocia (central Turkey) since the Neolithic: a combined site survey perspective.Anatolian Studies64: 33–57 [DOI: 10.1017/ S0066154614000040].
Asouti E, Kabukcu C. 2014. Holocene semi-arid oak woodlands in the Irano-Anatolian region of Southwest Asia: natural or anthropo-genic?Quaternary Science Reviews90: 158–182 [DOI: 10.1016/j. quascirev.2014.03.001].
Barber K, Dumayne-Peaty L, Hughes P et al. 1998. Replicability and variability of the recent macrofossil and proxy-climate record from raised bogs: field stratigraphy and macrofossil data from Bolton Fell Moss and Walton Moss, Cumbria, England.Journal of Quaternary Science13: 515–528.
Battarbee RW, Jones VJ, Flower RJ. 2001. Diatoms. In Tracking Environmental Change Using Lake Sediments. Chimia Vol. 3: Terrestrial, Algal and Siliceous Indicators, Smol J (ed,). Kluwer Academic Publishers: Dordrecht; 155–202.
Boyer P, Roberts N, Baird D. 2006. Holocene environment and settlement on the C¸ars¸amba alluvial fan, south-central Turkey: Integrating geoarchaeology and archaeological field survey. Geo-Archaeology21: 675–698 [DOI: 10.1002/gea.20133].
Burnett AP, Soreghan MJ, Scholz CA et al. 2011. Tropical East African climate change and its relation to global climate: a record from Lake Tanganyika, tropical east Africa, over the past 90þkyr.
Palaeogeography Palaeoclimatology Palaeoecology303: 155–167 [DOI: 10.1016/j.palaeo.2010.02.011].
Busby GW. 2011.Diatoms as a record of Holocene climate change in the Mediterranean using cores from Nar Crater Lake, Turkey. MSc dissertation, University of Plymouth.
Carter T. 2011. A true gift of mother earth: the use and significance of obsidian at C¸atalho¨y€uk.Anatolian Studies61: 1–19 [DOI: 10.1017/ S0066154600008759].
Charman DJ. 2010. Centennial climate variability in the British Isles during the mid-late Holocene. Quaternary Science Reviews 29: 1539–1554 [DOI: 10.1016/j.quascirev.2009.02.017].
Cohen AS. 2003.Paleolimnology: the History and Evolution of Lake Systems. Oxford University Press: Oxford.
Cook ER, Kairiukstis LA, editors. 1990. Methods of Dendrochronol-ogy. Kluwer: Dordrecht.
Croudace IW, Rindby A, Rothwell RG. 2006. ITRAX: description and evaluation of a new multi-function X-ray core scanner.Geological Society, London, Special Publications267: 51–63 [DOI: 10.1144/ GSL.SP. 2006.267.01.04].
Cullen HM, DeMenocal PB, Hemming S et al. 2000. Climate change and the collapse of the Akkadian empire: evidence from the deep sea.Geology28: 379–382 [DOI: 10.1130/0091-7613(2000) 028<0379:CCATCO>2.3.CO;2].
Daley TJ, Thomas ER, Holmes JA et al. 2011. The 8200 yr BP cold event in stable isotope records from the North Atlantic region.
Global and Planetary Change 79: 288–302 [DOI: 10.1016/j. gloplacha.2011.03.006].
Dean JR. 2014. Stable isotope analysis and U–Th dating of Late Glacial and Holocene lacustrine sediments from Central Turkey. PhD thesis, Nottingham University.
Dean JR, Eastwood WJ, Roberts N et al. 2015a. Tracking the hydro-climatic signal from lake to sediment: a field study from central Turkey. Journal of Hydrology 529: 608–621 [DOI: 10.1016/j. jhydrol.2014.11.004].
Dean JR, Jones MD, Leng MJ et al. 2015b. Eastern Mediterranean hydroclimate over the late glacial and Holocene, reconstructed from the sediments of Nar Lake, central Turkey, using stable isotopes and carbonate mineralogy. Quaternary Science Reviews
124: 162–174 [DOI: 10.1016/j.quascirev.2015.07.023].
Djamali M, Akhani H, Andrieu-Ponel V et al. 2010. Indian Summer Monsoon variations could have affected the early-Holocene woodland expansion in the Near East. Holocene 20: 813–820 [DOI: 10.1177/0959683610362813].
Dypvik H, Harris NB. 2001. Geochemical facies analysis of fine-grained siliciclastics using Th/U, Zr/Rb and (ZrþRb)/Sr ratios.
Chemical Geology181: 131–146 [DOI: 10.1016/S0009-2541(01) 00278-9].
England A, Eastwood WJ, Roberts CN et al. 2008. Historical landscape change in Cappadocia (central Turkey): a palaeoecolog-ical investigation of annually laminated sediments from Nar lake.
Holocene18: 1229–1245 [DOI: 10.1177/0959683608096598]. Faegri K, Iverson J. 1989. Textbook of Pollen Analysis. Wiley:
Chichester.
Gevrek A, Kazanci N. 2000. A Pleistocene, pyroclastic-poor maar from central Anatolia, Turkey: influence of a local fault on a phreatomagmatic eruption. Journal of Volcanology and Geother-mal Research95: 309–317.
Grimm EC. 2004. TGVIEW version 2.0.2. (computer software). Illinois State Museum. Research and Collections Center: Springfield, IL. Heymann C, Nelle O, Do¨rfler W et al. 2013. Late Glacial to
mid-Holocene palaeoclimate development of Southern Greece inferred from the sediment sequence of Lake Stymphalia (NE-Peloponnese).Quaternary International302: 42–60 [DOI: 10.1016/ j.quaint.2013.02.014].
Hodder I. 2014. C¸atalho¨y€uk: the leopard changes its spots. A summary of recent work. Anatolian Studies 64: 1–22 [DOI: 10.1017/S0066154614000027].
Horton TW, Defliese WF, Tripati AK et al. 2016. Evaporation induced
18
O and13C enrichment in lake systems: a global perspective on hydrologic balance effects. Quaternary Science Reviews 131: 365–379 [DOI: 10.1016/j.quascirev.2015.06.030].
Jenkins R. 1999.X-Ray Fluorescence Spectroscopy, 2nd edn. Wiley: New York.
Jones MD. 2004. High-resolution records of climate change from lacustrine stable isotopes through the last two millennia in western Turkey. PhD thesis, University of Plymouth.
Jones MD, Leng MJ, Roberts CN et al. 2005. A coupled calibration and modelling approach to the understanding of dry-land lake oxygen isotope records. Journal of Paleolimnology 34: 391–411 [DOI: 10.1007/s10933-005-6743-0].
Jones MD, Roberts CN, Leng MJ et al. 2006. A high-resolution late Holocene lake isotope record from Turkey and links to North Atlantic and monsoon climate. Geology 34: 361–364 [DOI: 10.1130/G22407.1].
Juggins S. 2003–2006.C2 Data Analysis: Version 1.4.3. University of Newcastle.
Juggins S. 2015. European Diatom Database. [Online: http://craticula. ncl.ac.uk/Eddi/jsp/index.jsp].
Kaniewski D, Guiot J, van Campo E. 2015. Drought and societal collapse 3200 years ago in the Eastern Mediterranean: a review.
WIREs Climate Change6: 369–382 [DOI: 10.1002/wcc.345]. Krammer K, Lange-Bertalot H. 1991a. Bacillariophyceae 3. Teil
Centrales, Fragilariaceae, Eunotiaceae, Ettl H, G€artner G, Gerloff J, Heynig H, Mollenhauer D (eds). Gustav Fischer Verlag: Berlin. Krammer K, Lange-Bertalot H. 1991b. Bacillariophyceae 4. Teil
Achnanthaceae Kritische Erg€anzungen zu Navicula (Lineolatae) und Gomphonema, Ettl H, G€artner G, Gerloff J, Heynig H, Mollenhauer D (eds). Gustav Fischer Verlag: Berlin.
Krammer K, Lange-Bertalot H. 1997a. Bacillariophyceae 1. Teil Naviculaceae, Ettl H, G€artner G, Gerloff J, Heynig H, Mollenhauer D (eds). Gustav Fischer Verlag: Berlin.