A multi-layer network approach to MEG connectivity analysis
Matthew J. Brookes
a,⁎
, Prejaas K. Tewarie
a, Benjamin A.E. Hunt
a, Sian E. Robson
a, Lauren E. Gascoyne
a,
Elizabeth B. Liddle
b, Peter F. Liddle
b, Peter G. Morris
a aSir Peter Mansfield Imaging Centre, School of Physics and Astronomy, University of Nottingham, University Park, Nottingham NG7 2RD, United Kingdom b
Centre for Translational Neuroimaging in Mental Health, Institute of Mental Health, School of Medicine, University of Nottingham, Jubilee Campus, Triumph Road, Nottingham NG7 2TU, United Kingdom
a b s t r a c t
a r t i c l e i n f o
Article history:
Received 10 September 2015 Accepted 15 February 2016 Available online 22 February 2016
Recent years have shown the critical importance of inter-regional neural network connectivity in supporting healthy brain function. Such connectivity is measurable using neuroimaging techniques such as MEG, however the richness of the electrophysiological signal makes gaining a complete picture challenging. Specifically, connec-tivity can be calculated as statistical interdependencies between neural oscillations within a large range of differ-ent frequency bands. Further, connectivity can be computed between frequency bands. This pan-spectral network hierarchy likely helps to mediate simultaneous formation of multiple brain networks, which support on-going task demand. However, to date it has been largely overlooked, with many electrophysiological functional connectivity studies treating individual frequency bands in isolation. Here, we combine oscillatory envelope based functional connectivity metrics with a multi-layer network framework in order to derive a more complete picture of connectivitywithinandbetweenfrequencies. We test this methodology using MEG data recorded dur-ing a visuomotor task, highlightdur-ing simultaneous and transient formation of motor networks in the beta band, visual networks in the gamma band and a beta to gamma interaction. Having tested our method, we use it to demonstrate differences in occipital alpha band connectivity in patients with schizophrenia compared to healthy controls. We further show that these connectivity differences are predictive of the severity of persistent symp-toms of the disease, highlighting their clinical relevance. Ourfindings demonstrate the unique potential of MEG to characterise neural network formation and dissolution. Further, we add weight to the argument that dysconnectivity is a core feature of the neuropathology underlying schizophrenia.
© 2016 The Authors. Published by Elsevier Inc. This is an open access article under the CC BY license (http://creativecommons.org/licenses/by/4.0/). Keywords:
Multi-layer networks Magnetoencephalography MEG
Functional connectivity Neural oscillations Schizophrenia Visual cortex Motor cortex
Introduction
A core feature of healthy human brain function involves the recruit-ment of multiple spatially separate and functionally specialised cortical regions, which are required to support ongoing task demand. Such inter-areal connectivity has been shown to be a consistent feature of measured brain activity, even when the brain is apparently at rest (Beckmann et al., 2005; Biswal et al., 1995). Moreover, significant evi-dence shows that this network formation is altered in pathologies rang-ing from developmental disorders (e.g. Attention Deficit/Hyperactivity Disorder (Liddle et al., 2011)) to neurodegenerative disease (e.g. Parkinson's disease (Tessitore et al., 2012)) making it a critically impor-tant area of study. Measurement and characterisation of networks of functional connectivity is a focus of many neuroimaging studies, and re-cent years have seen rapid advances in the use of magnetoencephalog-raphy (MEG) for this purpose (Engel et al., 2013; Hall et al., 2014; O'Neill et al., 2015a; Scholvinck et al., 2013). MEG (Cohen, 1972) assesses
electrical activity in the human brain, based upon measurement of changes in magneticfield above the scalp induced by synchronised neu-ral currentflow. MEG offers non-invasive characterisation of brain elec-trophysiology with excellent temporal resolution. In addition, recent improvements in modelling the spatial topographies of scalp level field patterns allow for spatial resolution on a millimetre scale (Troebinger et al., 2014). This unique combination of high spatial and temporal resolution, coupled with the direct inference on brain electro-physiology, makes MEG a highly attractive option for connectivity mea-surement, particularly given recentfindings that dynamic changes in connectivity occur on a rapid (potentially millisecond) timescale (Baker et al., 2012; Baker et al., 2014; Hutchison et al., 2013; O'Neill et al., 2015b).
Despite its excellent promise, MEG based characterisation of connectivity is complicated by the rich information content of electro-physiological signals. MEG measurements are dominated by neural os-cillations (rhythmic changes in electrical potential synchronised across cell assemblies) which occur at multiple temporal scales, ranging from 1 Hz to ~200 Hz. These oscillations have been shown to be integrally in-volved in mediating long range interactions across the cortex (Brookes ⁎ Corresponding author.
E-mail address:[email protected](M.J. Brookes).
http://dx.doi.org/10.1016/j.neuroimage.2016.02.045
1053-8119/© 2016 The Authors. Published by Elsevier Inc. This is an open access article under the CC BY license (http://creativecommons.org/licenses/by/4.0/). Contents lists available atScienceDirect
NeuroImage
et al., 2011; de Pasquale et al., 2010; Hipp et al., 2012; Marzetti et al., 2013). However, many studies probe only single frequency bands in iso-lation without reference to a bigger‘pan-spectral’picture. In addition, the richness of the signal facilitates multiple independent measures of functional connectivity (Scholvinck et al., 2013). These includefixed phase relationships between band limited oscillations (Nolte et al., 2004; Stam et al., 2007), as well as synchronisation between the ampli-tude envelopes of the same band limited oscillations (Brookes et al., 2011; Hipp et al., 2012). Furthermore, evidence shows that in addition to neural interactions within specific frequency bands, connectivity may also be mediated by between frequency band interactions. These might include synchronisation of oscillatory envelopes (Furl et al., 2014) as well as an influence of low frequency phase in one region, on high frequency amplitude in another region (or vice versa) (Canolty et al., 2006; Canolty et al., 2010; Florin and Baillet, 2015). Ongoing men-tal activity certainly necessitates the simultaneous formation of multi-ple networks of communication and it seems likely that the brain employs multiple frequency bands, as well as cross frequency interac-tions and potentially independent modes of connectivity (e.g. phase versus amplitude) in order to achieve this. It therefore follows that a sin-gle framework in which to combine pan-spectral and cross frequency interactions to assess the efficiency of the brain as a single multi-dimensional network would be highly desirable.
A potential solution to this problem is a multi-layer network. This concept, which is well studied in physics (see e.g. (De Domenico et al., 2014; Zanin, 2015)), can be understood using the simple example of a transport network. An individual can move between European cities in multiple ways, including by air, rail or road. These three modes of transport can be represented by three seemingly independent net-works, with the network nodes being different cities, and the strength of connections between them (i.e. the edges) representing the number of aircraft, trains, or cars that travel between them each day. In order to determine the efficiency of the system, it may be tempting to analyse each network (air, rail, road) in isolation. However, to understand the overall picture, one must also realise that each network depends criti-cally on the other two. For example, a broken rail link between Notting-ham and London would increase road traffic between the two cities, and might decrease passengers onflights from London airports. For this rea-son, a multi-layer network model is required which characterises the three separate networks (air, rail and road) as individual layers in the model, and also measures the dependencies between these networks as between layer interactions. This model allows a more complete char-acterisation of the overall transport system, taking into account all modes of transport and their interdependencies. This multi-layer framework has been applied to many complex systems, including the human brain. Here we aim to apply it to MEG derived functional connectivity.
In this paper, we use envelope correlation as a means to quantify connectivity between spatially separate brain regions. This metric has been used extensively in recent years (Engel et al., 2013; Hall et al., 2014; O'Neill et al., 2015a) and has been described as an‘intrinsic mode’of functional coupling in the human brain (Engel et al., 2013). We estimate‘all-to-all’connectivity between a-priori defined brain re-gions, which are based on an atlas (Tzourio-Mazoyer et al., 2002). Con-nectivity is estimated within multiple separate frequency bands and these within frequency band interactions define the separate layers in the model (i.e. a single layer is constructed for the alpha, beta and gamma bands independently—these are analogous to the separate road, rail, and air networks described above). Connectivity is also esti-mated between frequency bands; for example, we might measure cor-relation between the alpha envelope of brain region 1, and the gamma envelope of brain region 2. This forms the between layer interactions (analogous to interactions between transport modalities (e.g. air to road) in the above example). In this way we aim to form a more com-plete picture of the brain as a multi-layer dynamic system. In what fol-lows we will test our multi-layer approach on MEG data recorded
during a simple visuo-motor task. Further, we will use the same frame-work to identify perturbed netframe-work formation in patients with Schizophrenia.
Methods
Data collection
All data used in this study were acquired as part of the University of Nottingham's Multi-modal Imaging Study in Psychosis (MISP; see also Acknowledgements) and have been described in a previous paper (Robson et al., in press). The study received ethical approval from the National Research Ethics Service and all participants gave written in-formed consent prior to taking part. 23 healthy control subjects (17 male) with no history of neurological illness were recruited to the study. An equal number of patients with schizophrenia were also re-cruited with the two groups matched for age (Patients: 27 ± 7; Controls 27 ± 7), sex and socio-economic background. In order to derive a score for overall severity of psychotic illness in the patients, the three charac-teristic syndromes of schizophrenia (reality distortion, psychomotor poverty and disorganization) were quantified (using the signs and symptoms of psychotic illness (Liddle et al., 2002), speed of cognitive processing assessed using a variant of the Digit Symbol Substitution Test and scores from the Social and Occupational Function Scale, respec-tively). These measurements were combined in a principal component analysis and thefirst principal component was extracted to give a single score representing the severity of the persistent symptoms of schizo-phrenia for each patient. We have demonstrated previously that this first component is a suitable measure of severity of residual illness that correlates with several measures of brain function (Palaniyappan et al., 2013; Robson et al., in press).
All subjects completed a visuomotor task. The paradigm comprised visual stimulation with a centrally-presented maximum contrast verti-cal square wave grating (3 cycles per degree). The grating subtended a visual angle of 8° and was displayed along with a redfixation cross on a grey background. In a single trial, the grating was presented for 2 s followed by a 7 s baseline period where only thefixation cross was shown. During presentation, participants were instructed to repeatedly press a button with the indexfinger of their right hand. Participants could press the button as many times as they wanted during the stimu-lus. A total of 45 trials was used, giving a total experimental time of 7 min. Visual stimuli were back-projected via a mirror system onto a back projection screen inside a magnetically shielded room at a viewing distance of approximately 46 cm. Button presses were recorded using a response pad.
coregistration was employed in all subsequent forward and inverse problem calculations.
Data analysis
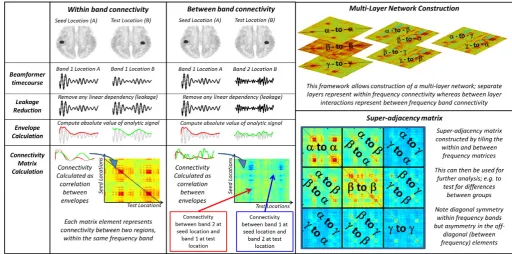
MEG data were initially inspected visually. Any trials deemed to con-tain an excessive amount of interference, for example generated by eye movement or muscle activity, were removed from that individual's data. In addition, any trials in which the head was found to be more than 7 mm (Euclidean distance) from the starting position were excluded. Following this pre-processing, data were analysed using beamforming for source localisation, and a multi-layer network frame-work (see alsoFig. 1).
AAL atlas and source localisation
In order to calculate a whole cortex representation of functional con-nectivity, the cortex wasfirst parcellated into 78 individual regions ac-cording to the automated anatomical labelling (AAL) atlas ( Tzourio-Mazoyer et al., 2002). Note that these same cortical regions have been used successfully in previous MEG connectivity studies (see e.g. (Tewarie et al., 2014)). A beamformer spatial filtering approach (Robinson and Vrba, 1998) was then employed to generate a single sig-nal representative of electrophysiological activity within each of these 78 regions. To achieve this, for each region, the centre of mass was de-rived. Voxels were also defined on a regular 4 mm grid covering the en-tire region, and the beamformer estimated timecourse of electrical activity derived for each voxel. To generate a single regional timecourse, Q̂RðtÞ, individual voxel signals were weighted according to their
dis-tance from the centre of mass such that,
Q̂Rð Þ ¼t X
iexp −
r2 i .
400
Q̂ið Þt ð1Þ
whereirepresents a count over all voxels within the AAL region,Q̂iðtÞ
represents the beamformer projected timecourse for voxeli, andri de-notes the distance (measured in millimetres) from voxelito the centre of mass of the region. Note that the Gaussian weighting function
ensures that the regional timecourseQ̂RðtÞis biased towards the centre
of the region. The full width at half maximum of the weighting was ~ 17 mm; this was chosen to reflect the approximate spatial scale of the AAL regions.
To calculate the individualQ̂iðtÞ, a scalar variant of beamforming was
employed (Robinson and Vrba, 1998). Covariance was computed within a 1 Hz–150 Hz frequency window and a time window spanning the whole experiment in order to minimise covariance matrix error (Brookes et al., 2008). Regularisation was applied to the data covariance matrix using the Tikhonov method with a regularisation parameter equal to 5% of the maximum eigenvalue of the unregularised covariance matrix. The forward model was based upon a dipole approximation (Sarvas, 1987) and a multiple local sphere head model (Huang et al., 1999). Dipole orientation was determined using a non-linear search for optimum signal to noise ratio (SNR). Beamformer timecourses were signflipped where necessary in order to account for the arbitrary polarity introduced by the beamformer source orientation estimation.
Regional changes in source amplitude
[image:3.595.43.556.463.717.2]Application of the beamforming method to each AAL region yielded 78 regional timecourses and we initially aimed to assess which of those timecourses (hence regions) exhibited a significant task induced re-sponse. Regional timecourses were frequencyfiltered into four separate frequency bands; alpha (α) (8 Hz–13 Hz), beta (β) (13 Hz–30 Hz), low gamma (γL) (30 Hz–50 Hz) and high gamma (γH) (50 Hz–100 Hz). The resulting timecourses were then Hilbert transformed in order to gener-ate the analytic signal. The absolute value of the analytic signal was then computed to yield the amplitude envelope (henceforth termed the Hil-bert envelope) of each timecourse. HilHil-bert envelopes were averaged across trials. In order to determine the AAL regions that exhibited a sig-nificant task related power change, the fractional change in oscillatory amplitude (for all frequency bands and regions) was measured between a‘stimulus’window [0 sbtb2 s] and a‘rebound’window [2 sbtb4 s]. (These windows were chosen to give maximum contrast in the motor system, since the stimulus window will centre on movement related beta power decrease whereas the rebound window will centre on the
Fig. 1.Schematic diagram of the connectivity data analysis pipeline including construction of a multi-layer network. Note that, in our actual analysis, the gamma band was split into two,
post movement beta rebound.) The statistical significance of the frac-tional change between windows was determined using a two-sided signed rank test of the null hypothesis that the change in Hilbert enve-lope (measured independently in 23 subjects) originated from a distri-bution whose median is zero. The threshold for significance (pb0.05) was Bonferroni corrected to account for multiple comparisons across all 78 regions. In four AAL regions of interest (left sensorimotor cortex, right sensorimotor cortex, left primary visual cortex and right primary visual cortex) a time frequency spectrogram was generated. Again this employed the Hilbert transform, however in order to increase spectral resolution, Hilbert envelopes were generated in 33 overlapping fre-quency bands in the 1 Hz to 150 Hz range. Hilbert envelopes were aver-aged across all trials and then concatenated in the frequency dimension to form a time-frequency spectrogram (TFS) for the average trial. These TFSs were then averaged across subjects.
The multi-layer model: Leakage correction, muscle artifact reduction, and connectivity estimation
The overall aim of our connectivity analysis was twofold. First, to ex-amine significant changes in functional connectivity induced by the visuomotor task in healthy individuals. Second, to probe differences in functional connectivity between schizophrenia patients and controls. To achieve these aims, all connectivity analyses were applied within predefined time windows, on a trial by trial basis, using unaveraged beamformer projected data (i.e. following beamforming we measured amplitude envelope correlation within specific time windows for each trial, and then averaged these connectivity estimates across trials. Time windows were defined as follows:
• To examine task induced change in healthy controls, we measured connectivity within an active [0 sbtb4 s] window and a control [4.5 sbtb8.5 s] window; contrasting the two windows in order to de-rive significant connectivity change. Note that the active window was selected such that it encompassed both the stimulus, and any post stimulus response (e.g. the rebound in the motor regions). In addition, note that the longer the time window used, the more reliable the con-nectivity estimate becomes. For this reason the two windows were made as long as possible and equal in length to allow for robust and unambiguous contrast.
• To compare controls to patients with schizophrenia, we measured connectivity across the whole trial using a [0 sbtb8.5 s] window. This was done separately in the two groups (patients and controls) and results compared.
In all cases, functional connectivity was computed between every pair of AAL regions (henceforth known as the seed and the test region). Regional timecourses were again frequencyfiltered into four separate frequency bands; alpha (α) (8 Hz–13 Hz), beta (β) (13 Hz–30 Hz), low gamma (γL) (30 Hz–50 Hz) and high gamma (γH) (50 Hz– 100 Hz). These bands were chosen based upon previous literature; spe-cifically, previous work has shown robust effects in visual cortex in the alpha and gamma bands (Brookes et al., 2005; Zumer et al., 2010) as well as robust effects in motor cortex in the beta band (Stancak and Pfurtscheller, 1995; Stevenson et al., 2011). A schematic diagram of the multi-layer framework is shown inFig. 1; note however that for simplicity we only depict 3 frequency bands.
Estimation of electrophysiological functional connectivity is non-trivial and warrants some discussion. The most significant con-found in MEG connectivity analysis is that of signal leakage between beamformer projected timecourses. This is generated as a result of the ill-posed inverse problem and means that projected timecourses can be artifactually correlated. This problem, and associated solutions, have been well documented in the literature (Brookes et al., 2012; Colclough et al., 2015; Hipp et al., 2012; Maldjian et al., 2014; O'Neill et al., 2015a). Here we employed a pairwise leakage reduction scheme
(Brookes et al., 2012; Hipp et al., 2012) which exploits the fact that leak-age manifests as zero-time lag correlation between beamformer projected timecourses from separate regions. Such zero-time lag linear dependency was removed using linear regression to ensure that, prior to connectivity estimation, the underlying band limited windowed sig-nals were orthogonal. It is important to note that, in studies of this type where separate time windows are to be compared, orthogonalisation must be carried out on each window separately, rather than on the whole timecourse, since task induced changes in signal variance can also introduce significant changes in the magnitude of leakage (see the analytical analysis in the supplementary information from (O'Neill et al., 2015b)).
Following leakage reduction, the Hilbert envelope was computed for the orthogonalised seed and test timecourses. In addition to leakage, ar-tifacts due to muscle activity were also a concern, particularly for high gamma band connectivity estimation. It is well known that increased muscle activity in, for example, the jaw or neck, generates increased os-cillatory signals in the high gamma band. Such artifacts are typically bi-lateral and can cause spurious inflation of interhemispheric gamma envelope correlation. For this reason, the regional beamformed timecourses were alsofiltered into the 120 Hz–150 Hz band. This band was deemed to be higher than any neural activity of interest but would accurately capture any artifacts resulting from the magnetomyogram. Prior to calculation of connectivity, the Hilbert enve-lope of these magnetomyogram data was computed and regressed from both the seed and test timecourses (independently for each trial) in order to reduce the influence of muscle artifact on functional connectiv-ity measurement (see also (O'Neill et al., 2015b) who use a similar method).
Following leakage and magnetomyogram reduction, connectivity was calculated between windowed timecourses as the Pearson correla-tion coefficient between windowed oscillatory envelopes in the seed and test regions. As noted above, correlation coefficients were comput-ed within each time window, and each trial separately, and the mean correlation coefficient over all trials computed. This same procedure was applied:
1. Within each frequency band (i.e. within the alpha, beta, low gamma and high gamma bands) and between each region pair. This generat-ed four 78 × 78 adjacency matrices (AMs) showing inter-regional connectivity for each of the four bands separately. These formed the 4 separate layers of the multi-layer model (see the“within band connectivity”column ofFig. 1).
2. Between each pair of frequency bands (i.e. beta, alpha-to-low-gamma, alpha-to-high-gamma, alpha-to-low-gamma, beta-to-high-gamma and low-gamma-to-beta-to-high-gamma) and between each region pair. This generated a further six 78 × 78 AMs showing inter-regional connectivity for each of the six frequency band pairs. These formed the between layer interactions of the multi-layer model (see the“between band connectivity”column ofFig. 1).
diagonal tiles (between frequency AMs). This is because a high correla-tion between, for example, visual alpha and motor gamma does not nec-essarily imply a high correlation between visual gamma and motor alpha.
The multi-layer model: statistical testing for task induced connectivity changes
To test for an effect of the visuomotor task on connectivity, we contrasted SMs measured in the [0 s b t b 4 s] active and the [4.5 sbtb8.5 s] control time windows. This was done via subtraction, generating a single matrix for each subject showing the difference in connectivity between time windows. These difference-SMs (dSMs) were then averaged across subjects. In order to assess statistical signifi -cance, a permutation test was employed (Nichols and Holmes, 2001). It was reasoned that if the task had no effect, then the labelling of the two time windows (active or control) would have no meaning. For each el-ement in the SM, we therefore constructed a null distribution. This was calculated via the generation of multiple‘sham’dSMs where the win-dow labels were switched randomly. 20,000 sham matrices were con-structed and a null distribution of connectivity differences derived. For each dSM element, the‘real’difference between windows was com-pared to the null distribution and a p-value generated. In order to cor-rect for type I errors due to multiple comparisons across matrix elements, we applied a false discovery rate (FDR) correction based on the Benjamini–Hochberg procedure. This procedure resulted in a thresholded dSM showing which connectivity values in the dSM were modulated significantly by the task.
The multi-layer model: testing for differences in patients with schizophrenia
In the case of testing for effects of schizophrenia on connectivity, we employed SMs generated using a single time window spanning the whole trial [0 sbtb8.5 s]. In order to probe the relevance of our con-nectivity measurements to schizophrenia, two tests were used.
• First it was reasoned that if connectivity was abnormal in schizophre-nia, then a difference between mean connectivity values across the patient and control groups would be observed. This is henceforth termed theeffect of diagnosisand was measured by subtraction of pa-tient and control SMs.
• Second, it was reasoned that if such a difference was meaningful clin-ically, then connectivity values measured within individual patients would correlate significantly with their severity of symptoms (mea-sured behaviourally—see above). This is henceforth termedeffect of severityand was measured, on an element by element basis, by Pear-son correlation (across all 23 patients) between severity and estimat-ed connectivity in each element of the SM.
These two tests yield two new matrices, both equal in size to the SM, which represent theeffect of diagnosisand theeffect of severity.
Under a null hypothesis that there is no systematic effect of either di-agnosis or severity on functional connectivity measurements, then it would be predicated that there would be no significant relationship, across elements, between matrices representing diagnosis and severity. However, if the MEG connectivity measures are truly descriptive of schizophrenia, then those matrix elements most affected by the pa-tient–control difference might be expected to be the same elements that are most correlated with severity. Hence a relationship between the diagnosis and severity matrices would be observed. With this in mind, we measured correlation across matrix elements, on a‘ tile-by-tile’basis (henceforth termedtile correlation). (In other words, wefirst correlate elements from the tile representing alpha-to alpha connectiv-ity, then do the same thing with the tile representing alpha to beta con-nectivity, and so on, for all 10 independent tiles.) To test this statistically we used a permutation test. First, patient/control labels were switched
randomly and a new average difference between sham groups comput-ed. (This was based on the assumption that if diagnosis has no effect on connectivity then patient and control labels would be meaningless). Second, the individual patient disease severity scores were randomised across subjects and the correlation with connectivity score recomputed. (Based on the assumption that if connectivity had no effect on severity then the re-ordering of the severity scores would have no effect). This yielded two‘sham’matrices which could be compared, and again we measured tile correlation. 10,000 iterations of this test were used to generate a null distribution and comparison with the‘real’tile correla-tion value yielded a probability that the result occurred by chance. We used a two tailed test: meaning that we allow the possibility that those patients with the worst symptoms could look more like controls than patients with lesser symptoms—though apparently counter-intuitive such an effect is conceivable and could result from compensa-tion mechanisms. Finally, since testing each tile individually led to 10 separate tests, Bonferroni correction was performed. Statistical signifi -cance was therefore defined at a threshold of p b0.05, which is corrected to pb0.0025 to account for the two tailed test and 10 separate comparisons. Anything at pb0.025 (i.e. uncorrected for multiple com-parisons) was considered a‘trend’. It should be noted here that, in prin-ciple, a standard parametric test (distinct from our permutation approach) could also be employed; however this would require direct estimation of the degrees of freedom in the correlation. The spatial smoothness inherent in the tiles of the SM means that the number of de-grees of freedom in the correlation is vastly less than the number of ma-trix elements (782). Estimating the reduction in degrees of freedom, whilst possible, is non-trivial. For this reason we employ the permuta-tion approach, where spatially smoothness in the measured tiles is also mirrored in the sham tiles.
The tile correlation test was used to identify tiles in the SM in which connectivity values were related significantly to schizophrenia. (i.e. tiles in which the effect of diagnosis correlated with the effect of severity). Following this, tiles deemed significant were used in order to visualise which individual brain connections were driving the observed significant correlation. To do this, for each matrix element within a sig-nificant tile, wefirst measured the effect of diagnosis (tested using a permutation test); second we measured the effect of severity (again tested via permutation). These tests were treated independently and those matrix elements significant (pb0.01) in both tests were used in visualisation.
Results
Task induced changes in brain activity and connectivity
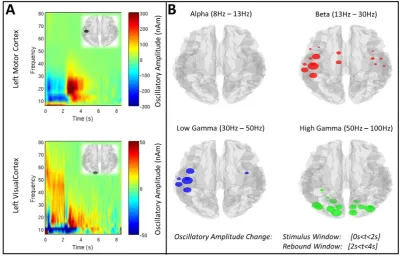
Fig. 2shows the change in oscillatory amplitude induced by the visuomotor task.Fig. 2A shows time frequency spectrograms (TFSs) ex-tracted from the left primary sensorimotor cortex (upper panel), and left primary visual cortex (lower panel). Note that, as expected, in sen-sorimotor cortex a reduction in beta amplitude is observed during stim-ulation with an increase above baseline immediately following movement cessation. In visual cortex, an increase in gamma amplitude is observed during stimulation alongside a concomitant decrease in alpha amplitude. These results are further shown inFig. 2B, where the coloured circles show the locations of AAL region centroids with a sig-nificant (pcb0.05) change in neural oscillatory amplitude between stimulus and rebound windows. The sizes of the circles reflect the mag-nitude of the change. Note that significant changes are observed in motor cortex for beta and low gamma bands, and in visual cortex in the high gamma band.
upper panel, regions of the adjacency matrix corresponding to the visu-al, motor and visual-to-motor networks are highlighted in red, blue and yellow respectively.
[image:6.595.92.493.53.309.2]Fig. 3B shows SMs, averaged across all subjects, in the active (left) and control (right) time windows. Notefirst that a high degree of struc-ture is observable in both matrices, particularly in the alpha and beta
Fig. 2.Task induced changes in oscillatory amplitude. A) TFSs generated in the left primary sensorimotor region, and left primary visual area, in healthy control subjects. B) AAL regions
[image:6.595.39.550.401.695.2]exhibiting a significant (pcb0.05) change in oscillatory amplitude between stimulus and rebound windows. The four images show the four separate frequency bands studied (alpha, beta, low gamma and high gamma).
Fig. 3.Task induced change in functional connectivity. A) Schematic showing structure of each individual tile (upper panel) and how these are combined to form the super-adjacency
bands. Note also that, particularly in high frequency bands, increased structure is observable in the active compared to the control window. These results are further confirmed inFig. 3C which shows the average difference between active and control windows (left) and the thresholded (pcb0.01—FDR corrected) difference (right). Comparison of the individual tiles ofFig. 3B and3C with the upper panel ofFig. 3A show clearly that visual networks are observed in the alpha and gamma bands, alongside a sensorimotor network in the beta band. Note also an anti-correlation between motor cortex beta oscillations and visual cortex high gamma oscillations. This manifests as significant clusters in the beta to high gamma band tile. Note the asymmetry mean-ing that a reciprocal‘motor gamma to visual beta’network is not observed.
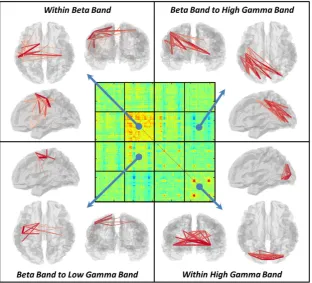
Fig. 4shows visualisation of the transient brain networks formed during the active window of the visuo-motor task. The central panel shows the dSM, and in the outer images, red lines denote the connec-tions between brain region pairs that exhibit a significant task induced change in functional connectivity. The thickness and colour of the line denotes the strength of connection. Within frequency band changes are observed in the beta and gamma ranges. The beta band shows a transient task induced increase in connectivity within a motor network. Specifically, connectivity is increased between the left and right primary motor regions as well as between left primary motor cortex, pre-motor cortex, supplementary motor area (SMA) and the left secondary so-matosensory area (S2). Thisfinding is in good agreement with previous results in motor tasks (for example (O'Neill et al., 2015b)). The high gamma band also demonstrates increased connectivity in a visual net-work which includes primary visual regions and associated (lateral) vi-sual areas. Again this is in good agreement with the well-known effect of increased gamma oscillations with presentation of visual gratings (Adjamian et al., 2004; Hall et al., 2005; Zumer et al., 2010). Significant between frequency band interactions are also observed. Beta to low gamma band connectivity is increased during the task within a network of brain areas which includes bilateral pre-motor cortex and left
primary motor cortex. Note the spatial difference between this beta to low gamma band interaction and the beta network, the former being centred on premotor regions whilst the latter is centred on primary motor cortices, making it tempting to speculate that these networks perform different functional roles. Finally, a beta to high gamma band reductionin connectivity is observed between the visual cortex and the left sensorimotor region. These effects will be addressed further in our discussion.
Difference between patients with schizophrenia and controls
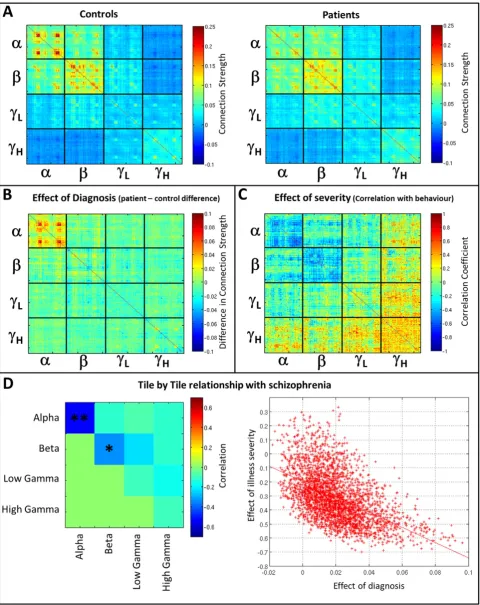
[image:7.595.147.460.53.336.2]Fig. 5shows the effects of schizophrenia on multi-layer network connectivity.Fig. 5A shows the mean SMs computed in controls (left) and patients (right). Recall that these matrices are computed within a single window spanning the entire length of the task trial, with connec-tivity estimated for each trial separately and averaged across trials, and subsequently subjects.Fig. 5B shows the difference between groups (Controls–Patients) which we term the effect of diagnosis. Note that clear structure in the difference matrix is observable, particularly within the tile representing alpha-to-alpha connectivity.Fig. 5C shows the cross subject correlation (patients only) between functional connectiv-ity and the severconnectiv-ity of persistent symptoms of schizophrenia, which we term the effect of severity. Again a clear structure is observable, partic-ularly in the alpha-to-alpha tile. Under a null hypothesis where connec-tivity metrics are unaffected by illness, then the effect of diagnosis (i.e. the matrix inFig. 5B) and the effect of severity (i.e. the matrix in Fig. 5C) would be completely unrelated and show no similarity. Howev-er, visually it is easy to see a clear relationship within some (but not all) tiles within these matrices.Fig. 5D formalises this relationship: each el-ement in the matrix represents tile correlation between effect of diag-nosis and effect of severity. Relationships are measured as Pearson correlation coefficients across all matrix elements within each tile (see Fig. 5D for an example of alpha-to-alpha connectivity). Notice that, as would be expected fromFig. 5B and5C, alpha-to-alpha connectivity
Fig. 4.Visualisation of task induced change in functional connectivity. The central matrix depicts the dSM, whilst the outer images show significant task induced changes within individual
shows a significant relationship between effects of diagnosis and sever-ity, implying that these connectivity estimates are affected by schizo-phrenia. Interestingly, no other tiles show a significant relationship following multiple comparison correction.
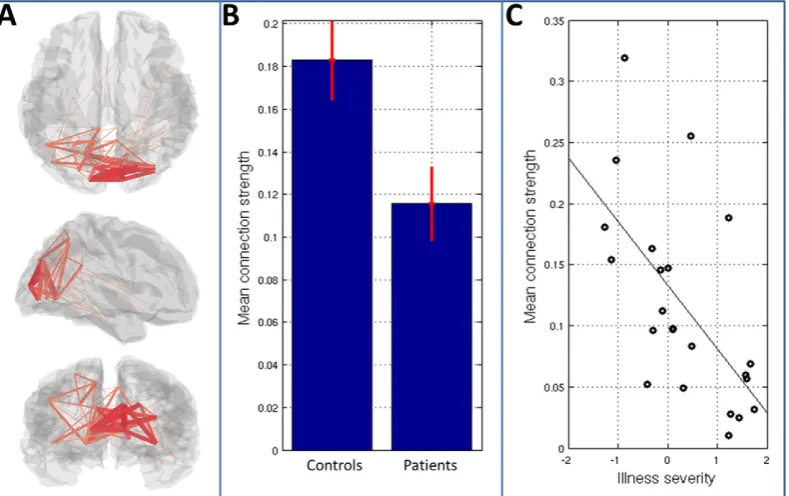
Having shown a significant effect of schizophrenia within alpha-to-alpha connectivity, we further investigate these effects inFig. 6.Fig. 6A highlights the brain regions between which connectivity differs (in terms of both diagnosis and severity) between groups. Again the lines denote connectivity between AAL regions and their width indicates the magnitude of the difference between patients and controls. Note that a clear network structure is observed with the occipital lobe being most strongly implicated. Fig. 6B shows mean connection strength, averaged across the observed occipital network, in both pa-tient and control groups. The bar chart shows mean group connectivity and error bars represent standard error across subjects.Fig. 6C shows mean connection strength (again averaged over all connections in the occipital network) computed separately in 23 patients and plotted against illness severity. Note how, in patients with less severe symp-toms, alpha band connectivity tends to a value close to that of controls, whereas in those patients with more severe symptoms, the mean alpha band connectivity is markedly reduced. This important point implies di-rect clinical relevance of the results shown, which will be further ad-dressed in the discussion below.
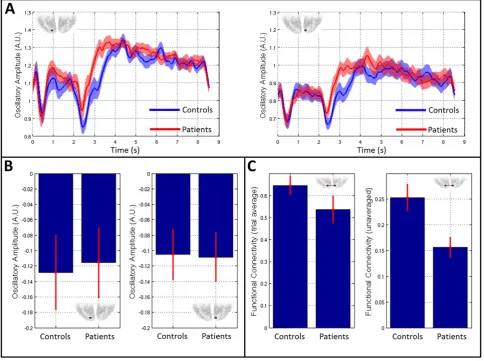
Finally,Fig. 7shows results of a post-hoc analysis of primary visual cortex activity and connectivity in the alpha band.Fig. 7A shows timecourses of alpha band Hilbert envelope, averaged over trials and subjects. The blue line shows the mean alpha envelope for controls whereas red shows the equivalent envelope in patients. The left hand plot shows the case for left visual cortex and the right hand plot shows right visual cortex. Note that there is relatively little difference in trial averaged alpha envelopes between patients and controls; both groups exhibit marked alpha desynchronisation during stimulation with the largest changes from baseline occurring shortly after stimulus onset and offset. The similarity of the trial averaged alpha band enve-lopes is further confirmed inFig. 7B. Here, the left and right bar charts show mean change in alpha amplitude between a stimulus window
[0 sbtb2 s] and a control window [6.5 sbtb8.5], in left and right visual cortices respectively. Note that amplitude is reduced during stimula-tion; however there is no measurable difference between patients and controls.Fig. 7C shows alpha connectivity measured between left and right visual regions. In the left hand plot, distinct from the rest of this study,“connectivity”is measured between trial averaged Hilbert enve-lopes; i.e. the bar chart reflects correlation between the trial averaged alpha band Hilbert envelopes measured in left and right visual cortex. [This is measured independently in each subject and the result averaged across subjects; error bar shows standard error.] In the right hand plot, connectivity is measured using the standard method in unaveraged data (i.e. envelope correlation is measured within each trial and these correlation values are subsequently averaged across trials—as de-scribed in ourMethodssection). Note that a significant difference in connectivity is observed between groups in the unaveraged case, but not in the averaged case. Averaging across trials prior to connectivity es-timation causes a marked reduction in any signalfluctuations that are not time locked to the stimulus—meaning that trial averaged“ connec-tivity”is a reflection of the degree to which task induced change is coor-dinated between regions. It thus follows that the reduction in alpha connectivity observed inFigs. 5 and 6is not due to atypical coordination of the task induced response between regions; rather, the primary effect is due to the superposition of atypical task independent activity that that fails to synchronise between regions. This will be addressed further below.
Discussion
[image:9.595.107.502.54.302.2]Recent years have shown the critical importance of inter-regional neural network connectivity in supporting healthy brain function. Such connectivity is measurable using neuroimaging techniques such as MEG, however the richness of the electrophysiological signal makes gaining a complete picture challenging. Specifically, connectivity can be calculated as statistical interdependencies between neural oscilla-tions measured across a large range of frequencies, as well as between frequency bands. This pan-spectral nature of network formation likely
Fig. 6.Visualisation of the differences in alpha band functional connectivity between patients and controls. A) Shows the brain regions between which connectivity differs most between
helps to mediate the simultaneous formation of multiple brain net-works, which support the demands of ongoing mental tasks. However, to date, in studies of electrophysiological connectivity this has been overlooked, with many studies treating individual frequency bands in isolation. Here, we combine envelope correlation based assessment of functional connectivity with a multi-layer network model in order to derive a more complete picture of connectivity within and between fre-quency bands. Using a visuomotor task, we have shown that our meth-od can highlight simultaneous and transient formation of a motor network in the beta band, and a visual network in the high gamma band. More importantly, we have used this same methodology to dem-onstrate significant differences in occipital alpha band functional con-nectivity in patients with schizophrenia relative to controls. This methodology represents an improved means by which to obtain a more complete picture of network connectivity, whilst ourfindings in schizophrenia demonstrate the critical importance of measuring con-nectivity in clinical studies.
Methodology and the visuomotor task
Methodologically, this paper demonstrates the utility of a multi-layer model in characterising within and between frequency interac-tions. In our visuomotor application, it was our intention to demonstrate this framework using a well characterised task that is known to induce
[image:10.595.52.537.55.416.2]robust changes in neural oscillations in multiple frequency bands. It is well known thatfinger movement induces a drop in beta band oscillato-ry amplitude in primaoscillato-ry sensorimotor cortex during movement, follow-ed by an increase above baseline shortly following movement cessation. Furthermore, it is also known that beta band envelopes are associated with long range motor network connectivity. Here we added to this pic-ture by showing directly that unilateralfinger movement is supported by the transient formation of a broad network of brain regions including left and right primary motor cortices as well as pre-motor cortices, SMA and secondary somatosensory regions; further, this network is mediat-ed in the beta band. In addition, passive viewing of a visual grating has long been known to increase the amplitude of gamma oscillations in pri-mary visual cortex (Adjamian et al., 2004; Hall et al., 2005). Here we have shown that induced gamma envelopes are correlated across visual regions. Whilst this interaction may be expected, it is interesting to note that it is not simply due to signal leakage between hemispheres. Linear interactions (i.e. simple zero-phase lag correlation between signals measured at spatially separate locations) have been removed via our leakage reduction methodology. The significant increase in connectivity observed therefore represents envelope correlation mediated by non-zero phase lagged (i.e. time lagged) events in the underlying neural sig-nals. To the authors' knowledge this is thefirst direct measurement of this effect, which may warrant further investigation in future studies. Fi-nally, significant task driven changes between frequency bands were
Fig. 7.Alpha band amplitude and connectivity changes in visual cortex. A) Timecourses of alpha band oscillatory envelope in patients (red) and controls (blue). The left hand plot shows
also observed. A network involving bilateral pre-motor and left primary motor areas was observed as a beta to low gamma interaction and the spatial differences noted between this and the motor network limited to the beta band makes it tempting to speculate that the cross frequency interaction serves a different functional role, however this requires sig-nificant further investigation. An anti-correlation between the motor and visual regions was also measurable as a beta to high gamma inter-action. Whilst it may be tempting to interpret this as a network that co-ordinates activity between these two regions, it should be pointed out that, given the task is well known to increase gamma amplitude and si-multaneously decrease beta amplitude in the visual and motor areas re-spectively, such an interaction would be expected. In fact, the likelihood is that this transient anti-correlation results from two independent stimulus driven variations, rather than a functional networkper se. This said however, this cross frequency network also potentially war-rants further investigation. Overall, despite some ambiguity, the visuomotor task represents a useful testbed for the multi-layer network framework and its ability to extract simultaneous transiently forming networks both within and across frequency bands.
In terms of the method itself, there are four core components that warrant discussion: cortical parcellation; source space projection; the connectivity metric and statistical analysis. First, regarding the AAL parcellation, this was chosen based on its successful use in previous MEG investigations (e.g. (Tewarie et al., 2016; Tewarie et al., 2014)). However, our method could be used with any cortical parcellation. It is noteworthy that the separate AAL regions vary markedly in size, meaning that our use of a single full width at half maximum of the Gaussian function (Eq.(1)) may mean that some regions are better rep-resented than others; this represents a limitation of the present method. Related, the inhomogeneous spatial resolution of MEG may mean that, in some cases multiple AAL regions may generate degenerate timecourses, whilst in other cases a single region may contain multiple independent signals. In future, the use of brain parcellations based di-rectly on the MEG data may therefore prove instructive. However this is non-trivial and should be a subject of future investigation. Secondly, for source localisation, we used a beamformer technique. Beamforming has been shown previously to be particularly useful in the characterisa-tion of neural oscillacharacterisa-tions, and has been used successfully in the mea-surement of connectivity (Brookes et al., 2011). The reasons for the success of this algorithm in such studies has been addressed at length in previous papers, and will not be repeated here. However, we do point out that other inverse solutions could be substituted for beamforming in the present processing pipeline, and would likely gen-erate similar results. Thirdly, regarding the choice of functional connec-tivity metric: here we choose to use envelope correlation based on the previous success of this measurement in facilitating long range connec-tivity estimation. However, it is important to point out that the multi-layer network framework is not limited to envelope metrics, but could be extended to other electrophysiological measurements of functional connectivity. Recent years have seen the emergence of a number of metrics for functional coupling, including within frequency band and between frequency band interactions. It is easy to conceive how such metrics could be employed to form a set of super adjacency matrices similar to those employed here. For example the diagonal tiles (within frequency connectivity) could easily be generated using either the imaginary part of coherence (Nolte et al., 2004) or the phase lag index (Stam et al., 2007). When considering between frequency band interac-tions obviously the notion of phase coupling becomes problematic. However, one could consider measuring afixed phase relationship be-tween two bands where, for example, the duration taken for n cycles of frequency band one always coincides with the duration taken for m cycles of frequency band two. In addition, cross frequency interactions can also be quantified via coupling between the phase of low frequency oscillations and the amplitude of high frequency oscillations (Canolty et al., 2010; Florin and Baillet, 2015). Finally, following derivation of super-adjacency matrices, there are many ways in which to analyse
those matrices statistically. Here, a simple approach was employed in which significant differences between task and rest (or patients and controls) was sought on an element by element basis. We used this ap-proach since it allowed direct inference on both task driven networks and patient-control differences. However, more complex analyses may be highly informative: In particular, graph theoretical metrics such as al-gebraic connectivity have become a popular way to analyse single layer networks in neuroimaging and are equally applicable to multi-layer models. Such measures would offer summary statistics regarding changes in the efficiency of the network as a whole (e.g. algebraic con-nectivity reflects, loosely, a measure of synchronisability of the net-work). Such measures may be of significant utility in characterising task, compared to rest, or patients versus controls. Overall, it is possible to conceive multiple ways of forming and analysing a multi-layer net-work equivalent to that used here. This same framenet-work will offer unique insight into how the brain employs multiple temporal scales in order to simultaneously form, and dissolve, networks of communication in the task positive and resting states.
Insights into schizophrenia
It is important to remember that this is an exploratory analysis in a small group (23 controls and 23 patients). For this reason, results should not be over interpreted and they require replication in a second patient cohort. However, given the relatively well characterised role of alpha oscillations it is tempting to speculate on what these measurements might imply. Our multi-layer network model captured connectivity across the entire 8–100 Hz frequency range. This analysis encompassed many pan-spectral networks including the beta band sensorimotor net-work and the gamma band visual netnet-work (indeed, this structure is clear in the super-adjacency matrices shown inFig. 5). It is therefore of significant note that only the occipital alpha network demonstrated a robust relationship to schizophrenia. Visual alpha oscillations have been observed since thefirst EEG recordings. For many years, these ef-fects were treated as epiphenomena, with little or no relevance to neu-ral processing. However, in recent years important insight has been gained into the functional role of these oscillatory effects. Specifically, a link has been made between alpha activity and attention, with high alpha amplitude being thought of as a marker of inattention (Handel et al., 2011; Thut et al., 2006; Zumer et al., 2014). This is shown clearly in studies in which individual subjects are asked to switch their atten-tion from one visual region to another. If, for example, attenatten-tion is switched from the left visualfield to the right, one sees an increase in alpha oscillations in the right hemisphere and a decrease in the left. The reverse is true when switching attention from the right visual field to the left. Furthermore it has been proposed that these alpha oscil-lations act to gate informationflow to higher order cortical regions (Zumer et al., 2014). Given this hypothesis, it follows that a lack of coor-dination between alpha envelopes across brain regions may be refl ec-tive of an inability to direct visual attention appropriately, and more specifically an inability to accurately gate incoming visual information to higher order brain regions. This, in turn, may have an influence on a number of the ongoing persistent symptoms of schizophrenia including an apparent disorganization or impoverishment of mental activity. We therefore speculate that this may be why reduction in alpha connectiv-ity correlates well with behavioural measures of persistent illness sever-ity. For this reason, whilst this remains an exploratory analysis, future studies of schizophrenia patients using MEG should use this same tech-nique to further probe alpha band attentional effects and their relation-ship to the core symptoms of schizophrenia.
Conclusion
We have combined oscillatory envelope based functional connectiv-ity metrics with a multi-layer network model in order to derive a com-plete picture of connectivity within and between oscillatory frequencies. We demonstrate our methodology in a visuomotor task, highlighting the simultaneous and transient formation of motor net-works in the beta band and visual netnet-works in the high gamma band, as well as cross-spectral interactions. More importantly, we employ our framework to demonstrate significant differences in occipital alpha band networks in patients with schizophrenia relative to controls. We further show that these same measures correlate significantly with symptom severity scores, highlighting their clinical relevance. Ourfi nd-ings demonstrate the unique potential of appropriately modelled MEG measurements to characterise neural network formation and dissolu-tion. Further, we add weight to the argument that dysconnectivity is a core feature of the neuropathology underlying schizophrenia.
Acknowledgements
This work was funded by a Medical Research Council New Investiga-tor Research Grant (MR/M006301/1) awarded to MJB. We also acknowledge Medical Research Council Partnership Grant (MR/ K005464/1). Data used were collected as part of the University of Not-tingham Multimodal Imaging Study in Psychosis. We therefore express our thanks to those involved in data collection and clinical evaluation of
patients, particularly, Emma Hall, Lena Palaniyappan, Jyothika Kumar, Michael Skelton, Nikolaos Christodoulou, Ayaz Qureshi, Fiesal Jan. and Mohammad Z. Katshu.
Appendix A. Testing signal leakage and signal to noise ratio
As noted in section 2.2, signal leakage between source space esti-mates is a significant problem in MEG functional connectivity estima-tion (Brookes et al., 2012; Colclough et al., 2015;Hipp et al., 2012; O'Neill et al., 2015a). Leakage results from the ill-posed MEG inverse problem, which causes spatial blurring in beamformer reconstruction and means that a point source will spread across afinite volume. In ad-dition, mislocalisation of sources, for example due to inaccuracies in modelling the forward vector, or deviation from the assumptions driving the inverse model also adds to the effect of leakage. Overall the effect is that if two temporally independent and spatially separated sources are reconstructed via beamforming, the resultant estimated timecourses may no longer be orthogonal. This causes artifactually in-flated functional connectivity estimates.
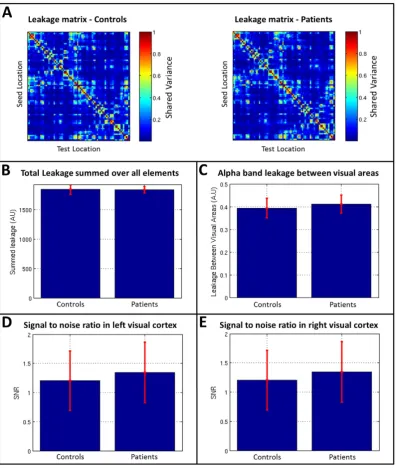
In the present paper, we employed orthogonalisation (via regres-sion) in order to limit the effect of leakage. However this technique, whilst highly effective, is not perfect and a degree of leakage can remain if, for example, underlying beamformer projected data are non-Gaussian (O'Neill et al., 2015a). For this reason, it is conceivable that the between group differences in functional connectivity (effect of diagnosis) ob-served in our schizophrenia study could result directly from between group differences in leakage. Leakage itself is dependent on beamformer accuracy, and this relates directly to the accuracy of both the data covari-ance matrix, and the forwardfield model. Covariance and forward model accuracy, in turn, both rely heavily on subjects remaining still through-out the MEG data acquisition, as well as on the signal to noise ratio of the data and the total amount of data available. Patients are more likely to move during acquisition. Furthermore, patients could potentially have more eye movements, and more muscle artifact. It is therefore conceiv-able that patients could exhibit a different leakage profile to controls. In addition, it has been shown previously (Schoffelen and Gross, 2009) that change in connectivity can be driven by a change in SNR. Again, SNR in MEG could potentially differ between patients and controls. For these reasons it is critical in studies of this type to analyse both the leakage profile (before orthogonalisation) and SNR, measured across both groups, to check that any observable connectivity differences do not result from poor beamformer reconstructions.
References
Adjamian, P., Holliday, I.E., Barnes, G.R., Hillebrand, A., Hadjipapas, A., Singh, K.D., 2004. In-duced visual illusions and gamma oscillations in human primary visual cortex. Eur. J. Neurosci. 20 (2), 587–592.
Baker, A.P., Brookes, M.J., Smith, S.M., Beherens, T., Probert Smith, P.J., Woolrich, M., 2012. Investigating the temporal dynamics of resting state brain connectivity using magne-toencephalography. Proceedings of the 18th Annual meeting of the organisation for human brain mapping Beijing.
Baker, A.P., Brookes, M.J., Rezek, I.A., Smith, S.M., Behrens, T., Probert Smith, P.J., Woolrich, M., 2014.Fast transient networks in spontaneous human brain activity. Elife 3, e01867.
Beckmann, C.F., De Luca, M., Devlin, J.T., Smith, S.M., 2005.Investigations into resting-state connectivity using independent component analysis. Philos. Trans. R. Soc. Lond. 360 (1457), 1001–1013.
Biswal, B., Yetkin, F.Z., Haughton, V.M., Hyde, J.S., 1995.Functional connectivity in the motor cortex of resting human brain using echo planar MRI. Magn. Reson. Med. 34, 537–541.
Brookes, M.J., Gibson, A.M., Hall, S.D., Furlong, P.L., Barnes, G.R., Hillebrand, A., Singh, K.D., Holliday, I.E., Francis, S.T., Morris, P.G., 2005.GLM-beamformer method demonstrates stationary field, alpha ERD and gamma ERS
co-localisation with fMRI BOLD response in visual cortex. NeuroImage 26, 302–308.
Brookes, M.J., Hale, J.R., Zumer, J.M., Stevenson, C.M., Francis, S.T., Barnes, G.R., Owen, J.P., Morris, P.G., Nagarajan, S.S., 2011. Measuring functional connectivity using MEG: methodology and comparison with fcMRI. NeuroImage 56, 1082–1104.
Brookes, M.J., Mullinger, K.J., Stevenson, C.M., Morris, P.G., Bowtell, R., 2008.Simultaneous EEG source localisation and artifact rejection during concurrent fMRI by means of spatialfiltering. NeuroImage 40, 1090–1104.
Brookes, M.J., Woolrich, M.W., Barnes, G.R., 2012.Measuring functional connectivity in MEG: a multi-variate approach insensitive to linear source leakage. NeuroImage 63, 910–920.
Butler, P.D., Schechter, I., Zemon, V., Schwartz, S.G., Greenstein, V.C., Gordon, J., Schroeder, C.E., Javitt, D.C., 2001.Dysfunction of early-stage visual processing in schizophrenia. Am. J. Psychiatry 158, 1126–1133.
Cadenhead, K.S., Dobkins, K., McGovern, J., Shafer, K., 2013.Schizophrenia spectrum participants have reduced visual contrast sensitivity to chromatic (red/green) and luminance (light/dark) stimuli: new insights into information processing, visual channel function, and antipsychotic effects. Front. Psychol. 4, 535. Canolty, R.T., Edwards, E., Dalal, S.S., Soltani, M., Nagarajan, S.S., Kirsch, H.E., Berger, M.S.,
[image:13.595.105.503.51.520.2]Barbaro, N.M., Knight, R.T., 2006.High gamma power Is phase-locked to theta oscilla-tions in human neocortex. Science 313, 1626–1628.
Fig. A1.Testing for leakage and signal to noise ratio between control and patient groups. A) Adjacency matrices representing source leakage between AAL regions. Note that whilst leakage
Canolty, R.T., Ganguly, K., Kennerley, S.W., Cadieu, C.F., Koepsell, K., Wallis, J.D., Carmena, J.M., 2010.Oscillatory phase coupling coordinates anatomically dispersed functional cell assemblies. Proc. Natl. Acad. Sci. U. S. A. 107, 17356–17361.
Cohen, D., 1972.Magnetoencephalography: detection of the brains electrical activity with a superconducting magnetometer. Science 5, 664–666.
Colclough, G.L., Brookes, M.J., Smith, S.M., Woolrich, M.W., 2015.A symmetric multivari-ate leakage correction for MEG connectomes. NeuroImage 117, 439–448. De Domenico, M., Solé-Ribalta, A., Cozzo, E., Kivelä, M., Moreno, Y., Porter, M.A., Gómez, S.,
Arenas, A., 2014.Mathematical formulation of multilayer networks. Phys. Rev. X 3 (4), 041022.
de Pasquale, F., Della Penna, S., Snyder, A.Z., Lewis, C., Mantini, D., Marzetti, A., Belardinelli, P., Ciancetta, L., Pizzella, V., Romani, G.L., et al., 2010.Temporal dynamics of spontane-ous MEG activity in brain networks. Proc. Natl. Acad. Sci. U. S. A. 107, 6040–6045. Engel, A.K., Gerloff, C., Hilgetag, C.C., Nolte, G., 2013.Intrinsic coupling modes: multiscale
interactions in ongoing brain activity. Neuron 80, 867–886.
Florin, E., Baillet, S., 2015.The brain's resting-state activity is shaped by synchronized cross-frequency coupling of neural oscillations. NeuroImage 111, 26–35.
Furl, N., Coppola, R., Averbeck, B.B., Weinberger, D.R., 2014.Cross-frequency power cou-pling between hierarchically organized face-selective areas. Cereb. Cortex 24 (9), 2409–2420.
Hall, E.L., Robson, S.E., Morris, P.G., Brookes, M.J., 2014.The relationship between MEG and fMRI. NeuroImage 102, 80–91.
Hall, S.D., Holliday, I.E., Hillebrand, A., Singh, K.D., Furlong, P.L., Hadjipapas, A., Barnes, G.R., 2005.The missing link: analogous human and primate cortical gamma oscillations. NeuroImage 26, 13–17.
Handel, B.F., Haarmeier, T., Jensen, O., 2011.Alpha oscillations correlate with the success-ful inhibition of unattended stimuli. J. Cogn. Neurosci. 23, 2494–2502.
Hipp, J.F., Hawellek, D.J., Corbetta, M., Siegel, M., Engel, A.K., 2012.Large-scale cortical cor-relation structure of spontaneous oscillatory activity. Nat. Neurosci. 15 (6), 884–890. Huang, M.X., Mosher, J.C., Leahy, R.M., 1999.A sensor-weighted overlapping-sphere head model and exhaustive head model comparison for MEG. Phys. Med. Biol. 44, 423–440.
Hutchison, R.M., Womelsdorf, T., Allen, E.A., Bandettini, P.A., Calhoun, V.D., Corbetta, M., Della Penna, S., Duyn, J.H., Glover, G.H., Gonzalez-Castillo, J., et al., 2013.Dynamic functional connectivity: promise, issues, and interpretations. NeuroImage 80, 360–378.
Keri, S., Antal, A., Szekeres, G., Benedek, G., Janka, Z., 2002.Spatiotemporal visual process-ing in schizophrenia. J. Neuropsychiatr. Clin. Neurosci. 14, 190–196.
Kraepelin, E., 1919.Dementia Praecox and Paraphrenia (R Barclay, Trans.). E&S Living-stone, Edinburgh.
Liddle, E.B., Hollis, C., Batty, M.J., Groom, M.J., Totman, J.J., Liotti, M., Scerif, G., Liddle, P.F., 2011.Task-related default mode network modulation and inhibitory control in ADHD: effects of motivation and methylphenidate. J. Child Psychol. Psychiatry Allied Discip. 52 (7), 761–771.
Liddle, P.F., E.T.C., Nganm, Duffield, G., Kho, K., Warren, A.J., 2002.Signs and symptoms of psychotic illness (SSPI): a rating scale. Br. J. Psychiatry 180, 45–50.
Maldjian, J.A., Davenport, E.M., Whitlow, C.T., 2014.Graph theoretical analysis of resting-state MEG data: identifying interhemispheric connectivity and the default mode. NeuroImage 96, 88–94.
Marzetti, L., Della Penna, S., Snyder, A.Z., Pizzella, V., Nolte, G., de Pasquale, F., Romani, G.L., Corbetta, M., 2013.Frequency specific interactions of MEG resting state activity with-in and across brawith-in networks as revealed by the multivariate with-interaction measure. NeuroImage 79, 172–183.
Nichols, T.E., Holmes, A.P., 2001.Nonparametric permutation tests for functional neuro-imaging: a primer with examples. Hum. Brain Mapp. 15, 1–25.
Nolte, G., Bai, O., Wheaton, L., Mari, Z., Vorbach, S., Hallett, M., 2004.Identifying true brain interaction from EEG data using the imaginary part of coherency. Clin. Neurophysiol. 115, 2292–2307.
O'Neill, G.C., Barratt, E.L., Hunt, B.A.E., Tewarie, P.K., Brookes, M.J., 2015a.Measuring elec-trophysiological connectivity by power envelope correlation: a technical review on MEG methods. Phys. Med. Biol. (in submission).
O'Neill, G.C., Bauer, M., Woolrich, M.W., Morris, P.G., Barnes, G.R., Brookes, M.J., 2015b. Dy-namic recruitment of resting state sub-networks. NeuroImage 115, 85–95. Palaniyappan, L., Simmonite, M., White, T.P., Liddle, E.B., Liddle, P.F., 2013.Neural primacy
of the salience processing system in schizophrenia.b/pubmed/23972602N. Neuron 79 (4), 814–828.
Robinson, S., Vrba, J., 1998.Functional neuroimaging by synthetic aperture magnetome-try. In: Yoshimoto, T., Kotani, M., Kuriki, S., Karibe, H., Nakasato, N. (Eds.), Recent Advances in Biomagnetism. Tohoku Univ. Press, Sendai, Japan, pp. 302–305. Robson, S.E., Brookes, M.J., Hall, E.L., Palaniyappan, L., Kumar, J., Skelton, M., Christodoulou,
N.G., Qureshi, A., Jan, F., Katshu, M.Z., et al., 2015.Abnormal visuomotor processing in schizophrenia. NeuroImage Clin. (in press).
Sarvas, J., 1987.Basic mathematical and electromagnetic concepts of the biomagnetic in-verse problem. Phys. Med. Biol. 32 (1), 11–22.
Schoffelen, J.M., Gross, J., 2009.Source connectivity analysis with MEG and EEG. Hum. Brain Mapp. 30, 1857–1865.
Scholvinck, M.L., Leopold, D.A., Brookes, M.J., Khader, P.H., 2013.The contribution of elec-trophysiology to functional connectivity mapping. NeuroImage 80, 297–306. Slaghuis, W.L., 1998.Contrast sensitivity for stationary and drifting spatial frequency
grat-ings in positive- and negative-symptom schizophrenia. J. Abnorm. Psychol. 107, 49–62.
Stam, C.J., Nolte, G., Daffertshofer, A., 2007.Phase lag index: assessment of functional con-nectivity from multi channel EEG and MEG with diminished bias from common sources. Hum. Brain Mapp. 28, 1178–1193.
Stancak, A., Pfurtscheller, G., 1995.Desynchronisation and recovery of beta rhythms dur-ing brisk and slow self-pacedfinger movements in man. Neurosci. Lett. 196, 21–24. Stevenson, C.M., Brookes, M.J., Morris, P.G., 2011.Beta band correlates of the fMRI BOLD
response. Hum. Brain Mapp. 2, 182–197.
Tessitore, A., Amboni, M., Esposito, F., Russo, A., Picillo, M., Marcuccio, L., Pellecchia, M.T., Vitale, C., Cirillo, M., Tedeschi, G., et al., 2012.Resting-state brain connectivity in pa-tients with Parkinson's disease and freezing of gait. Parkinsonism Relat. Disord. 18 (6), 781–787.
Tewarie, P., Bright, M.G., Hillebrand, A., Robson, S.E., L.E., Gascoyne, Morris, P.G., Barkhof, F., Meier, J., Van Mieghem, P., Brookes, M.J., 2016.Predicting haemodynamic net-works using electrophysiology: the role of non-linear and cross-frequency interac-tions. NeuroImage 130, 273–292.
Tewarie, P., Hillebrand, A., van Dellen, E., Schoonheim, M.M., Barkhof, F., Polman, C.H., Beaulieu, C., Gong, G., van Dijk, B.W., Stam, C.J., 2014.Structural degree predicts func-tional network connectivity: a multimodal resting-state fMRI and MEG study. NeuroImage 97, 296–307.
Thut, G., Nietzel, A., Brandt, S.A., Pascual-Leone, A., 2006.Alpha-band electroencephalo-graphic activity over occipital cortex indexes visuospatial attention bias and predicts visual target detection. J. Neurosci. 26, 9494–9502.
Troebinger, L., Lopez, J.D., Lutti, A., Bestmann, S., Barnes, G., 2014.Discrimination of corti-cal laminae using MEG. NeuroImage 102, 885–893.
Tzourio-Mazoyer, N., Landeau, B., Papathanassiou, D., Crivello, F., Etard, O., Delcroix, N., Mazoyer, B., 2002.Automated anatomical labeling of activations in SPM using a mac-roscopic anatomical parcellation of the MNI MRI single-subject brain. NeuroImage 15, 273–289.
Vrba, J., Robinson, S.E., 2001.Signal processing in magnetoencephalography. Methods 25, 249–271.
Zanin, M., 2015.Can we neglect the multi-layer structure of functional networks? Physica A 430, 184–192.
Zumer, J.M., Brookes, M.J., Stevenson, C.M., Francis, S.T., Morris, P.G., 2010.Relating BOLD fMRI and neural oscillations through convolution and optimal linear weighting. NeuroImage 49, 1479–1489.