Material properties of
ex-vivo
milk chocolate boluses examined in relation to texture
perception
He Qi1,3, Filippo Bramante1, Andrew Davies2, Carole Elleman3, Kelly Fourtouni3and Bettina Wolf1
1Division of Food Sciences, The University of Nottingham, Sutton Bonington Campus, Loughborough LE12 5RD, UK; 2 School of Physics and Astronomy, The University of Nottingham, University Park, Nottingham NG7 3RD, UK; 3The Reading Science Centre, Whiteknights Campus, Pepper Lane, Reading, RG6 6LA, UK.
Abstract
The texture perception of chocolate products is a major driver for consumer liking and the popularity of this confectionary category. Whilst some texture attributes are clearly linked to the material properties of the chocolate bar itself, others are closer related to the properties of the chocolate bolus. However, little is known around the material properties of chocolate boluses. Hence the aim of this study was to gain more in-depth insights into this area and to evaluate how chocolate bolus material properties link to texture and mouthfeel perception. Boluses prepared from four milk chocolates were analysed for microstructure, particle size, composition and friction properties. The boluses showed the expected oil-in-water emulsion microstructure. The emulsion droplets were composed of fat and milk protein with clear evidence for presence of milk protein not only at the droplet interface but also in the droplet bulk phase. The type of adsorbed milk protein depended on the presence or absence of interfacially adsorbed cocoa solids, grouping the four chocolates into two pairs. The chocolate boluses showed increased friction compared to saliva and at low sliding speed the friction coefficients were lower for boluses with interfacially adsorbed cocoa solids. Perceived differences in mouthcoating were reflected in the mixed regime of the Stribeck curve. Thickness perception on the other hand was reflected in the hydrodynamic regime of the friction curves. This research has highlighted promise in analysing material properties of chocolate boluses in view to understanding perceived texture.
Keywords: chocolate bolus, oral processing, microstructure, texture perception, tribology, Raman spectroscopy
Introduction
Chocolate is a composite food material comprising of a continuous fat matrix which contains suspended sugar particles, cocoa solids and, in the case of milk chocolate, milk solids. The fat matrix is largely composed of cocoa butter and milk fat. In some cases other types of vegetable fats (e.g. palm, shea) are included as well. Amphiphiles are used to control the melt flow properties and lecithin and polyglycerol polyricinoleate (PGPR) are the most commonly found flow enhancers in commercial chocolate. Most chocolates are made with the dry mix process, where the ingredients are combined in a series of steps. First refining to adjust particle size, then mixing & conching to combine the ingredients, remove moisture and develop flavour. The last step is
in mouth manipulation of chocolate by chewing, squeezing between tongue and palate, and dilution with saliva. Peyron et al9have reported on the jaw movements as a tool to differentiate between foods of different texture, including chocolate. While they found differences between subjects, they could demonstrate that across subjects mastication differed with the type of food. However, a later study on the eating behaviour of two milk chocolates, differing in texture perception, revealed that the eating behaviour only depended on subject, not on chocolate10. As a follow up, the microstructure of the chocolate boluses was investigated and found to correspond to that of an oil-in-water (o/w) emulsion11. This type of microstructure is the consequence of phase inversion5 following the melting of the continuous chocolate fat phase into the aqueous salivary environment of the oral cavity. Carvalho-da-Silva et al11 noted differences in the level of flocculation between the bolus samples and their lubrication properties, both of which they linked to perceived texture difference, notably mouthcoating. The flocculation could be a result of interactions between charged emulsion interface and saliva as previously suggested by Silletti and co-workers.12-14 James and co-workers recently published15 a detailed study on the lubrication behaviour of chocolate during oral processing. Utilising two commercial dark chocolates with different cocoa solids content as a basis for simulated (molten chocolate with saline buffer), in-vitro (molten chocolate with human saliva) and ex-vivo (expectorated chocolate) boluses and contrasting their lubrication behaviour with molten chocolate, they found that in the latter case the friction coefficient was largely affected by the sugar and cocoa solids, entraining into the contact zone between the two surfaces in the tribometer. Type of aqueous medium used to prepare the chocolate bolus was reported to impact on friction properties with saliva being more lubricating than saline buffer. The lubrication properties of ex-vivo boluses were found to be affected by an inhomogeneous bolus structure, and non-emulsified fat enhancing lubrication. Air bubbles brought into the system with saliva were proposed to contribute to enhanced wetting and lubrication. To date, the studies aimed at understanding chocolate sensory perception have
been carried out mainly using analytical techniques on chocolate itself and before it is orally processed. There is limited knowledge with regards to the role of bolus composition and the impact of material properties of the bolus on chocolate sensory perception. The aim of this study was to bridge this knowledge gap by collecting information on, and assessing relationships between the microstructure, the composition, and the lubrication properties of ex-vivo chocolate boluses prepared from four commercially manufactured milk chocolates showing differences in texture and mouthfeel perception. A deeper understanding of the origin of perceived texture differences as caused by the properties of the chocolate bolus will be one step forward to reverse engineering of chocolate for sensory perception.
Materials and methods
Chocolate samplesThree commercially manufactured milk chocolates (C1, C2 & C3) and a bench scale chocolate (MMC, made with a dry mix process) were investigated in this study. They contained around 30 %w/w of fat and 57 of %w/w sugar. The protein content varied slightly and was 7.5 %w/w, 8.4 %w/w, 6.4 %w/w and 6.6 %w/w respectively for C1, C2, C3 and MMC. The emulsifiers Polyglycerol Polyricinoleate (PGPR) and lecithin were present in C1 and C2 whereas C3 and MMC contained only lecithin.
The four chocolates were selected on the basis of known sensory characteristics abstracted from many studies over the time.
Chocolate ingredients
The commercial chocolate ingredients casein, lactose, sucrose, cocoa butter, skimmed milk powder
and whey powder (provided by Mondelēz
International, UK) were used as reference materials to interpret Raman data acquired on chocolate bolus particles.
Quantitative descriptive analysis
out with twelve trained panellists aged between 18 – 65. The panel had a round table discussion to generate vocabulary, see Table 1, followed by line scale training. The samples were assessed in triplicate for each of the attributes defined in the round table discussion. The results were collected via a Compusense data capture system and analysed with QDATM software (Tragon) using ANOVA. The Duncan minimum significant difference s was
calculated in order to determine those samples
which were significantly different (p ≤0.05).
[image:3.595.72.480.224.536.2]The four chocolates in this study were tested against each other in three separate QDAs thus only relative differences can be discussed.
Table 1: Panel instruction including attribute definitions for QDA assessment
TEXTURE/MOUTHFEEL
- Take a bite of the sample using your front teeth in the middle of one chunk to evaluate:
Attribute Definition
HARDNESS OF BITE (soft-hard)
Measure of how soft or hard the chocolate feels during the initial bite into the chocolate.
CRUMBLY
(slightly-very) Measure how the chocolate breaks from the back teeth on the firstfew bites.
CHEWY (slightly – very)
Measure of how much effort is required to break down the chocolate.
STICKY
(slightly-very) Measure of how adhesive the chocolate feels; this can be measuredby how much the chocolate sticks to your teeth.
COHESIVE
(slightly-very) measured by how much the chocolate sticks to itself.Measure of how cohesive/compacts the chocolate feels; this can be
THICKNESS (thin-thick)
Measure of how thick or viscous the chocolate feels in the mouth.
SMOOTH
(slightly-very) Measure of how smooth and silky or velvety the chocolate feels as itis melting in the mouth.
POWDERY
(slightly-very) Measure of powder, fine particles like icing sugar. MELT RATE
(slow-fast) Measure of the how slowly or quickly the chocolate melts in themouth.
MOUTHCOATING (slightly-very)
Degree to which the chocolate coats the inner surface of the mouth.
DRYING
(weak-strong) Measure of how dry the sample leaves your mouth feeling – like youneed a sip of water.
Preparation of the chocolate boluses
The chocolate boluses for physical-chemical analyses were prepared by chewing a 4 g piece of chocolate. In line with the sensory method, an eating protocol was not prescribed except for setting the chewing time to 21 s. This time was equal to the mean chewing time (21 ± 4 s) assessed across all 4 chocolate samples (three replicates each) with a panel of 9 white British subjects (7 male, 2 female) aged between 55 – 70. It is appreciated that a prescribed time meant that some panellists provided boluses in a pre-swallow state and others in a post-swallow state. Based on the vast number of micrographs collected on chocolate boluses, we are
analyses except for microscopy where samples from all 9 panellists were considered. When boluses were prepared for friction analysis, the sample size was halved (2 g) so as to obtain a bolus which as a whole could be transferred to the measurement cell. The chewing time was also halved (10.5 s) in order to keep chew time per g of chocolate constant. The chocolate bolus preparation protocol was approved by the University of Nottingham Medical School Research Ethics Committee (Reference: R13032015). Bolus microstructure imaging
The chocolate boluses were imaged using bright field microscopy to inspect the samples for flocculation as previously noted in literature11. Fluorescence microscopy was applied to locate the auto fluorescent cocoa solids16 in the bolus microstructure. These were additionally identified via confocal laser scanning microscopy (CLSM) on stained samples to visualise the distribution of protein and fat in the bolus emulsion droplets. Finally, cryo-scanning electron microscopy (cryo-SEM) was employed to visualise the microstructure of the interface of the bolus droplets. Chocolate boluses were prepared for imaging at ambient temperature (18 – 25 °C depending on laboratory), retained and analysed at this temperature. The chocolate boluses were a mixture of an oil-in-water emulsion and un-melted solid chocolate pieces. For microscopy, boluses were mixed with a spatula and a small amount of sample was taken from the emulsion part for each of the imaging methods applied. This procedure was justified since we were not looking to imagine the macroscopic chocolate bolus but the internal microstructure.
Bright field and fluorescence microscopy
Samples for bright field and fluorescence microscopy were taken as described in the previous paragraph and then imaged using an inverted light microscope (EVOS, Invitrogen, Life Technologies, Paisley, UK) under bright field and fluorescence illumination (GFP
filter (λex: 470 nm; λem: 525)). Across the images taken, microstructure differences were between the chocolate samples and not the panellists. Hence, a limited number of images taken on the bolus samples of all 9 panellists are included in the results and discussion section.
Confocal laser scanning microscopy
When preparing the slides for CLSM, a small drop of bolus sample was placed on a glass slide and around
1 μL of stain was added to the bolus followed by a
gentle stir. A glass coverslip was put on top of the sample and sealed with nail polish. The prepared slides were left at room temperature for at least 2 hours before the imaging. Samples were stained for
protein using Rhodamine 6G (λex: 525 nm; λem: 555 nm; Sigma-Aldrich, USA; 0.05 g/L dissolved in RO
water) and for fat using Nile Blue (λex: 633nm; λem: 660nm; Sigma-Aldrich, USA; 0.01 g/L dissolved in RO water). These stains were selected because their excitation and emission wavelengths do not overlap, so they can be distinguished. The samples were imaged on an inverted confocal laser scanning microscope (Leica TCS SP2, Leica Microsystems, Wetzlar, D) and a limited number of images taken on the bolus samples of all 9 panellists are shown since, again, differences were characteristic between samples and not panellist specific.
Cryo scanning electron microscopy
The cryo scanning electron microscopy set up comprised of a cryo-preparation and transfer system (Oxford CT 1500, Oxford Instruments, Oxford, UK) in conjunction with an SEM (JSM 6060LV, JEOL, Tokyo, Japan). A drop of fresh bolus sample, again, taken from the emulsion part after mixing with a spatula, was contained between two metal rivets and plunged into liquid nitrogen to prevent the formation of ice crystals. The samples were then transferred to the cryo-chamber where the rivets were fractured open. To sublime water and/or ice, the samples were then heated from -180 °C to -90 °C under vacuum followed by coating with gold using argon sputtering before being transferred to the SEM stage for imaging.
Particle sizing
analysed with the equipment software using the Fraunhofer model since it was known from microscopy that the particles sizes were in the several micrometre range.
Three boluses were prepared from each chocolate by two panellists and analysed as three replicates, conducting each measurement in duplicate. Results for each panellist were averaged and are shown as volume based size distribution, volume based mean diameter and specific surface area. As aforementioned the number of panellists was limited here for practical reasons. Also we are more interested in the relative differences in particle size distribution between samples rather than panellist. Protein profiling
To profile the protein at the fat droplet interface, the protein was extracted from the fat droplets as follows. Chocolate boluses were added into 10 mL of distilled water, vigorously shaken and then centrifuged at 3000 g for 30 min at 4 °C. This allowed us to separate the cocoa solids from the fat droplets as sediment and cream phase respectively. The cream phase was carefully collected and the procedure repeated twice. Then, 2 % aqueous solution of sodium dodecyl sulfate (SDS) was added to the cream phase (5:1 by volume) followed by vigorous stirring for 20 min on a Vortex mixer at 20 °C to extract the protein from the interface. The mixture was then centrifuged at 20,000 g for 30 min at 4 °C to remove the extracted fat droplets. The protein containing serum phase was stored at -20 °C until protein profiling with the method of SDS-PAGE:
20 μL of protein sample, after defrosting for 2 h at 20
°C, was mixed with the same quantity of sample
buffer. The sample buffer was prepared with 950 μL
of Laemmli buffer (BIO-RAD, Hemel Hempstead, UK)
and 50 μL of 5% β-mercaptoethanol (BIO-RAD, Hemel
Hempstead, UK). The samples were heated at 95 °C for 10 min and then centrifuged at 13,000 g for 1 min at 4 °C. The prepared samples were then loaded onto a precast gel (Mini-PROTEAN TGX stain-free Precast
Gels, 15%, 10 wells (50 μL), BIO RAD, Hemel
Hempstead, UK). The running buffer was prepared by diluting 100 mL of the electrophoresis running buffer Tris/Glycine/SDS buffer with 1 L of water. The gel was
run at 120 V and 10 A for 45 min. 10 μL of protein
marker (10-250 kDa Precision Plus ProteinTM Pre-stained Standards, BIO-RAD, Hemel, Hempstead UK) was used in lane 1. The gel was stained with Imperial Protein Stain (Thermo Fisher Scientific, USA) and imaged using a Bio-Rad GX-800 densitometer (Hemel Hempstead, UK).
In order to identify whether the extracted protein stemmed from saliva or the chocolate itself, mechanically stimulated saliva was also profiled. This was collected by asking a panellist to rinse their mouth thoroughly with water followed by chewing a small piece of self-sealing laboratory film (Parafilm, Bermis Flexible Packaging, Neenah, USA) (approximately 5 cm x 5 cm) for 20 s to stimulate salivary flow. Saliva was then expectorated for 30 s (it was collected in the mouth and discarded) to remove any remaining debris from the oral cavity that may be present in the saliva sample. The panellist then expectorated into a sample container every 30 s for a continuous period of 3 min. The collected saliva was transferred into an Eppendorf tube and centrifuged at 3,000 g for 5 min. The salivary protein containing sediment phase was separated and stored at -20 °C until protein profiling. Friction measurement
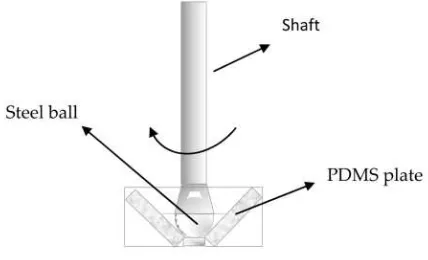
Friction properties were measured using a rheometer (MCR301, Anton Paar, Graz, Austria) fitted with a tribology cell (BC12-7, Anton Paar, Graz, Austria) applying the ball on three plates as illustrated in Figure 1. The plates were prepared from Polydimethylsiloxane (PDMS) fabricated from a two-component silicone elastomer kit (Sylgard 184, Dow Corning, Michigan, USA) and a steel ball was used. The tribology measurement was initiated with a ‘run-in’ at 100 mm/s for 10 seconds, followed by varying the sliding speed from 0.02 mm/s to 750 mm/s in 375 s at a constant normal load of 3 N at 40 °C. Results are shown for sliding speeds of larger than 0.1 mm/s. For lower sliding speeds a steep increase in friction coefficient with increasing sliding speed was observed as previously reported11. Since this behaviour is not found in classical Stribeck curves, it has not been reproduced or discussed here.
sample cell and a single measurement was performed (on each bolus). At least four boluses for each chocolate were prepared by two panellists and analysed. If friction data varied widely and were clearly identified as an outlier, additional chocolate boluses were prepared. It is widely appreciated that friction data are less reproducible and we suspect that in instances a piece of un-melted chocolate trapped at the edge of one of the PDMS plates may have caused poor data. The results are presented as average of over four sets of data. One panellist also donated saliva for friction analysis; 1 mL of saliva was added to the sample cell for analysis. The saliva collection protocol was the same as for protein profiling, see details in the next section.
Figure 1: Schematic of the tribology cell viewed from the side view
Raman spectroscopy
The method of Raman spectroscopy was applied to explore whether it would allow us to gain insight into the spatial composition of the droplets within the chocolate bolus, based on reference spectra acquired on the chocolate ingredients. The limitation to this method is the auto fluorescent nature of cocoa solids. Therefore this methods was only applied to a bolus sample from chocolate C1 since microscopic observation, reported in the results section, revealed that the droplets themselves did not feature cocoa particles. Spectra were recorded on a Horiba–Jobin–Yvon LabRAM Raman microscope with a laser wavelength of 785 nm operating at low
power (≈ 4 mW) and a 600 lines/mm grating.
Acquisition time was 60 s and two averages were taken. The edge of the fat droplet was imaged using
a 9 x 6 μm map size, and a 1.5 μm step size). The map
was then analysed by fitting the single component
spectra to each point in the map using classical least squares (CLS) regression analysis within the Horiba Labspec 6 software. Before analysis, the bolus sample was washed three times with water to remove cocoa particles in the bolus phase surrounding the droplets.
Statistical analysis of data
Statistical analysis of the data was performed using SPSS (version 16, IBM, USA). Analysis of variance (ANOVA) was applied to explore if there were any differences between the samples in terms of sensory properties. Post hoc and, where appropriate, a Tukey’s HSD test was performed to find out which
samples were significantly different to the others (α
= 0.05).
Results and discussion
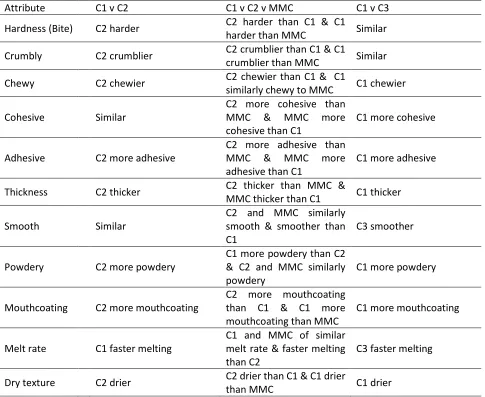
Texture and mouthfeel [image:6.595.42.256.289.419.2]Three commercially manufactured milk chocolate samples C1, C2, C3 and one lab scale chocolate MMC were evaluated for texture and mouthfeel perception using QDAs. The samples were spread across three QDAs and the results are reported in Table 2 as trends for differences or similarities in texture and mouthfeel.
thicker, more powdery, more mouthcoating and drier with the other chocolate rated as faster melting.
Table 2: Texture and mouthfeel attributes. Statistically not significant differences (< 0.05) are denoted as “similar”.
Attribute C1 v C2 C1 v C2 v MMC C1 v C3
Hardness (Bite) C2 harder C2 harder than C1 & C1harder than MMC Similar Crumbly C2 crumblier C2 crumblier than C1 & C1crumblier than MMC Similar Chewy C2 chewier C2 chewier than C1 & C1similarly chewy to MMC C1 chewier
Cohesive Similar C2 more cohesive thanMMC & MMC more
cohesive than C1 C1 more cohesive Adhesive C2 more adhesive C2 more adhesive thanMMC & MMC more
adhesive than C1
C1 more adhesive
Thickness C2 thicker C2 thicker than MMC &MMC thicker than C1 C1 thicker
Smooth Similar
C2 and MMC similarly smooth & smoother than
C1 C3 smoother
Powdery C2 more powdery C1 more powdery than C2& C2 and MMC similarly
powdery C1 more powdery
Mouthcoating C2 more mouthcoating C2 more mouthcoatingthan C1 & C1 more
mouthcoating than MMC C1 more mouthcoating Melt rate C1 faster melting C1 and MMC of similarmelt rate & faster melting
than C2 C3 faster melting
Dry texture C2 drier C2 drier than C1 & C1 drierthan MMC C1 drier
Bolus microstructure
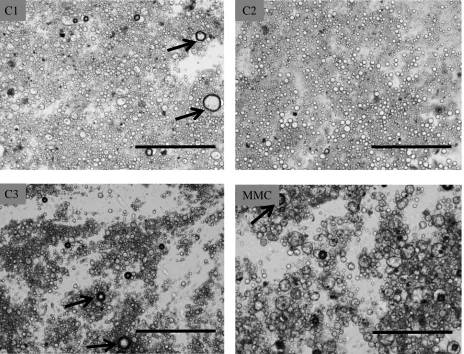
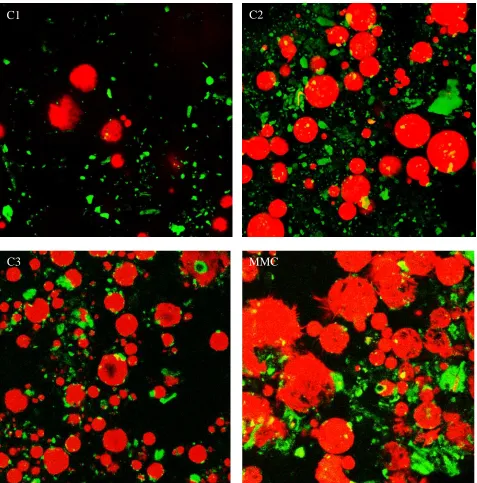
The assessment of the microstructure of all four chocolate boluses with bright field microscopy indicated it was an emulsion confirming our previous findings11. Low magnification images, see Figure 2, were acquired to highlight the differences in flocculation between the chocolate bolus emulsions.
Figure 2: Chocolate bolus bright field images. The arrows point out air bubbles. The scale bar in each image represents 400m.
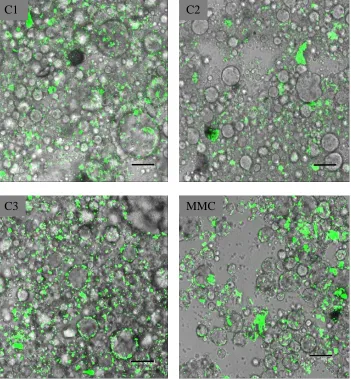
The chocolate boluses were then further examined at higher magnification to assess the microstructure at droplet level. Fluorescence microscopy was applied to visualise the spatial distribution of the cocoa solids, see Figure 3. The interfacial adsorption of cocoa solids at the droplet interfaces of the C3 and MMC bolus droplets is clearly highlighted by the fluorescence signal. While it cannot be discounted that cocoa particles were not adsorbed at the droplet interfaces of the C1 and C2 bolus droplets, they could not be detected with this technique, and therefore are either very small or absent. Instead, the cocoa solids in these two bolus samples were distributed throughout the continuous bolus phase. This may have contributed to the less flocculated emulsion microstructure compared to C3 and MMC. Interfacial adsorption of cocoa solids could be due to the absence or the slower kinetics of other interfacially
active species, present during bolus emulsion formulation and competing with cocoa solids for interfacial adsorption during oral processing.
One could assume that the spatial distribution of the cocoa solids in the chocolate bolus relates to smoothness perception. However, the C3 bolus with interfacially adsorbed cocoa solids was smoother than the C1 bolus where the cocoa solids were found to be distributed throughout the bolus sample. This observation adds to the previously made assumption that some texture and mouthfeel attributes are linked to a larger microstructure scale than that of the bolus emulsion droplets or the cocoa solids.
C1
C2
Figure 3: Chocolate bolus fluorescence micrographs, overlaid with their bright field counterparts, identifying cocoa solids as auto fluorescent. The scale bar in each image represents 50m.
The distribution of fat and protein was then examined by staining boluses separately with Nile blue and Rhodamine 6G followed by CLSM imaging. Representative micrographs highlighting the fat phase are shown in Figure 4. Images taken with the auto fluorescent channel were overlaid to highlight the cocoa solids as an integral part of the microstructure. The droplets stained throughout for fat except for some droplets in the C3 and MMC boluses. The unstained areas could be due to limited diffusion of the stain, although the micrograph for C3 indicates that droplets of similar size have stained throughout. Another explanation could be an included aqueous phase, i.e., in-vivo emulsification
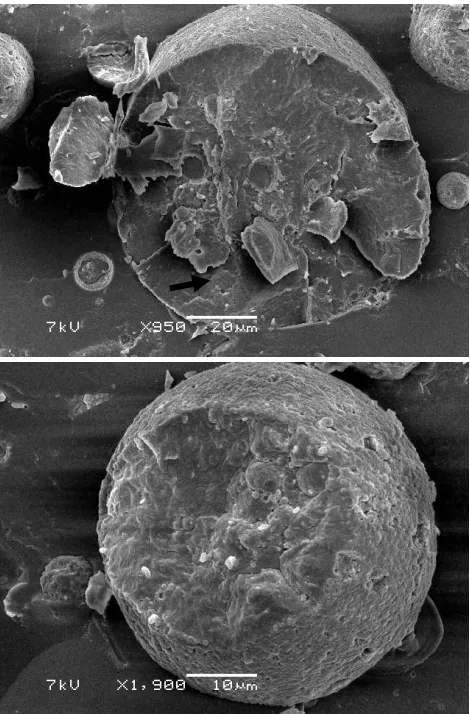
produced a complex water-in-oil-in-water (wow) type emulsion microstructure. While the unstained areas did not always appear as perfect spheres, as one would expect from included droplets, the enlarged snippets of bright field images shown in Figure 5 support this interpretation. Further evidence was found in cryo-SEM images when droplets fractured, which was not intended. By chance we acquired an image on an MMC bolus droplet clearly featuring included spherical structures, see Figure 6.
C1
C2
Figure 4: Milk chocolate bolus microstructure visualised with confocal laser scanning microscopy after staining with Nile blue (red colour) for fat shown as overlay image with the auto fluorescence (green colour) channel for cocoa solids. All images were captured at the same magnification and the image width is 150m.
The CLSM image for the C2 bolus (Figure 4) shows yellow inclusions which could be cocoa solids. In future work it is clearly worth fracturing droplets in the cryo SEM intentionally to inspect for internal microstructure. The absence of clearly visible fluorescing cocoa particles at the surface of C3 and MMC bolus droplets is most likely due to how the imaging was conducted. It is possible that the red Channel was very high in Gain covering some for the
signal of the green channel capturing the cocoa solids.
The CLSM images acquired after staining for protein were similar to those obtained after staining for fat (not included) with most of the droplets in all 4 chocolate boluses staining throughout their volume for protein. This was confirmed with alternative protein stains. The CLSM images provided an insight into the composition of the bolus droplets and highlighted the possibility of a wow emulsion
C1
C2
microstructure. However, in terms of correlation to texture properties, the CLSM images did not offer additional insights over the bright field and fluorescence images.
Figure 5: Enlarged snippets of bright field images of C2 and C3 chocolate boluses. The arrows point out drop-in-drop microstructure. The width of both images is 325 µm.
Figure 6: Cryo-SEM images of fractured MMC bolus droplets featuring spherical inclusion structures. The scale bar in the upper image corresponds to 20m and it is 10 µm in the bottom image. The spherical inclusions are less obvious in the bottom image but spherical surface adhesions are evident.
C2
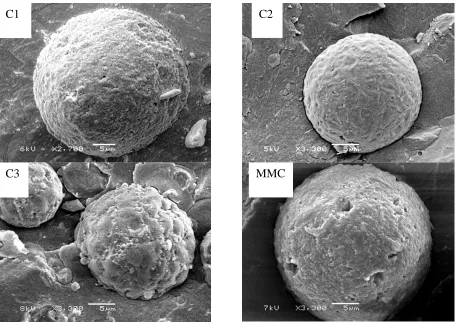
[image:11.595.54.290.143.613.2]Figure 7: Microstructure of the bolus droplet surfaces imaged with cryo-SEM. The scale bar in each image corresponds to 5m.
Finally, the surface microstructure of the bolus particles was imaged with the method of cryo-SEM, see Figure 7 for representative images. Each micrograph focussed on one droplet, therefore, droplet size was disregarded in the discussion. All bolus droplets featured a structured surface with similarities and differences between the samples. In the case of C1 and MMC, small spherical adhesions, which appeared to cover the entire droplet surface, were observed. These were also clearly identifiable on the few non-intentionally captured images of fractured droplets, see bottom image in Figure 6. The same spherical adhesions were present on the C2 and C3 bolus droplets although at a much lower number. The surface of C2 was comparatively smooth and that of C3 appeared rough. Due to their size, it is highly unlikely that the surface adhesions were related to the crystal habits of the cocoa butter or that they were protein based. This leaves two possible explanations for the origin of these small spherical adhesions. They could be small cocoa
particles that were not detected by the other microscopic techniques or small fat droplets.
The small fat droplets would have been generated during the melting of the chocolate and the break-up of larger droplets due to the flow stresses imparted to their surface during oral processing. If the viscosity ratio between droplet and continuous phase is between around 0.1 and 40, large droplets will break up into two daughter droplets and three to five very small droplets when exposed to shear stress critical to breakup17. While the deformation during oral processing is a superposition of shear and extensional elements, the shear component would have generated the observed microstructure. Based on literature data18for the viscosity of melted cocoa butter, 0.044 Pa.s at 40 °C, and the saliva phase, 0.004 Pa.s19, with the potential presence of dissolved sugar slightly elevating the viscosity, the viscosity ratio would have been somewhere between 7 and 10. While this consideration explains the presence of the small droplets, it does not account for the much
C1
C3
C2
lower number adsorbed to the C2 and C3 droplet compared to the C1 and MMC droplet. It is worth noting that adsorption seemed to have occurred prior to re-crystallisation of the cocoa butter as it was very firm – the droplets were not pulled off in the process of cryo-SEM sample preparation.
Under the assumption that these small droplets were produced at similar volume fraction in C1 and C2 chocolate boluses, their lack of surface adhesion in the case of C2 means that they were predominantly present in the salivary phase increasing its solids volume fraction. An increased solids volume in the salivary phase would normally be associated with an increase in viscosity. Indeed, C2 was rated as thicker than C1.
In terms of the surface adsorbed cocoa particles observed with the other microscopy techniques, the cryo-SEM images showed this clearly only for the MMC bolus as evidenced by the clearly discernible craters. These craters formed most likely as the result of cocoa particles being pulled off during sample preparation. It’s expected that imaging a larger number of bolus droplets would confirm that these were also present at the surface of C3 bolus droplets. Bolus particle size
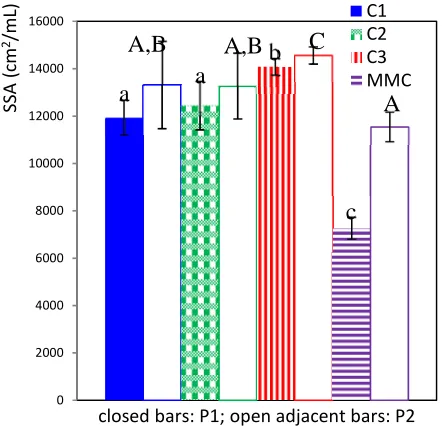
The particle size distributions of the chocolate boluses were acquired with laser diffraction equipment, see Figure 8 for the averaged results. This method cannot distinguish the nature of particles, thus the results are based on scattering data produced by a mixture of fat droplets and cocoa solids. The characteristic volume based mean diameter, d4,3, and the specific surface area, SSA, of all bolus samples are reported in Figure 9 and Figure 10 respectively. Standard deviation and indication of
statistically significant differences are included in these two figures only.
There were discernible differences between the particle size characteristics of the chocolate boluses despite some large standard deviations. The volume based mean bolus particle size of the MMC bolus was significantly larger than that of the other three boluses, backed up by the micrographs shown in Figure 2. The larger particle sizes found in the MMC bolus could be testimony of large surface adsorbed cocoa particles, as suggested by the cryo-SEM image in Figure 7. With regard to the other three boluses, in the case of panellist 2, the C1 bolus had a significantly larger mean particle size than the C2 and C3 boluses. There was no significant difference in the case of panellist 1 but the trend in the data coincides with what was found for panellist 2. As expected, the trends discussed for mean particle size were largely reversed for the specific surface area parameter depicted in Figure 10.
Figure 8: Averaged volume based particle size distribution of bolus samples for Panellist 1 and Panellist 2 (n=3).
Figure 9: Mean particle size of chocolate bolus samples calculated from particles size distributions shown in Figure 8. Different letters indicate statistically significant differences between the
samples (α = 0.05); lower case letters refer to P1 and
upper case letters to P2.
Figure 10: Specific surface area of chocolate bolus samples. Different letters indicate statistically
significant differences between the samples (α =
0.05); lower case letters refer to P1 and upper case letters to P2.
0 1 2 3 4 5 6
0.01 0.1 1 10 100 1000
Vo lu m e( % )
Particle size (mm)
Panellist 1 C1 C2 C3 MMC 0 1 2 3 4 5 6
0.01 0.1 1 10 100 1000
Vo lu m e (% )
particle size(mm)
Panellist 2 C1 C2 C3 MMC 0 10 20 30 40 50 60 70
d4,3
(
m
m
)
closed bars: P1; open adjacent bars: P2 C1 C2 C3 MMC
a
a
a
b
B
B
A
C
0 2000 4000 6000 8000 10000 12000 14000 16000 SS A (c m 2/m L) [image:14.595.65.283.413.616.2]Figure 11: Friction behaviour of chocolate boluses from panellist 1 and 2 and saliva from panellist 1 acquired at 40 °C during increase of sliding speed. The boluses were submitted to a 10 s run-in period at 100 mm/s followed by 10 s at zero speed before starting the test. The error bars indicate ± 1 standard deviation and the legend identifies the samples in order of decreasing friction coefficient between around 1 and 2 mm/s sliding speed. We have no explanation for the large error bars for MMC for panellist 2.
Friction behaviour
The friction behaviour of the chocolate boluses from panellists 1 and 2 is shown in Figure 11. The graph for panellist 1 includes a measurement on their mechanically stimulated saliva. Saliva is a good lubricant20and found to be more lubricating than the chocolate boluses. The fat droplets in the bolus samples were deformable since the measurements were conducted at 40°C, above the melting temperature of cocoa butter. However, in the case of the C3 and MMC droplet deformability could have been limited due to the interfacially adsorbed cocoa particles. It has previously been reported that particle stabilised emulsion droplets could behave similarly to solid particles in suspensions when exposed to deforming stresses21. So, the differences in droplet microstructures may have had an impact on the friction behaviour upon entrainment of these droplets between the friction surfaces.
The friction curves show two to three regimes: a regime of constant friction coefficient, a regime of decreasing friction coefficient, followed by a regime of increasing friction coefficient. The initial constant
friction coefficient regime was only observed for C1 and C2 boluses. A constant friction coefficient at low sliding speed is identified as the boundary regime where lubrication properties are dominated by the surface properties of the friction partners. This regime was followed by a decrease in friction coefficient which is the result of the selective entrainment of fluid medium between the surfaces in contact. In this so-called mixed regime, lubrication behaviour is still affected by the surface properties of the friction partners but the gap between the friction partners widens with increasing sliding speed. The boundary regime terminates with a minimum in friction coefficient. The behaviour of the chocolate boluses in this mixed regime differed between C2 and C1 for panellist 2 only on one hand side and C3 and MMC on the other hand side. C3 and MMC showed a friction coefficient plateau. While C1 followed the same pattern as C2 for panellist 2, it was more similar to C3 and MMC for panellist 1. The steady decrease in friction coefficient for C2 (and C1 for one out of two data sets) indicates that entrainment was most likely by the fluid medium phase of the chocolate bolus and the highly 0.001
0.01 0.1 1
0.1 1 10 100 1000
Fr
ic
tio
n
co
ef
fic
ie
nt
Sliding speed (mm/s) C1
C2 C3 MMC saliva
0.001 0.01 0.1 1
0.1 1 10 100 1000
Fr
ic
tio
n
co
ef
fic
ie
nt
Sliding speed (mm/s) C1
C2 C3 MMC
deformable fat droplets. The observation of a plateau for C3 and MMC suggests additional entrainment of cocoa solids. These were most likely the ones located at the fat droplet interfaces since freely suspended particles did not appear to entrain, as interpreted from the data for C1 and C2. Based on a recent publication on the friction properties of dairy semi-solid22, it was expected that sole entrainment of cocoa particles would have led to an increase in friction coefficient to reach maximum before decreasing again. The concomitant entrainment of lubricating fat droplets could be the reason for counteracting the increase in friction coefficient. The friction coefficient minimum is observed at similar sliding speed for all boluses. Inspecting for correlation between texture property assessment and friction data in this mixed regime, it is obvious to inspect mouthcoating for correlation as this property is assessed in the thin gap between tongue and palate. Indeed, C1 and C2 with their higher fiction coefficients were perceived as more mouthcoating than C3 and MMC.
The friction response following the friction coefficient minimum is dominated by the viscosity of the fluid in the gap between the friction partners23. Plotting the friction coefficient versus log (sliding speed · viscosity) would collapse the curves in this region, with the challenge of choosing a characteristic viscosity for non-Newtonian fluids. Since the viscosity of the chocolate boluses was not known from measurement, the four friction curves for each panellist were shifted along the abscissa by estimating an apparent viscosity, for each bolus, until the data in the hydrodynamic region would overlap as estimated by eye, see Figure 12. The shift factor was 1, 2.2, 0.7 and 0.5 for C1, C2, C3 and MMC for panellist 1. For panellist 2 it was 1.3, 2.6, 1 and 1 for C1, C2, C3 and MMC. So, for both panellists C2 was roughly twice as viscous as C1. Indeed, C2 was found to be thicker than C1 in the texture and mouthfeel assessment. Similarly, the shift factor for C1 for both panellists was higher than for C3 with C1 assessed to be thicker than C3. Although this tentative correlation between friction data and thickness falls
[image:16.595.318.514.151.346.2]down for MMC and C1, the conclusions are drawn on a rather limited set of panellists providing boluses for instrumental analysis.
Figure 12: Data from Figure 11 replotted over sliding speed viscosity with estimated shift factors reported in the main body text to collapse the curves in the hydrodynamic regime for each panellist.
It is worthwhile returning here to the work by the James’ group15, which was mentioned in the introduction. Their work was based on dark chocolate, thus not containing dairy protein which we found might be involved in the stabilisation of the orally emulsified fat droplets. For instance, we did not notice regions of non-emulsified fat whereas these authors suggested it might have contributed to the lower friction of their ex-vivo chocolate boluses compared toin-vitroandex-vivoboluses. Therefore, a direct comparison of the two researches is difficult and the two works should be regarded as complementary, whereby this research was motivated by an industry need and the work by the James’ group took a more fundamental approach. Surface protein composition of the bolus droplets The surface protein composition of the bolus particles was analysed using SDS page, see Figure 13. A profile for mechanically stimulated saliva was included as reference. All data traces revealed the presence of milk protein at the interface of the bolus
0.001 0.01 0.1 1
0.1 10 1000
Fr
ic
tio
n
co
ef
fic
ie
nt
sliding speed · app. viscosity (Pa mm) C1
particles. In the case of C1 and C2 lactoglobulins were not identified whereas it clearly was present at the interface of C3 and MMC bolus particles. It appears that salivary protein adsorbs at the droplet interface during the in-vivo emulsification of C3 only. To understand how this finding is linked to the interfacial adsorption behaviour of the cocoa solids during oral processing of these different chocolates, competitive adsorption studies would need to be carried out.
Figure 13: SDS-PAGE of saliva and interfacial protein extracted from the chocolate boluses. The circle indicates saliva protein bands in this sample.
Bulk composition
While the SDS page method could only provide insight into the surface protein composition of the bolus particles, Raman spectroscopic imaging allowed to scan the surface and inside of the particle. Additionally, compositional information was not limited to protein. It should be noted however that the spatial resolution of this method is not high enough to detect a single layer of surface adsorbed protein. Only the C1 bolus was considered in this first attempt to apply Raman spectroscopic mapping to a chocolate bolus. A bolus particle was scanned to
identify the internal composition through comparison with reference spectra acquired on chocolate ingredients.
The separate component maps and an overlay image acquired with Raman spectroscopic mapping, fitted using CLS regression analysis, across the interface of a C1 bolus particle are shown in Figure 14. For guidance a bright field image has been included and the black upper regions in the maps, except for the uppermost regions suggesting presence of sucrose, correspond to regions outside the sample. The scans were acquired on the particle following repeated washing with water, therefore the dark area in the top half of the images represents water. This is except for the sucrose component map and we are unable to explain presence of sucrose outside the particle. The scale bar in the images indicates the scan depths into the particle. Cocoa butter was present but it appears that the concentration of cocoa butter close to the interface was lower compared to its value at 10m or so into the droplet. The same was observed for lactose although there was a localised area of higher concentration. Comparing with the adjacent image for casein allows speculation that this localised higher concentration was at the interface since the casein signal was strong at this locus. This is highlighted by the overlay image labelled as CLS map. The pink shading corresponds to an overlay of all of the individual ingredients while the interfacial region is clearly dominated by casein.
fluorescence prevents the acquisition of clear Raman spectra.
Figure 14: Raman spectroscopic maps and bright field image acquired on washed C1 bolus particles. The Raman maps are shown for individual ingredients and in the last row as overlay image. The interface of the bolus particles is located at the upper boundary of the black area in the bright field filed image.
The interfacially active ingredients in chocolate include small molecular surfactant and this has not been tracked in our analysis of chocolate boluses thus far. Based on earlier work24, it can be assumed that they adsorb to the droplet interface during the in-vivo emulsification. Whether surfactant composition had an impact on bolus particle surface properties can only be speculated as only four chocolates were analysed and bolus particle surfaces were not examined for surfactant presence. There may well be an impact since present data indicate that the two chocolates C1 and C2 containing a mixture of surfactants (PGPR and lecithin) and C3 and MMC formulated with a single surfactant (lecithin) differ in their behaviour with regard to cocoa solid adsorption at the droplet surface. The surfactant composition may also impact on the protein adsorption duringin-vivoemulsification and indeed, the SDS data differentiate between these two sample pairs.
Conclusions
This research has for the first time shown the stabilisation mechanism of milk chocolate bolus emulsion droplets and qualitative relationships between instrumentally assessed material properties of chocolate boluses and texture/mouthfeel attributes.
It can be concluded that two types of milk chocolate bolus emulsions exist. One type is clearly characterised by cocoa particle and milk protein co-stabilisation of the emulsified fat whereas the other type appears to be predominantly stabilised by milk proteins. SDS-PAGE revealed that protein profiles were different for these two types of emulsions: lactoglobulins were missing in the co-stabilised emulsions. SDS page also revealed that for one of the four chocolates salivary proteins may be present at the droplet interface and thus may play a role in chocolate bolus emulsion droplet stabilisation. However, due to lack of evidence for three out of the four chocolates included in this study it can be
5
m
Cocoa butter
5
m
Sucrose
5
m
Lactose
5
m
Casein
5
m
Overlay image
5
m
hypothesised that their role is minor compared to the amphiphilic chocolate ingredients. Raman spectroscopy further confirmed that casein dominated the composition of the emulsion droplet interface. Since droplets with interfacially adsorbed cocoa particles could not be analysed with Raman spectroscopy as they are auto fluorescent, it should not be concluded that milk proteins are not involved in the interfacial stabilisation of the other type of milk chocolate bolus emulsion.
Imaging of the surface structure of the bolus droplets revealed a population of very small droplets, captured in the bolus particle size distributions as the fraction of particles of less than 1 µm in diameter, in addition to submicron cocoa particles potentially present. In terms of relating material properties to texture/mouthfeel perception, it was concluded that the thickness perception of a milk chocolate may relate to whether these small droplets adhere to the surface of the larger bolus droplets or whether they are dispersed in the bolus matrix fluid, thereby increasing its viscosity. Whether a chocolate was rated as thicker or less thick was also reflected in the hydrodynamic regime of the friction curves acquired on the chocolate boluses. It could also be concluded that perceived differences in mouthcoating were reflected in the comparative behaviour of the chocolate boluses in the decreasing friction coefficient regime of the Stribeck curve.
Overall, it can be concluded that the application of analytical techniques to evaluate the physicochemical material properties of chocolate boluses provides insights into the texture and mouthfeel perception of milk chocolates. Clearly, commercial application of the reported insights will require validation for the range of chocolate formulations of interest, based on an increased number of trained panellists preparing chocolate boluses for analysis. However, this study has provided a sufficient level of evidence that a reverse engineering approach could be taken although insights into how to generate the different material
behaviours has yet to be uncovered. Still, assessment of the material properties of chocolate boluses as applied in this study could be tested as a predictive tool for their comparative behaviour in texture and mouthfeel assessment.
Acknowledgements
QH and BW thank Mondelēz for funding this research
and clearing the presented work for publication. The authors are grateful to Dr Graham Rance for assistance with Raman spectroscopy measurements and the Nanoscale and Microscale Research Centre (NMRC) at the University of Nottingham for providing access to Raman spectroscopy facilities.
References
1 G. Luengo, M. Tsuchiya, M. Heuberger, J. Israelachvili,Journal of Food Science1997,62, 767-+ 10.1111/j.1365-2621.1997.tb15453.x.
2 D. Kilcast, C. Roberts, Journal of Texture Studies 1998, 29, 81-100 10.1111/j.1745-4603.1998.tb00155.x.
3 J. X. Guinard, R. Mazzucchelli,Journal of the Science of Food and Agriculture1999,79, 1331-1339 10.1002/(sici)1097-0010(199908)79:11<1331::aid-jsfa365>3.0.co;2-4.
4 G. R. Ziegler, G. Mongia, R. Hollender, International Journal of Food Properties2001,4, 353-370.
5 E. O. Afoakwa, A. Paterson, M. Fowler, Trends in Food Science & Technology2007,18, 290-298.
6 L. M. Andrae-Nightingale, S. Y. Lee, N. J. Engeseth,Journal of Texture Studies 2009,40, 427-444.
7 E. O. Afoakwa, A. Paterson, M. Fowler, J. Vieira, Journal of Food Engineering 2008, 87, 181-190.
10 A. M. Carvalho-da-Silva, I. Van Damme, B. Wolf, J. Hort,Physiology & Behavior2011,104, 929-933 10.1016/j.physbeh.2011.06.001.
11 A. M. Carvalho-da-Silva, I. Van Damme, W. Taylor, J. Hort, B. Wolf,Food & Function2013,4, 461-469 10.1039/c2fo30173c.
12 E. Silletti, R. M. P. Vitorino, R. Schipper, F. M. L. Amado, M. H. Vingerhoeds, Archives of Oral
Biology 2010, 55, 268-278
10.1016/j.archoralbio.2010.02.004.
13 E. Silletti, M. H. Vingerhoeds, W. Norde, G. A. Van Aken, Food Hydrocolloids 2007, 21, 596-606 10.1016/j.foodhyd.2006.07.004.
14 E. Silletti, M. H. Vingerhoeds, W. Norde, G. A. van Aken, Journal of Colloid and Interface Science 2007,313, 485-493 10.1016/j.jcis.2007.05.030. 15 S. Rodrigues, N. Selway, M. P. Morgenstern, L. Motoi, J. R. Stokes, B. J. James, Food & Function 2017, 10.1039/c6fo00950f.
16 M. A. E. Auty, M. Twomey, T. P. Guinee, D. M. Mulvihill, Journal of Dairy Research 2001, 68, 417-427.
17 B. J. Briscoe, C. J. Lawrence, W. G. P. Mietus, Advances in Colloid and Interface Science1999,81, 1-17 10.1016/s0001-8686(99)00002-0.
18 V. A. Fernandes, A. J. Muller, A. J. Sandoval, Journal of Food Engineering 2013, 116, 97-108 10.1016/j.jfoodeng.2012.12.002.
19 R. G. Schipper, E. Silletti, M. H. Vinyerhoeds, Archives of Oral Biology 2007, 52, 1114-1135 10.1016/j.archoralbio.2007.06.009.
20 C. Pradal, J. R. Stokes, Current Opinion in
Food Science 2016, 9, 34-41
10.1016/j.cofs.2016.04.008.
21 B. Wolf, S. Lam, M. Kirkland, W. J. Frith, Journal of Rheology 2007, 51, 465-478 10.1122/1.2714642.
22 F. C. Godoi, B. R. Bhandari, S. Prakash,Food Hydrocolloids 2017, 70, 240-250 10.1016/j.foodhyd.2017.04.011.
23 J. R. Stokes, M. W. Boehm, S. K. Baier,Current Opinion in Colloid & Interface Science2013,18, 349-359 10.1016/j.cocis.2013.04.010.