ISSN Online: 2327-5960 ISSN Print: 2327-5952
DOI: 10.4236/jss.2018.69017 Sep. 21, 2018 247 Open Journal of Social Sciences
Study on the Innovation Incubation Ability
Evaluation of High Technology Industry in
China from the Perspective of Value-Chain
—An Empirical Analysis Based on 31 Provinces
Li Zuo
1, Jianlin Zhou
2, Fengmei Wei
31College of Economics & Management, Dalian Nationalities University, Dalian, China 2Institute of Finance and Accounting, China Petroleum Finance Company, Beijing, China 3Finance Department, China National Petroleum Corporation, Beijing, China
Abstract
This paper establishes the evaluation model of innovation incubation ability by using optimal combination weight and analyzes the innovation incubation ability of high technology industry based on data from 31 provinces during the period of 2008-2012. The results show that from general prospective, the innovation incubation ability of high technology industry enters into the slow development phase in accord with “W” shape in China; from the regional prospective, Guangdong, Jiangsu and Beijing are in the lead; Tibet, Ningxia lag behind other regions; the rank of some regions is changeful; from sub-ability prospective, while resource investment ability and research and development ability overall show a downward trend, economic transformation ability shows a upward trend; besides, research and development ability makes more important contribution to the innovation incubation ability of high technology industry.
Keywords
Innovation Incubation Ability, Resource Investment Ability, Research and Development Ability, Economic Transformation Ability
1. Introduction
The total production value of high-tech industry is leapfrogging with an average annual growth rate of over 20% [1]. Meanwhile, some severe challenges such as the lack of industry chain, low-level product technology and added value and gradient patterns in regional development cannot be ignored [2]. To avoid
re-How to cite this paper: Zuo, L., Zhou, J.L. and Wei, F.M. (2018) Study on the Innova-tion IncubaInnova-tion Ability EvaluaInnova-tion of High Technology Industry in China from the Perspective of Value-Chain. Open Journal of Social Sciences, 6, 247-262.
https://doi.org/10.4236/jss.2018.69017
Received: June 8, 2018 Accepted: September 18, 2018 Published: September 21, 2018
Copyright © 2018 by authors and Scientific Research Publishing Inc. This work is licensed under the Creative Commons Attribution International License (CC BY 4.0).
http://creativecommons.org/licenses/by/4.0/
DOI: 10.4236/jss.2018.69017 248 Open Journal of Social Sciences gional shelling and rural hollowing, we should foster high-tech industries with core competence and long-term potentials. The concept of incubation innovation ability emerged as the goal of industrial incubation was put forward [3], and its social and economic returns spawned extensive attention.
Innovation incubation ability relies on innovation incubation network [4]
which mainly regards parent organizations as core carriers, serves high-growth entrepreneurs and aims to incubate high-tech industries. During the transition from corporate incubation into industrial incubation, the mother body, along with other organizations, provides new ventures with initial service support, shared resource and some operating funds [5] [6] in accordance with its exper-tise and resource network to improve new venture’s innovation ability and achievement transformation level, as well as synthetic ability of high-tech poten-tials [7]. Innovation incubation ability is regarded as a reflection to rate optimi-zation of regional technological innovation structure and function display to promote the sustainable development of high-tech industry in China. To evaluate this innovation incubation ability objectively and scientifically can foster the scientific positioning of a certain area and its feasible cultivation strategy of in-novation incubation ability, and it’s important to improve the competitive edge of high-tech industry.
Currently, scholars at home and abroad have carried out a series of related re-searches. To sum up, the existing researches mainly exhibit the following prob-lems: firstly, scholars currently pay more attention to concept connotation and functional objective concerning the research on innovation incubation ability, but they seldom make quantitative assessment. Secondly, researches are now mostly based on microscopic levels, only in the scope of incubators to analyze how to improve the management level and operational mode of incubators or improve the innovation incubation ability [7], which ignore the influences that other carriers in the incubation network have on innovation incubation ability. Thirdly, when the majority of scholars evaluate the ability of innovation incuba-tion, they rarely touch the industrial level, thus resulting in the lack of concern-ing industry incubator.
inno-DOI: 10.4236/jss.2018.69017 249 Open Journal of Social Sciences vation incubation ability can be improved according to the whole value-chain framework.
This study is to analyze the development status of innovation incubation capa-bility of provinces and cities in China on a basis of 31 provinces during the pe-riod of 2008-2012, this paper uses optimal combination weighting method and analyzes China’s high-tech industrial innovation incubation ability. The optimal combination weighting method includes G1 method [8], G2 method [9], entropy method [10] and maximize deviation method [11], which can avoid shortages of subjective assessment and objective assessment. The G1 and G2 methods are subjective evaluation methods. Their data are derived from expert experience and subjective judgment. The entropy method and the maximization of variance are objective evaluation methods. Their data are derived from the objective data in China Statistical Yearbook. By combining the weighting method, it can also allocate the contribution that every index makes to innovation incubation ability appropriately, which is conducive to a more rational evaluation result.
2. Build an Innovation Incubation Ability Index System for
High-Tech Industry
2.1. Principles
To build an innovation incubation ability index system for high-tech industry, it is important to select indexes scientifically and rationally. The indexes should follow these principles:
1) Scientific principle. The settings of index system should be in accord with innovation incubation ability’s connotation.
2) Operative principle. The settings of indexes and index system should have definitions and limits and indexes should be available.
3) Advanced principle. Indexes selected must be able to reflect the condition of innovation incubation ability instantaneously.
4) Systematic principle. Indexes selected must reflect not only resource in-vestment and efficiency condition of innovation incubation ability but also its sustainability and potentials. Stock, relative level and growth level should all be considered. To make an objective and rational evaluation, absolute index, relative index and potential index (growth rate), can be adopted to evaluate rational in-novation incubation ability.
2.2. Evaluation Index System
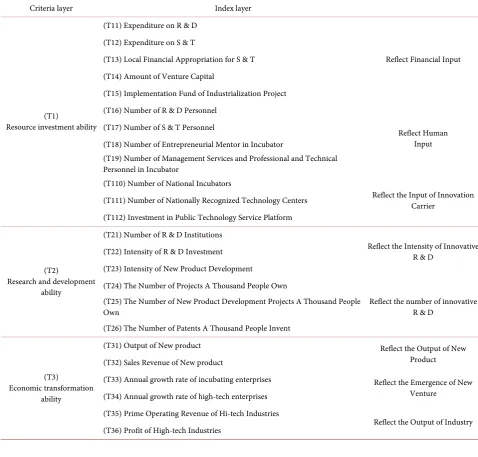
DOI: 10.4236/jss.2018.69017 250 Open Journal of Social Sciences growth startups as the core subject, taking market demand as the guidance, through the effective connection of related innovation subjects such as technical innovation, organizational innovation and management innovation incubator, to achieve the efficient allocation and integration of incubation resources within the innovation incubation network, so as to realize innovative knowledge supply, technology supply and products supply, finally to promote technology industria-lization and marketization. Thus, the operational process of high-tech industry innovation incubation system is consistent with the thoughts of innovation value chain. Optimization of high-tech industry innovation incubation system essen-tially is the realization of the value chain upgrade. Therefore, classification or evaluation of high-tech industry innovation incubation ability at the angle of value chain is scientific.
Table 1. The evaluation index system of innovation incubation ability of high technology industry.
Criteria layer Index layer
(T1)
Resource investment ability
(T11) Expenditure on R & D
Reflect Financial Input (T12) Expenditure on S & T
(T13) Local Financial Appropriation for S & T (T14) Amount of Venture Capital
(T15) Implementation Fund of Industrialization Project (T16) Number of R & D Personnel
Reflect Human Input (T17) Number of S & T Personnel
(T18) Number of Entrepreneurial Mentor in Incubator
(T19) Number of Management Services and Professional and Technical Personnel in Incubator
(T110) Number of National Incubators
Reflect the Input of Innovation Carrier
(T111) Number of Nationally Recognized Technology Centers (T112) Investment in Public Technology Service Platform
(T2)
Research and development ability
(T21) Number of R & D Institutions
Reflect the Intensity of Innovative R & D
(T22) Intensity of R & D Investment (T23) Intensity of New Product Development
(T24) The Number of Projects A Thousand People Own
Reflect the number of innovative R & D
(T25) The Number of New Product Development Projects A Thousand People Own
(T26) The Number of Patents A Thousand People Invent
(T3)
Economic transformation ability
(T31) Output of New product Reflect the Output of New
Product (T32) Sales Revenue of New product
(T33) Annual growth rate of incubating enterprises Reflect the Emergence of New
Venture (T34) Annual growth rate of high-tech enterprises
(T35) Prime Operating Revenue of Hi-tech Industries
DOI: 10.4236/jss.2018.69017 251 Open Journal of Social Sciences From the prospective of value chain, this paper divides high-tech industry in-novation incubation into three stages, namely resource investment, inin-novation development and economic transformation. And in light of those stages, it con-structs regional innovation incubation ability evaluation index system of 24 sub-indexes (Table 1).
3. Build an Innovation Incubation Ability Evaluation Model
for High-Tech Industries
An innovation incubation ability evaluation model for high-tech industries is on the basis of optimal weights combination method, the specific steps are as fol-lows:
Firstly, collect the raw data of indexes, during which the standardization is re-quired.
Secondly, determine the index weight by single evaluation weighting method such as G1 method, G2 method, entropy method and maximizing deviation method etc.
Thirdly, calculate the combination weight coefficient of different evaluation methods so as to calculate the combination weight.
Finally, calculate and rank the innovation capacity score of evaluated objects by empirical analysis as Figure 1 shows [12].
3.1. Standardized Process of Raw Data
xij is set to represent the value of the jth index of the ith object after the
standard-ized process; vij is set to represent the jth index of the ith object. n represents the
number of evaluated objects. Because all the indexes are positive, the standard-ized processing is based on positive scoring formula [13].
( )
( )
1 1( )
1
min max min
ij i n ij ij
ij i n ij i n
v v
x
v v
≤ ≤
≤ ≤ ≤ ≤
− =
−
[image:5.595.62.542.470.704.2](1)
DOI: 10.4236/jss.2018.69017 252 Open Journal of Social Sciences
3.2. Single Evaluation Weighting Method
1) G1 method
G1 method is a subjective evaluation method which shows the importance of the index by experts’ subjective ranking [8].
a) Determine the order relation of indexes, namely subjectively judging the degree of importance between different indexes.
b) Subjectively give weight to the degree of importance (Ri) of adjacent indexes
(xi and xi−1).
c) Calculate the weight of the kth index by using formula (2)
2
1 1 k
k i
i
w R
=
= + ∏
∑
(2)d) According to the weight wk, the weight of the K − 1th … 3rd and 2nd index
can be known, as shown in formula (3).
1
i i i
w− =R w∗
(3)
2) G2 method
G2 method is also a subjective evaluation method, but it is different from G1 method, which requires the experts to determine the least important index [9].
a) Determine the order relation of indexes, namely subjectively judging the degree of importance between different indexes.
b) Determine the least important index Xk by experts.
c) Experts determine and give subjective weight to the degree of importance between Xk and other index Xi.
d) Calculate the weight of the ith index by using formula (4).
e) Note: wi represents the weight of the ith index. Di represents the subjective
weight given by experts.
1
k i i i
i
w D D
=
=
∑
(4)
3) Entropy method
Entropy method shows the importance of index by calculating the difference of the same index. The larger the value is, the more important the index is [10].
a) Calculate the proportion rij of the index by using formula (5).
Note: xij represents the original value of the jth index of the ith object,
1,2, ,
i
=
n
;j
=
1,2, ,
m
;1
n ij ij ij
i
r x x
=
=
∑
(5)b) Calculate the entropy ej of the jth index by using formula (6).
Note: k=1 lnn, n is index number
( )
1
ln n j ij ij
i
e k r r
=
= −
∑
(6)c) Calculate the degree of redundancy of the entropy.
1 j j
DOI: 10.4236/jss.2018.69017 253 Open Journal of Social Sciences d) wj is set to represent the weight of the jth index, the calculation formula is as
follows:
1
m j j j
j
w d d
=
=
∑
(8)4) Maximize deviation method
Maximizing deviation method shows the importance of index by calculating the proportion of the deviation of the jth index accounting for total index
devia-tion [11]. The larger the deviation is, the more important the index is.
a) sij is set to represent the value of the jth index of the ith object after the
stan-dardized treatment. wjis set to represent the weight of the jth index. For the index
j, H wij
( )
represents the deviation of the index value of the object i and other objects (k
=
1,2, ,
n
), thus:( )
1
m
ij ij j ik j j
H w s w s w
=
=
∑
−(9)
b) Calculate the index j, the total deviation of all objects and other objects
( )
1 1
n n
j ij ik j i k
H w s s w
= =
=
∑∑
− (10)c) According to the deviation maximization principle, create optimizing model.
( )
1 1 1
2 1 max 0 s.t. 1 m n n
ij ik j j i k
j m
j j
H w s s w
w w = = = = = − ≥ =
∑∑∑
∑
(11)d) Calculate and normalize the above model so as to get the weight of devia-tion method.
1 1
1 1 1
n n ij ik i k
j m n n ij ik j i k
s s w s s = = = = = − = −
∑∑
∑∑∑
(12)3.3. Calculate the Combination Weight Coefficient
Calculating the combination weight coefficient ac is based on the following two
factors:
(
)
1 1 1,2,3,4
s c c= a s
= =
∑
(13)1) Ensure the minimization of generalized distance between weightings and ideal point [14]. li represents the generalized distance between weightings of each
objective and ideal point. c j
w represents the weighting of the jth indicator using
weighting method c. xij represents the value of the jth indicator of the ith objective
DOI: 10.4236/jss.2018.69017 254 Open Journal of Social Sciences 2) Use Jaynes maximum entropy principle to reflect the degree of consistency between each weighted result. Based on the Principle of minimum differentiation between each weighted result, the objective function (14) is defined.
(
0 1)
θ ≤ ≤θ is the balance coefficient between two objects. Referring to the literature of [14] θ=0.5
(
)
(
)
1 1 1 1
1
min 1 1 ln
s.t. 1, 0
n m s s
c
c j ij c c
i j c c
s
c c c
a w x a a
a x θ θ = = = = = − + − = ≥
∑∑∑
∑
∑
(14)3) Calculate combination coefficient by the Lagrangian function
(
)
(
)
(
)
(
)
1 1
1 1 1
exp 1 1 1
exp 1 1 1
n m c j ij i j
c s n m c j ij c i j
w x a w x
θ
θ
θ
θ
= = = = = − + − − = − + − − ∑∑
∑
∑∑
(15)3.4. Calculate the Combination Weight
Calculate the weight wc (c = 1, 2, 3, 4) of each index by using G1 method, G2
method, entropy method and maximizing deviation method respectively to cal-culate the combination weight using formula (16)
1
s c c c
w a w
=
=
∑
(16)Time the transposed wT of the weight calculated by formula (16) and the
standardized treatment of each index. The result equals to the innovation capa-bility evaluation score S of high and new technology industries of each province in China (Autonomous regions and municipalities).
(
1, 2,3, ,)
i
Q i= n represents the score of each region.
(
)
T
1, , , ,2 3 n
S w= × =X Q Q Q Q (17)
4. Empirical Analysis
The raw data of this paper are selected from China Statistical Yearbook on Science & Technology, China Statistical Yearbook on High-tech Industry, China Torch Statistical Yearbook and Ministry of Science and Technology Website during 2008 and 2012. After getting related raw data, this paper processes the calculates xij in formula (1) (
i
=
1,2, ,31
;j
=
1,2, ,24
). This paper will onlyDOI: 10.4236/jss.2018.69017 255 Open Journal of Social Sciences
Table 2. The evaluation index weight of the innovation incubation ability of high technology industry (2012).
Index G1 method G2 method
Entropy
method deviation method Index Maximize G1 method G2 method Entropy method deviation method Maximize
Index Weight Index Weight Index Weight Index Weight Index Weight Index Weight Index Weight Index Weight
T1
T11 0.0782 0.0419 0.0575 0.0316
T2
T21 0.0860 0.0457 0.0133 0.0459
T12 0.0711 0.0396 0.0355 0.0554 T22 0.0717 0.0686 0.0177 0.0421
T13 0.0247 0.0349 0.0277 0.0654 T23 0.0597 0.0640 0.0088 0.0613
T14 0.0296 0.0372 0.0557 0.0402 T24 0.0459 0.0595 0.0410 0.0411
T15 0.0414 0.0349 0.0396 0.0378 T25 0.0418 0.0549 0.0420 0.0407
T16 0.0592 0.0396 0.0584 0.0288 T26 0.0295 0.0503 0.0839 0.0218
T17 0.0456 0.0372 0.0344 0.0503
T3
T31 0.0387 0.0398 0.0672 0.0342
T18 0.0103 0.0256 0.0269 0.0395 T32 0.0425 0.0429 0.0686 0.0337
T19 0.0093 0.0233 0.0243 0.0441 T33 0.0297 0.0368 0.0137 0.0434
T110 0.0176 0.0346 0.0312 0.0423 T34 0.0270 0.0306 0.0086 0.0658
T111 0.0135 0.0326 0.0600 0.0293 T35 0.0510 0.0460 0.0514 0.0408
[image:9.595.55.540.369.454.2]T112 0.0113 0.0306 0.0913 0.0201 T36 0.0561 0.0490 0.0415 0.0441
Table 3. The combined weight coefficients about the evaluation index of innovation incubation ability of high technology industry (2008-2012).
2008 2009 2010 2011 2012
G1 method 0.2253 0.2445 0.2639 0.2985 0.3062
G2 method 0.2223 0.2280 0.2400 0.2600 0.2147
Entropy method 0.0374 0.1198 0.0756 0.0743 0.0459
Maximize deviation method 0.5150 0.4077 0.4205 0.3671 0.4333
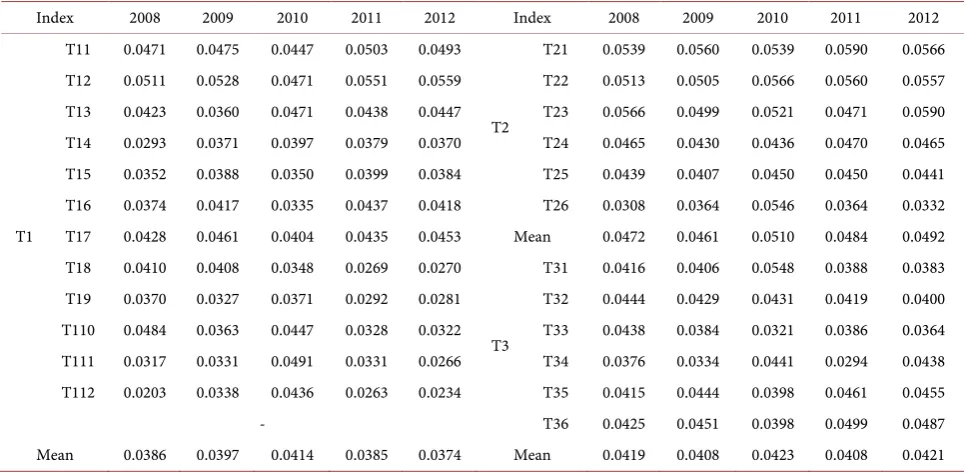
Table 4. The combined weight about the evaluation index of innovation incubation ability of high technology industry (2008-2012).
Index 2008 2009 2010 2011 2012 Index 2008 2009 2010 2011 2012
T1
T11 0.0471 0.0475 0.0447 0.0503 0.0493
T2
T21 0.0539 0.0560 0.0539 0.0590 0.0566
T12 0.0511 0.0528 0.0471 0.0551 0.0559 T22 0.0513 0.0505 0.0566 0.0560 0.0557
T13 0.0423 0.0360 0.0471 0.0438 0.0447 T23 0.0566 0.0499 0.0521 0.0471 0.0590
T14 0.0293 0.0371 0.0397 0.0379 0.0370 T24 0.0465 0.0430 0.0436 0.0470 0.0465
T15 0.0352 0.0388 0.0350 0.0399 0.0384 T25 0.0439 0.0407 0.0450 0.0450 0.0441
T16 0.0374 0.0417 0.0335 0.0437 0.0418 T26 0.0308 0.0364 0.0546 0.0364 0.0332
T17 0.0428 0.0461 0.0404 0.0435 0.0453 Mean 0.0472 0.0461 0.0510 0.0484 0.0492
T18 0.0410 0.0408 0.0348 0.0269 0.0270
T3
T31 0.0416 0.0406 0.0548 0.0388 0.0383
T19 0.0370 0.0327 0.0371 0.0292 0.0281 T32 0.0444 0.0429 0.0431 0.0419 0.0400
T110 0.0484 0.0363 0.0447 0.0328 0.0322 T33 0.0438 0.0384 0.0321 0.0386 0.0364
T111 0.0317 0.0331 0.0491 0.0331 0.0266 T34 0.0376 0.0334 0.0441 0.0294 0.0438
T112 0.0203 0.0338 0.0436 0.0263 0.0234 T35 0.0415 0.0444 0.0398 0.0461 0.0455
- T36 0.0425 0.0451 0.0398 0.0499 0.0487
[image:9.595.56.539.484.722.2]DOI: 10.4236/jss.2018.69017 256 Open Journal of Social Sciences
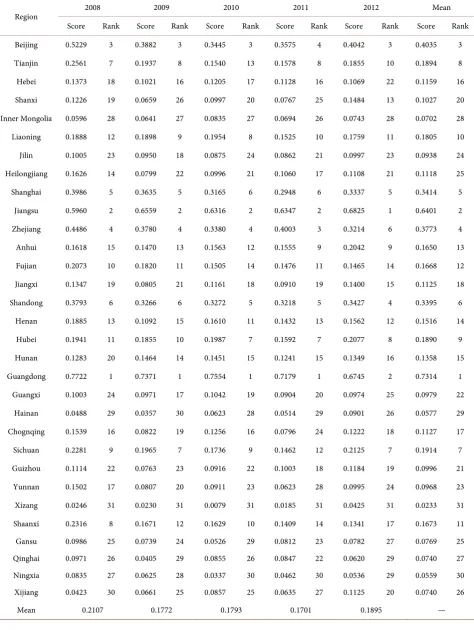
Table 5. The combined evaluation scoring & ranking about innovation incubation ability of high technology industry in provinces between 2008 and 2012.
Region 2008 2009 2010 2011 2012 Mean
Score Rank Score Rank Score Rank Score Rank Score Rank Score Rank
Beijing 0.5229 3 0.3882 3 0.3445 3 0.3575 4 0.4042 3 0.4035 3
Tianjin 0.2561 7 0.1937 8 0.1540 13 0.1578 8 0.1855 10 0.1894 8
Hebei 0.1373 18 0.1021 16 0.1205 17 0.1128 16 0.1069 22 0.1159 16
Shanxi 0.1226 19 0.0659 26 0.0997 20 0.0767 25 0.1484 13 0.1027 20
Inner Mongolia 0.0596 28 0.0641 27 0.0835 27 0.0694 26 0.0743 28 0.0702 28
Liaoning 0.1888 12 0.1898 9 0.1954 8 0.1525 10 0.1759 11 0.1805 10
Jilin 0.1005 23 0.0950 18 0.0875 24 0.0862 21 0.0997 23 0.0938 24
Heilongjiang 0.1626 14 0.0799 22 0.0996 21 0.1060 17 0.1108 21 0.1118 25
Shanghai 0.3986 5 0.3635 5 0.3165 6 0.2948 6 0.3337 5 0.3414 5
Jiangsu 0.5960 2 0.6559 2 0.6316 2 0.6347 2 0.6825 1 0.6401 2
Zhejiang 0.4486 4 0.3780 4 0.3380 4 0.4003 3 0.3214 6 0.3773 4
Anhui 0.1618 15 0.1470 13 0.1563 12 0.1555 9 0.2042 9 0.1650 13
Fujian 0.2073 10 0.1820 11 0.1505 14 0.1476 11 0.1465 14 0.1668 12
Jiangxi 0.1347 19 0.0805 21 0.1161 18 0.0910 19 0.1400 15 0.1125 18
Shandong 0.3793 6 0.3266 6 0.3272 5 0.3218 5 0.3427 4 0.3395 6
Henan 0.1885 13 0.1092 15 0.1610 11 0.1432 13 0.1562 12 0.1516 14
Hubei 0.1941 11 0.1855 10 0.1987 7 0.1592 7 0.2077 8 0.1890 9
Hunan 0.1283 20 0.1464 14 0.1451 15 0.1241 15 0.1349 16 0.1358 15
Guangdong 0.7722 1 0.7371 1 0.7554 1 0.7179 1 0.6745 2 0.7314 1
Guangxi 0.1003 24 0.0971 17 0.1042 19 0.0904 20 0.0974 25 0.0979 22
Hainan 0.0488 29 0.0357 30 0.0623 28 0.0514 29 0.0901 26 0.0577 29
Chognqing 0.1539 16 0.0822 19 0.1256 16 0.0796 24 0.1222 18 0.1127 17
Sichuan 0.2281 9 0.1965 7 0.1736 9 0.1462 12 0.2125 7 0.1914 7
Guizhou 0.1114 22 0.0763 23 0.0916 22 0.1003 18 0.1184 19 0.0996 21
Yunnan 0.1502 17 0.0807 20 0.0911 23 0.0623 28 0.0995 24 0.0968 23
Xizang 0.0246 31 0.0230 31 0.0079 31 0.0185 31 0.0425 31 0.0233 31
Shaanxi 0.2316 8 0.1671 12 0.1629 10 0.1409 14 0.1341 17 0.1673 11
Gansu 0.0986 25 0.0739 24 0.0526 29 0.0812 23 0.0782 27 0.0769 25
Qinghai 0.0971 26 0.0405 29 0.0855 26 0.0847 22 0.0620 29 0.0740 27
Ningxia 0.0835 27 0.0625 28 0.0337 30 0.0462 30 0.0536 29 0.0559 30
Xijiang 0.0423 30 0.0661 25 0.0857 25 0.0635 27 0.1125 20 0.0740 26
DOI: 10.4236/jss.2018.69017 257 Open Journal of Social Sciences From a global perspective, the average value of China’s high-tech industry in-novation incubation ability from 2008 to 2012 generally appears to be of the “W” shape, which represents W shape volatility (see Figure 2). Although the average value (0.1772, 0.1793, 0.1701, 0.1895) of China’s high-tech industry innovation incubation ability increased from 2009 to 2012, the average value is still not more than that (0.2107) in 2008. Thus, from 2008 to 2012, the development of China’s high-tech industry innovation incubation ability is relatively slow.
The possible reason for this volatility may be the financial crisis in 2008, dur-ing which the development of Chinese high-tech enterprises suffered a series of frustration, due to the influx of a large amount of capital into the real estate in-dustry, investment in high-tech industry has declined, leading to lack of resource investment for incubation ability of high-tech technology industry, thereby re-ducing the ability of innovation and incubation. Therefore, between 2008 and 2011, innovation incubation ability showed a decline in volatility. Since then, the Chinese government has realized the importance of the hi-tech industry in alle-viating the economic crisis and solving the economic sluggishness. The govern-ment has increased its support to the hi-tech industry, especially in the construc-tion of high-tech industry incubaconstruc-tion carrier, and fundamentally solved the problem of lacking of stimulus of industrial development. In order to cultivate a large number of high-tech start-ups that “focus on the rise” to lay the foundation for the development of high-tech industry, form 2011 to 2012, China’s innovation and incubation ability have shown an upward trend.
[image:11.595.212.536.473.690.2]By calculating average value of high-tech industry innovation incubation ability from all provinces and cities, it can be seen that Guangdong, Jiangsu, Beijing, Zhejiang, Shanghai, Shandong, Sichuan, Tianjin, Hubei and Liaoning are at the top 10 (see Table 5), and Guangdong, Jiangsu and Beijing are at the top 3. However,
DOI: 10.4236/jss.2018.69017 258 Open Journal of Social Sciences the capacity for Sinkiang, Qinghai, Inner Mongolia, Hainan, Ningxia and Tibet falls behind. The ranking of some provinces and cities vary because of their re-gional policies. For example, the ranking for Anhui Province rises to 9th place in
2012 from 15th place in 2008, Heilongjiang falls from 14th place in 2008 to 21st
place in 2012. But we can still see synchrony from the tendencies and economic cycles, which to some extent, shows that economic development, marketization degree, government policies and enterprise innovation can influence innovation incubation ability.
Overall, the resource investment capacity and innovation research capacity of China’s provinces and cities between 2008 and 2012 declined, whereas the eco-nomic transformation capacity grew (see Table 3, Figure 3). This may be attrib-uted to the economic instability after the financial crisis in 2008 that made peo-ple more prudent and rational on resource investment and innovation
develop-ment [15]. Since the related data for Tibet and Ningxia are deficient after the year
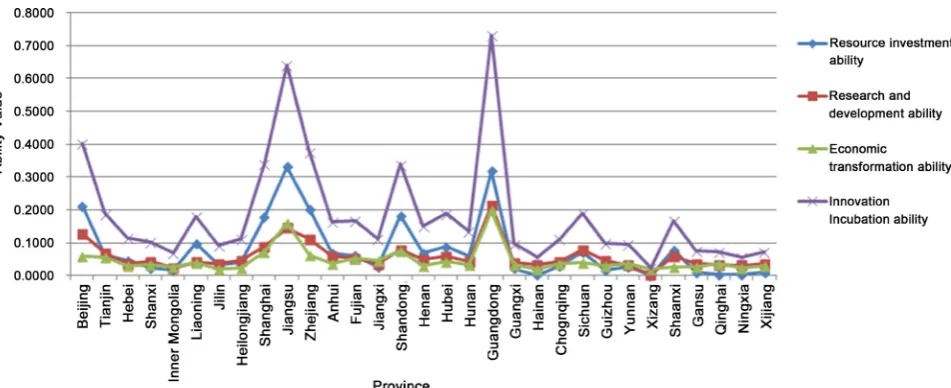
[image:12.595.122.539.488.692.2]2008, it may also influence the average value of resource investment and innova-tion development capacity. The value of economic transformainnova-tion capacity grew from the year 2010, which may be attributed to economic recovery and a better market. All provinces and cities regard economic transformation as a vital way to get out of financial crisis, trying to transform from extensive and inefficient fea-tured innovation regions into intensive and efficient ones. This requires a better standard of high-tech industrialization and marketization which can give rise to economic transformation capacity. In addition, from Figure 4, it can be seen that high-tech industrial innovation incubation ability of every province and city ac-cords with its resource investment capacity, innovation research capacity and economic transformation capacity. This shows that high-tech industry innova-tion incubainnova-tion ability is reflected by resource investment capacity, innovainnova-tion research capacity and economic transformation capacity. There are connections
DOI: 10.4236/jss.2018.69017 259 Open Journal of Social Sciences
Figure 4. The tendency about innovation incubation ability and sub-ability of high technology industry in provinces between 2008 and 2012.
among the three capacities and they coordinate with each other in the process of innovation incubation.
5. Conclusions
This paper mainly constructs the index system of China’s high-tech industrial innovation incubation ability by summarizing relevant literature and combining China’s realities and regional development. According to relevant statistical yearbook, it demonstrates high-tech industrial innovation incubation ability from 2008 to 2012. Compared with papers of the same kind, this paper has the following innovations: firstly, based on value-chain framework, this paper aims to achieve innovative resource investment, innovation development and finally the value of innovation. It divides the process of high-tech industrial innovation incubation into upstream resource investment, research and development mid-stream and economic transformation downmid-stream and it constructs the index system of high-tech industrial innovation incubation ability from aspects of re-source investment, innovation research and economic transformation. Secondly, it not only extends the way of evaluating innovation incubation ability, at the scope of incubators but also widens its understanding to regional incubating car-riers, which will influence the operation of innovation incubation system but al-so take multiple innovation carriers into consideration, such as public technolo-gical service platform, technical center, etc. It also establishes industrial norm for evaluation index system to embody industrial incubation.
The thesis concludes as follows:
DOI: 10.4236/jss.2018.69017 260 Open Journal of Social Sciences 2) Judging from various provinces and cities, Jiangsu, Guangdong, Beijing, Zhejiang, Shanghai, Shandong, Sichuan, Tianjin, Hubei, Liaoning and other provinces stood top ten in the innovation and incubation capabilities evaluation, among which Guangdong, Jiangsu, Beijing ranked the top three, whereas Xin-jiang, Qinghai, Inner Mongolia, Hainan, Ningxia, Tibet and others were still lag-ging behind.
3) Judging from sub-competitive abilities, the industrial innovation incubation ability was a combination of resource investment ability, innovative research and development ability and economic transformation ability, among which the in-novative research and development ability was the most influential and resource investment ability and economic transformation ability were next in importance. Additionally, through the analysis, in 2008-2012, the overall trend of resource investment ability and industrial innovation incubation ability has been falling, whereas the economic transformation ability has increased.
To realize the reasonable construction and layout of the high-tech industry innovation incubation ability of China, I recommended as follows: a) we need to adjust the investment structure of innovation incubation resource and value the structure and proportion of various investment resources. According to the reali-ties of various provinces and cireali-ties, we need to rely on preferential policies or fi-nancial input and other means to make up for the lack of resources. b) We need to optimize resource allocation and promote the flowing and combination of ad-vantageous resources among regions. Through matching support, the weak in-novation areas need more new resources to boost innovative campaigns and im-prove the efficiency of output. c) By strengthening the investment in innovation incubation resources to basic research area to promote interaction and connec-tion between basic research and applied research so as to improve the efficiency of innovative research and development, thus fundamentally improve the R & D capability of high and new technology. d) We need to focus on supporting and cultivating innovative incubator with a greater influence and accelerating the construction of technological achievements transformation platform. Through various forms of innovative cooperation between the main bodies of innovation, we need to actively foster scientific and technological achievements into the market and push forward the high-tech industry development. e) Chinese gov-ernments at all levels should accurately hold their own advantages, and con-stantly improve the infrastructure and financial environment. The government should stop relying on previous rules and enhance its innovation incubation ability by using administrative and marketing means, actively promote the up-grading of regional value chain and industrial chain to achieve a relatively ba-lanced development of regional innovation and incubation capacity.
Se-DOI: 10.4236/jss.2018.69017 261 Open Journal of Social Sciences condly, on further researches, the influence of the external environment factors which can be taken into accounts throughout the whole process of innovation incubation needs, such as financial environment, policy environment, education level, infrastructure construction, etc. Thirdly, the window DEA model can be considered in the future whiling researching, so as to analyze the operational ef-ficiency of the regional innovation incubation system and its subsystem’s operat-ing efficiency.
References
[1] Dan, P. (2016) Dynamics of China’s Provincial-Level Specialization in Strategic Emerging Industries. Research Policy, 45, 1586-1603.
https://doi.org/10.1016/j.respol.2016.03.022
[2] Jiang, S., Gong, L., Wang, H. and Kimble, C. (2016) Institution, Strategy, and Per-formance: A Co-Evolution Model in Transitional China. Journal of Business Re-search, 69, 3352-3360. https://doi.org/10.1016/j.jbusres.2016.02.009
[3] Mian, S.A. (1997) Assessing and Managing the University Technology Business In-cubator: An Integrative Framework. Journal of Business Venturing, 12, 251-285. https://doi.org/10.1016/S0883-9026(96)00063-8
[4] Wang, G.H. and Zhou, J.L. (2014) The Model and Simulation for Knowledge Transfer among Innovation Incubation Network Based on Small World Effect. Science of Science and Management of Science & Technology, 35, 53-63.
[5] Hughes, M., Ireland, R.D. and Morgan, R.E. (2007) Stimulating Dynamic Value: Social Capital and Business Incubation as a Pathway to Competitive Success. Long Range Planning, 40, 154-177. https://doi.org/10.1016/j.lrp.2007.03.008
[6] Tsai, F.S., Hsieh, L.H.Y., Fang, S.C. and Lin, J.L. (2009) The Co-Evolution of Busi-ness Incubation and National Innovation Systems in Taiwan. Technological Fore-casting & Social Change, 76, 629-643. https://doi.org/10.1016/j.techfore.2008.08.009 [7] Qiu, G.D. and Ma, H.D. (2010) Research on Regional Innovation System Based on
Interaction between Innovation Incubation and Venture Capital. China Soft Science, No. 2, 97-106.
[8] Wang, X.J. and Guo, Y.J. (2006) Analyzing the Consistency of Comparison Matrix Based on G1 Method. Chinese Journal of Management Science, 14, 65-70.
[9] Guo, Y.J. (2002) Comprehensive Evaluation Theory, Method and Application. Science Press, Beijing.
[10] Sakata, M. and Sato, M. (2001) Accurate Structure Analysis by the Maxi-mum-Entropy Method. Acta Crystallographica, 46, 263-270.
https://doi.org/10.1107/S0108767389012377
[11] Wei, G.W. (2008) Maximizing Deviation Method for Multiple Attribute Decision Making in Intuitionistic Fuzzy Setting. Knowledge-Based Systems, 21, 833-836. https://doi.org/10.1016/j.knosys.2008.03.038
[12] Chi, G.T., Qi, F. and Zhang, N. (2012) The City’s Ecosystem Evaluation Model Based on Optimal Combination Weights and Its Application. Operations Research and Management Science, 2, 183-191.
[13] Li, M.J., Chen, G.H. and Chen, Y.T. (2004) Research on Standardization of Indica-tors Method of Comprehensive Evaluation. Chinese Journal of Management Science, 12, 45-48.
DOI: 10.4236/jss.2018.69017 262 Open Journal of Social Sciences on Optimal Combination Weight: The Empirical Analysis of 31 Provinces. China Soft Science, No. 12, 68-81.
[15] Peng, W., Xu, Z., Zhang, Z., Wu, Y., Deng, H. and Qi, H. (2009) Research on De-velopment Model and Countermeasure of Bamboo Industry in China on Interna-tional Economic Crisis. International Conference on Electronic Commerce and Business Intelligence, Beijing, 6-7 June 2009, 328-331.