STABILITY INDICATING ANALYTICAL METHOD DEVELOPMENT AND VALIDATION
FOR THE ESTIMATION OF VORINOSTAT USING RP
*
Hepsebah, N.J.R. and Ashok Kumar, A.
Mewar University,
ARTICLE INFO ABSTRACT
A simple and effective RP capsule
at 247 nm, at flow rate of 1ml/min at retention time 3.3 min for v
the range of 5µg/ml to 25µg/ml for vorinostat. The correlation coefficient was found to be 0.999. The Recovery studies were performed for vorinostat in the range of 50%
vorinostat is 99.85 % .Fo
and the Drug Product was found to be stable in all conditions. Hence, the method could be successfully applied for routine analysis of vorinostat capsules.
Copyright © 2017, Hepsebah and Ashok Kumar. This unrestricted use, distribution, and reproduction in any medium,
INTRODUCTION
Vorinostat also known as suberanilohydroxamic acid (suberoyl+anilide+hydroxamic acid abbreviated as
member of a larger class of compounds that inhibit
deacetylases (HDAC).N-hydroxy-N'-phenyloctanediamide is the IUPAC name of vorinostat and molar mass is
and its molecular formula is C14H20N2O3.Histone deacetylase inhibitors (HDI) have a broad spectrum of epigenetic
Vorinostat is marketed under the name Zolinza
by Merck for the treatment of cutaneous manifestations in patients with cutaneous T cell lymphoma (CTCL) when the disease persists, gets worse, or comes back during or after two systemic therapies. Vorinostat has been shown to bind to the active site of histone deacetylases and act as a chelator for zinc ions also found in the active site of his tone
Vorinostat's inhibition of his tone deacetylases results in the accumulation of acetylated his tones and acetylated proteins, including transcription factors crucial for the expression of genes needed to induce cell differentiation
reveals chromatographic method [ZOU Qiao
[Patel, 2008] lc-ms method for the analysis of vorinostat in pharmaceutical dosage forms and one bioanalytical method for the analysis of vorinostat in rat plasma [Ramesh Mullangi Elham, 2010].
*Corresponding author: Hepsebah, N.J.R.,
Mewar University, Gangrar, Chittorgarh, Rajasthan
ISSN: 0975-833X
Vol.
Article History:
Received 24th September, 2017
Received in revised form
23rd October, 2017
Accepted 17th November, 2017
Published online 31st December, 2017
Citation: Hepsebah, N.J.R. and Ashok Kumar, A.
vorinostat using rp-hplc method”, International Journal of Current Research
Key words:
Vorinostat, RP-HPLC, ICH
RESEARCH ARTICLE
STABILITY INDICATING ANALYTICAL METHOD DEVELOPMENT AND VALIDATION
FOR THE ESTIMATION OF VORINOSTAT USING RP-HPLC METHOD
Hepsebah, N.J.R. and Ashok Kumar, A.
Mewar University, Gangrar, Chittorgarh, Rajasthan
ABSTRACT
A simple and effective RP-HPLC method had been developed for the estimation of vorinostat in capsule, using Apollo C18 (4.6 x 150mm, 5m), mobile phase 100% methanol, detection wavelength at 247 nm, at flow rate of 1ml/min at retention time 3.3 min for v
the range of 5µg/ml to 25µg/ml for vorinostat. The correlation coefficient was found to be 0.999. The Recovery studies were performed for vorinostat in the range of 50%
vorinostat is 99.85 % .Forced Degradation studies were conducted according to the ICH guidelines and the Drug Product was found to be stable in all conditions. Hence, the method could be successfully applied for routine analysis of vorinostat capsules.
This is an open access article distributed under the Creative Commons medium, provided the original work is properly cited.
suberanilohydroxamic acid abbreviated as SAHA) is a member of a larger class of compounds that inhibit histone phenyloctanediamide is molar mass is 264.32 g/mol Histone deacetylase epigenetic activities. Zolinza (zo-LINZ-ah) for the treatment of cutaneous manifestations in (CTCL) when the disease persists, gets worse, or comes back during or after two systemic therapies. Vorinostat has been shown to bind to the and act as a chelator for zinc ions also found in the active site of his tone deacetylases. Vorinostat's inhibition of his tone deacetylases results in the accumulation of acetylated his tones and acetylated proteins, including transcription factors crucial for the expression of Literature survey ZOU Qiao-gen, 2011] and ms method for the analysis of vorinostat in pharmaceutical dosage forms and one bioanalytical method for Ramesh Mullangi, ?;
Mewar University, Gangrar, Chittorgarh, Rajasthan.
[image:1.595.347.528.539.588.2]We here report a totally new, rapid, simple, accurate, precise and linear stability indicating RPHPLC isocratic assay method for the determination of vorinostat in capsules and validate the developed method as per ICH guidelines.
Fig. 1. Structure of vorinostat
MATERIALS AND METHODS
Chemicals and Reagents
Analytically pure sample of vorinostat with purities greater than 99% was obtained as gift
Hyderabad, India and capsule formulation [ZOLINZA] was procured from MEDPLUS Pharmacy, Hyderabad, India with labelled amount 100mg of VORINOSTAT. Methanol (HPLC grade), water (HPLC grade), were obtained from SD Fine chemicals (Hyderabad, India), 0.45μm and 0.22 μm Nylon membrane filters wereobtained from Spincotech Private Limited, Hyderabad, India.
Instrument
HPLC analysis was performed on WATERS Alliance 2695 separation module, Software: Empower 2, 996 PDA detector
International Journal of Current Research
Vol. 9, Issue, 12, pp.63237-63242, December, 2017
Hepsebah, N.J.R. and Ashok Kumar, A. 2017. “Stability indicating analytical method development and validation for the estimation of
International Journal of Current Research, 9, (12), 63237-63242.
STABILITY INDICATING ANALYTICAL METHOD DEVELOPMENT AND VALIDATION
HPLC METHOD
HPLC method had been developed for the estimation of vorinostat in m), mobile phase 100% methanol, detection wavelength at 247 nm, at flow rate of 1ml/min at retention time 3.3 min for vorinostat. Linearity was obtained in the range of 5µg/ml to 25µg/ml for vorinostat. The correlation coefficient was found to be 0.999. The Recovery studies were performed for vorinostat in the range of 50% - 150 %. The % Assay for rced Degradation studies were conducted according to the ICH guidelines and the Drug Product was found to be stable in all conditions. Hence, the method could be
Commons Attribution License, which permits
We here report a totally new, rapid, simple, accurate, precise and linear stability indicating RPHPLC isocratic assay method vorinostat in capsules and validate the developed method as per ICH guidelines.
Structure of vorinostat
MATERIALS AND METHODS
Analytically pure sample of vorinostat with purities greater than 99% was obtained as gift. Sample from sura labs, Hyderabad, India and capsule formulation [ZOLINZA] was Pharmacy, Hyderabad, India with of VORINOSTAT. Methanol (HPLC grade), water (HPLC grade), were obtained from SD Fine chemicals (Hyderabad, India), 0.45μm and 0.22 μm Nylon membrane filters wereobtained from Spincotech Private
formed on WATERS Alliance 2695 separation module, Software: Empower 2, 996 PDA detector
INTERNATIONAL JOURNAL OF CURRENT RESEARCH
and a reverse phase C18 column, Apollo C18 (4.6 x 150mm,
5m).An electronic analytical weighing balance (0.1mg
sensitivity, Sartorius, digital pH meter (DELUX model 101), asonicator (sonica, model 2200 MH) and UVVisible Spectrophotometer (Shimadzu UV-1800 series, software-UV probe version 2.42) were used
in this study.
METHODS
Selection of Wavelength
Forced degradation samples, standard and blanks along with controls were injected into HPLC at various wavelengths viz. 220nm, 254nm, 280nm and 315nm. Significant impurities and majority of impurities along with the drug were detected at 247nm and hence was chosen as suitablewavelength.
Chromatographic Conditions
The optimized method employs a reverse phase Column,
Apollo C18 (4.6 x 150mm, 5m) C18(150X4.6mm;5μ), a
mobile phase of 100% methanol , flow rate of 1 ml/min and a detection wavelength of 247 nmusing a UV detector.
Mobile Phase Preparation
HPLC Grade Methanol select as the mobile phase.
Diluent
Mobile phase was used as a diluent.
Preparation of Stock and Working Standard Solution
Accurately weigh and transfer 10 mg of Vorinostatworking standard into a 10ml of clean dry volumetric flasks add about 7ml of Methanol and sonicate to dissolve and removal of air completely and make volume up to the mark with the same Methanol. Further pipette 0.15ml of the above Vorinostatstock solutions into a 10ml volumetric flask and dilute up to the mark with Methanol to get 15µg/ml concentration.
Preparation of Stock and Working Sample Solution
Take average weight of one capsule and crush in a mortar by using pestle and weight 10 mg equivalent weight ofVorinostat sample into a 10ml clean dry volumetric flask and add about 7ml of Diluent and sonicate to dissolve it completely and make volume up to the mark with the same solvent. Further pipette 0.15ml of Vorinostatabove stock solution into a 10ml volumetric flask and dilute up to the mark with diluent to get target concentration of 15µg/ml of concentration.
RESULTS AND DISCUSSION
Method Development
RP-HPLC isocratic stability indicating assay method was developed keeping in mind the system suitability parameters i.e. Asymmetric factor (A),number of theoretical plates (N), runtime, separation of drug peak from the forced degradants, detection of drug peak along with significant impurities and majority of impurities.
In order to test the applicability of the developed method to acommercial formulation, ZOLINZA was chromatographed at working concentration (15μg/ml) and it is shown in Figure 4. The sample peak was identified by comparing the retention time with the standard drug. System suitability parameters
were within the acceptance limits, ideal for the
[image:2.595.312.555.206.335.2]chromatographed sample. Integration of separated peak area was done and drug concentration was determined by using the peak area concentration relationship obtained in the standardization step. The protocol affords reproducible assay of the drug in the sample ranging between 90 and 110%, which is the standard level in any pharmaceutical quality control.
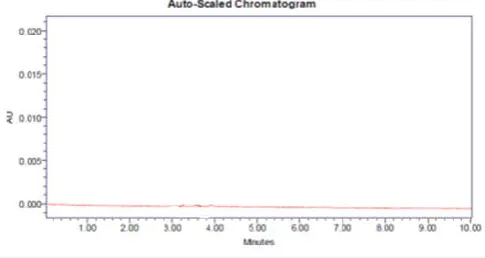
[image:2.595.320.552.371.495.2]Fig.2: Typical chromatogram of the blank.
Fig. 3. Typical chromatogram of the standard
Fig. 4. Typical chromatogram of the control formulation
Method Validation
[image:2.595.319.559.454.645.2]Specificity
Blank, standard drug solution and sample chromatogram revealed that the peaks obtained in the standard solution and sample solution at working concentrations are only because of the drug as blank had no peak at the retention time of VORINOSTAT. Accordingly it can be concluded that, the method developed is said to be specific.
Precision
System Precision
Six replicate injections of the standard solution at working concentration showed % RSD (Relative Standard Deviation) less than 2 concerning peak area for the drug, which indicates the acceptable reproducibility and thereby the precision of the system. System precision results are tabulated in Table 1.
Method Precision
Method precision was determined by performing assay of sample under the tests of repeatability at working concentration.
Repeatability (Intraday precision)
Six consecutive injections of the sample from the same homogeneous mixture at working concentration showed % RSD less than 2 concerning % assay for the drug which indicate that the method developed is method precise by the test of repeatability and hence can be understood that the method gives consistently reproducible results (Table 2).
Intermediate Precision (Ruggedness / Inter day precision)
[image:3.595.89.504.361.481.2]Six consecutive injections of the sample solution from the same homogeneous mixture at working concentration on a different day by a different analyst, showed % RSD less than 2 for % assay for the drug within and between days, which indicate the method developed is inter day precise / rugged (Table 3).
Linearity
Standard solutions of vorinostatat different concentrations level (50%, 75%, 100%, 125% and 150%) were prepared.
Calibration curve was constructed by plotting the
[image:3.595.51.544.524.612.2]concentration level of drug versus corresponding peak area.
Table 1. System Precision Results
S.No Peak Name RT Area (µV*sec) Height (µV) USP Plate Count USP Tailing
1 Vorinostat 3.379 123249 20635 7434 1.10
2 Vorinostat 3.303 123324 20587 7483 1.09
3 Vorinostat 3.322 124060 20690 7550 1.10
4 Vorinostat 3.327 124322 20883 7636 1.10
5 Vorinostat 3.310 123689 20774 7575 1.10
Average 123728.8 %RSD is less than 2 % .
STDEV 462.93487
%RSD 0.3741528
Table 2. Intraday Precision Results
S. No Peak name Retention time Area(µV*sec) Height (µV) USP Plate Count USP Tailing % ASSAY
1 Vorinostat 3.397 122374 20741 7605 1.09 98.29715
2 Vorinostat 3.390 122148 20792 7524 1.10 98.11562
3 Vorinostat 3.384 122845 20969 7592 1.11 98.03043
4 Vorinostat 3.378 121881 20889 7585 1.11 97.05618
5 Vorinostat 3.364 121166 20879 7620 1.09 96.9806
Average 122082.8 %RSD is less than 2% 97.696
STDEV 622.744490 0.626591
%RSD 0.51010010 0.641368
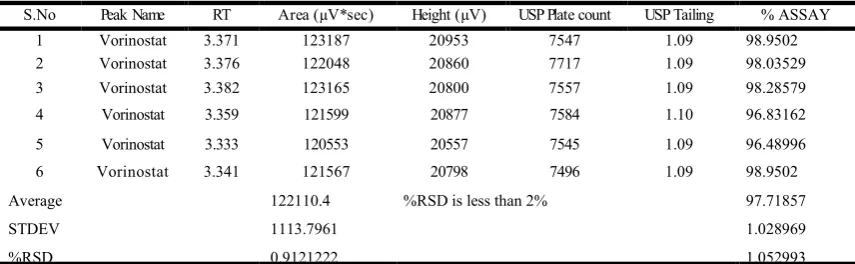
Table 3. Intermediate Precision
S.No Peak Name RT Area (µV*sec) Height (µV) USP Plate count USP Tailing % ASSAY
1 Vorinostat 3.371 123187 20953 7547 1.09 98.9502
2 Vorinostat 3.376 122048 20860 7717 1.09 98.03529
3 Vorinostat 3.382 123165 20800 7557 1.09 98.28579
4 Vorinostat 3.359 121599 20877 7584 1.10 96.83162
5 Vorinostat 3.333 120553 20557 7545 1.09 96.48996
6 Vorinostat 3.341 121567 20798 7496 1.09 98.9502
Average 122110.4 %RSD is less than 2% 97.71857
STDEV 1113.7961 1.028969
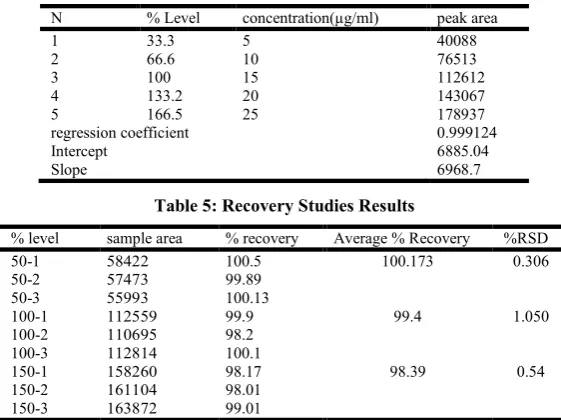
[image:3.595.83.511.650.782.2]The results show an excellent linear correlation between peak area and concentration level of drug within the concentration range (5-25μg/ml) for the drug and the results are given in Table 4 and Figure 5. The correlation coefficient of vorinostatis 0.999124 and hence the method is said to be linear in the range of 5-25 μg/ml.
Accuracy
Accuracy was determined by means of recovery experiments, by the determination of % mean recovery of sample at three different levels (50-150%). At each level, three determinations were performed. Percent mean recovery was calculated as shown in Table 5. The accepted limits of recovery are 90%-110% for the process of determining recovery of the standard from the formulation at three different levels of 50%, 100% and 150%. All observed data are within the required range which indicates good recovery values and hence the accuracy of the method developed.
Sensitivity
The sensitivity of measurement of VORINOSTAT by use of the proposed method was estimated in terms of the limit of quantitation (LOQ) and the limit of detection (LOD). LOQ and LOD were calculated by the use of the equations LOD = 3.3/S and LOQ = 10/S where is the standard deviation of response of calibration plot and S is the slope of the corresponding calibration plot. The limit of detection (LOD) and limit of quantification (LOQ)was found to be 26.100ng/ml and 79.0915ng/mlrespectively.
Forced degradation studies
Sample preparations to perform forced degradation studies
Acid degradation: Take ten average weight of the capsule powder and crush in a mortar by using pestle and weight 10
mg equivalent weight ofVorinostatsample into a 10mL clean dry volumetric flask and add about 3mL of 0.1N HCl and kept a side for 3hours and add 3mL of 0.1N NaOH solution to neutralize the solution and make the volume up to mark by using Diluent and sonicate to dissolve it completely. Further pipette 0.15ml of above stock solution into a 10ml volumetric flask and dilute up to the mark with diluent and degassed in a digital ultrasonicator for 10 minutes.
Alkaline degradation
Take ten average weight of the capsule powder and crush in a mortar by using pestle and weight 10 mg equivalent weight ofVorinostatsample into a 10mL clean dry volumetric flask and add about 3mL of 0.1N NaOH and kept a side for 3hours and add 3mL of 0.1N Hcl solution to neutralize the solution and make the volume up to mark by using Diluent and sonicate to dissolve it completely.
Further pipette 0.15ml of above stock solution into a 10ml volumetric flask and dilute up to the mark with diluent and degassed in a digital ultrasonicater for 10 minutes.
Peroxide degradation
Take ten average weight of the capsule powder and crush in a mortar by using pestle and weight 10 mg equivalent weight ofVorinostatsample into a 10mL clean dry volumetric flask and add about 3mL of Hydrogen peroxide solution and kept a side for 3hours and make the volume up to mark by using Diluent and sonicate to dissolve it completely. Further pipette 0.15ml of above stock solution into a 10ml volumetric flask and dilute up to the mark with diluent and degassed in a digital ultrasonicater for 10 minutes.
Thermal degradation
Take ten average weight of the capsule powder and crush in a mortar by using pestle and weight 10 mg equivalent weight of
Table 4. Calibration Data of vorinostat
N % Level concentration(µg/ml) peak area
1 33.3 5 40088
2 66.6 10 76513
3 100 15 112612
4 133.2 20 143067
5 166.5 25 178937
regression coefficient 0.999124
Intercept 6885.04
[image:4.595.153.434.286.496.2]Slope 6968.7
Table 5: Recovery Studies Results
% level sample area % recovery Average % Recovery %RSD
50-1 58422 100.5 100.173 0.306
50-2 57473 99.89
50-3 55993 100.13
100-1 112559 99.9 99.4 1.050
100-2 110695 98.2
100-3 112814 100.1
150-1 158260 98.17 98.39 0.54
150-2 161104 98.01
[image:4.595.78.518.529.602.2]150-3 163872 99.01
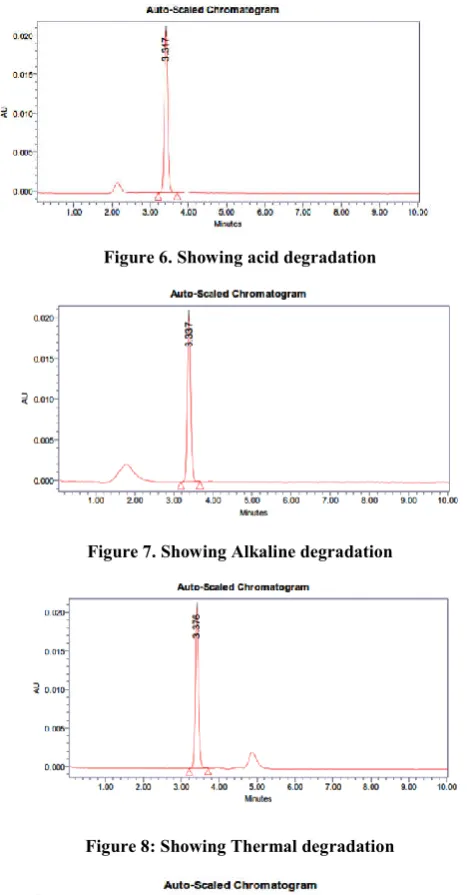
Table 6. Results for degradation studies of Vorinostat
S. no Type of degradation Weight of sample (ppm) Area of sample Assay content (% w/w) % Degradation
Without degradation 15 123249 99 -
1 Acid (0.1N HCl) 15 108756 98.937 0.06
2 Base (0.1N NaOH) 15 105241 95.6242 0.146
3 Peroxide (3% H202) 15 106524 96.833 0.135
4 Thermal (at 700 c) 15 109215 99.3 0.113
Figure 6. Showing acid degradation
[image:5.595.42.289.491.625.2]Figure 7. Showing Alkaline degradation
Figure 8: Showing Thermal degradation
Figure 9. Showing peroxide degradation
Vorinostatsample into a 10mL clean dry volumetric flask and expose to heat at 70ºc for 3hours and make the volume up to mark by using Diluent and sonicate to dissolve it completely. Further pipette 0.15ml of above stock solution into a 10ml volumetric flask and dilute up to the mark with diluent and degassed in a digital ultrasonicater for 10 minutes.
Photolytic degradation
Take ten average weight of the capsule powder crush in a mortar by using pestle and weight 10 mg equivalent weight of Vorinostatsample into a 10mL clean dry volumetric flask and expose to sunlight for 3hours and make the volume up to mark by using Diluent and sonicate to dissolve it completely.
Figure 10: showing Photolytic degradation
Further pipette 0.15ml of above stock solution into a 10ml volumetric flask and dilute up to the mark with diluent and degassed in a digital ultrasonicater for 10 minutes.
Acid degradation
Degradation was observed by the additon of 0.1 N HCl
Conclusion
A reverse phase HPLC isocratic stability indicating assay method has been developed and validated as per ICH guidelines for the quantitative estimation of VORNOSTAT in capsules Forced degradants were separated from the drug peak using the optimized method. Intra day and Inter day precision were exemplified by relative standard deviation of 0.6 and 1.5% respectively. A good linear relationship was observed for the drug between concentration ranges of 5 and 25μg/ml. Accuracy studies revealed that mean recoveries were between 90 and 110%, an indicative of accurate method. The limit of detection (LOD) and limit of quantitiation (LOQ) was found to be 26.100ng/ml and 79.0915ngrespectively. Accordingly it can be concluded that the developed reverse phase isocratic HPLC stability indicating assay method is sensitive, accurate, precise and linear and therefore the method can be used for the routine analysis of vorinostat in capsules.
REFERENCES
Ramesh Mullangi*, Manish Gupta, Vinay Dhiman, Abhishek Dixit, Kalpesh Kumar Giri, Mohd Zainuddin, Ravi Kanth Bhamidipati,PurushottamDewang, SridharanRajagopal and SriramRajagopal have reported RP-HPLC Method for the Quantitation of Vorinostat in Rat Plasma and its Application to a Pharmacokinetic Study. Pharmaceutica analyticaacta ISSN: 2153-2435 Vol 6 • Issue 7 396. doi:10.4172/21532435.1000396.
Elham A. Mohamed*, Mahasen M. Meshali, Casey L. Sayre, Stephanie E. Martinez,Connie M. Remsberg, Jody K. Takemoto,Thanaa M. Borg, Abdel Monem M. Fodaand Neal M. Davies have reportedan LC/MS Assay for Analysis of Vorinostat in Rat Serum and Urine:
Application to a Pre-Clinical Pharmacokinetic
Study.Journal of Chromatography & Separation
Techniques J Pharm Sci. 2012 Oct; 101(10): 3787–3798. ZOU Qiao-gen*, HU Zi-yan2, WEI Ping has developed a
method for determination of vorinostat and its related substances by RP-HPLC. Chinese Journal of New Drugs 2011-24.
Patel K*, Guichard SM, Jodrell DI has developed a
(Suberoylanalidehydroxamic acid, SAHA) by liquid chromatography tandem mass spectrometry for clinical studies.J Chromatogr B AnalytTechnol Biomed Life Sci. 2008 Feb 15;863(1):19-25.
International conference on harmonization of technical requirements for registration of pharmaceuticals for human use. Validation of analytical procedures: Text and methodology ICH Q2 (R1). 2005.