ISSN Online: 2473-1900 ISSN Print: 2473-1889
DOI: 10.4236/ojogas.2019.41003 Jan. 30, 2019 31 Open Journal of Yangtze Gas and Oil
Study on the Critical Production Calculation
Method of the Water-Flooding Reservoir
with Gas Cap
Cunliang Chen, Ming Yang, Xue Liu, Fei Shi, Meijia Liu
CNOOC China limited Tianjin Branch, Tianjin, China
Abstract
The aim of this paper is to solve the problems that the existing method of critical production of gas cap reservoir is only suitable for single-phase flow, and the method of critical production of gas cap reservoir under water-flooding is still blank. In this paper, the relationships between dynamic and static equili-brium, plane radial flow theory, oil-water infiltration method and three-dimensional seepage field decomposition theory, were applied to study a calculation method for critical production of directional wells and horizontal wells. Furthermore, the effects of different factors on critical output were stu-died, such as horizontal permeability, ratio of horizontal permeability to ver-tical permeability, length of horizontal section, effective thickness, viscosity of crude oil and water content etc. Results show that the critical production in-creases with the increment of the horizontal permeability, the ratio of the ver-tical permeability to the horizontal permeability, the reservoir thickness and the horizontal well length; when the viscosity of crude oil is small, the critical production decreases first and then increases with the increase of water con-tent; when the viscosity of crude oil is high, the critical production increases continuously with the increase of water content. This study could provide theoretical and technical guidance for changing of the working system of oil wells. It can avoid gas channeling and improve the development effect.
Keywords
Water-Flooding, Gas Cap Oilfield, Horizontal Well, Critical Production, Gas Peak Coning, Water Cut
1. Introduction
The reservoir with a gas cap is a special reservoir type. After the gas cap reservoir
How to cite this paper: Chen, C.L., Yang, M., Liu, X., Shi, F. and Liu, M.J. (2019) Paper Title. Open Journal of Yangtze Gas and Oil, 4, 31-42.
https://doi.org/10.4236/ojogas.2019.41003 Received: March 7, 2018
Accepted: January 27, 2019 Published: January 30, 2019 Copyright © 2019 by authors and Scientific Research Publishing Inc. This work is licensed under the Creative Commons Attribution International License (CC BY 4.0).
http://creativecommons.org/licenses/by/4.0/
DOI: 10.4236/ojogas.2019.41003 33 Open Journal of Yangtze Gas and Oil
2. Critical Production of Directional Well
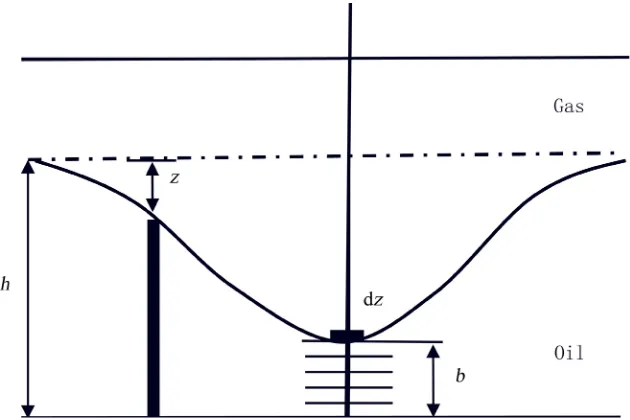
[image:3.595.216.531.219.429.2]Critical production is the max production when the wells don’t have gas break-through. The critical condition means that the oil-gas interface stays on the top of well perforation interval steadily, as shown in Figure 1. By the stress analysis of the differential element on GOC, considering the downward force as vertical compressive stress and upward force as stress caused by oil/gas gravity difference, the downward force and the upward force should be equal when the GOC stays stably, as shown in Equation (1).
Figure 1. GOC infinitesimal of reservoir with gas cap.
go
d d d d d
dp z Az = −∆ρ g z A (1) Then we obtain
go
dp= −∆ρ g zd
(2) where dp is the pressure difference, dz is the thickness of infinitesimal, dA is the area of infinitesimal, and ∆ρgo is the difference of oil and gas density.
2.1. Critical Production Calculation before Water Breakthrough
Before water breakthrough, only oil phase flow into the hole of production well. Based on the theory of radial flow, the migration velocity of fluid is defined by
o d d k p v
r
µ
=
(3)
where v is the migration velocity, k is the absolute permeability, and μo is the oil viscosity.
Production equation is expressed as
DOI: 10.4236/ojogas.2019.41003 34 Open Journal of Yangtze Gas and Oil Cross section area is expressed as
(
)
2π
A= r h z−
(5) Combining Equations (3)-(5), we obtain
(
)
o d 2π d k p
q r h z
r
µ
= −
(6) From Equations (6) and (2), we can rewrite Equation (6) as
(
)
go o d 2π d g z kq r h z
r
ρ
µ
−∆
= − (7)
Boundary conditions are considered. w
e 0
r r z h b r r z
= = −
= =
(8)
By integrating Equation (7), we obtain surface critical production.
c o
q q B= (9)
(
2 2)
go c e o o w π ln
k g h b
q r B r ρ µ ∆ − = (10)
where qc is surface critical production, Bo is volume factor of oil, and b is the thickness of perforation.
Considering the well skin factor, finally we obtain the critical well production before the water breakthrough.
(
2 2)
go c e o o w π ln
k g h b q r B s r ρ µ ∆ − = + (11)
where s is the skin factor.
2.2. Critical Production Calculation after Water Breakthrough
After the breakthrough, both the oil phase and the water phase flow into the wellbore, Equation (11) is not applicable to calculate the production, but the phase production can be obtained with the same method.
For oil phase
(
2 2)
ro go oc e o o w π ln
kk g h b q r B s r ρ µ ∆ − = + (12)
For water phase
(
2 2)
rw go ow e w w w π ln
kk g h b q r B s r ρ µ ∆ − = + (13)
DOI: 10.4236/ojogas.2019.41003 35 Open Journal of Yangtze Gas and Oil oil phase, qow is the critical production of water phase, krw is the relative permea-bility of water phase, Bw is volume factor of water, and μw is viscosity of water.
Well critical production calculation after the water breakthrough is calculated by combining Equations (12) and (13).
(
2 2)
(
2 2)
ro go rw go
c oc wc
e e
o o w w
w w
π π
ln ln
kk g h b kk g h b
q q q
r r
B s B s
r r
ρ ρ
µ µ
∆ − ∆ −
= + = +
+ +
(14)
Water cut is an important evaluation index after the water breakthrough. Eq-uation (14) is used as a function of water cut for filed application. Relative per-meability curve is the function of water saturation, and is inducted to calculate the relation between critical and water cut. The specific steps are as follows. First the relationship between water saturation and water cut was stabilized by calcu-lating water cut with relative permeability carve. Then the inverse method was used to calculate the water saturation with practical well water cut and relevant oil/water relative permeability was obtained. Finally the critical rate was calcu-lated by introducing relative permeability to Equation (14).
3. Critical Production of Horizontal Wells
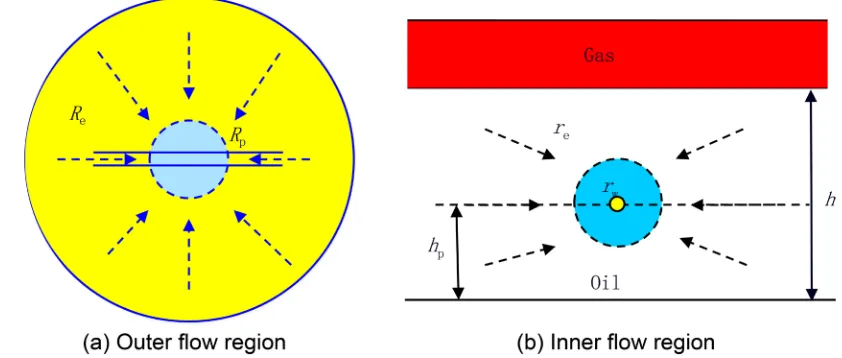
[image:5.595.236.515.514.724.2]Calculation method of critical production for horizontal wells was studied by using 3D flow theory. A 3D flow field of horizontal wells in formation consists of two 2D flow regions (the inner region and outer region, as shown in Figure 2). Every 2D flow region is equivalent to a vertical well. In the inner region, cross section A is considered as a horizontal circle drainage area, where Re is outer drainage radius, Pe is bounder pressure, Rp is equivalent well radius, and Pwf is bottom hole flowing pressure, as shown in Figure 3(a). In the outer region, cross section B is considered as a vertical drainage area, where rw is wellbore ra-dius, and re is inner drainage radius, as shown in Figure 3(b).
DOI: 10.4236/ojogas.2019.41003 36 Open Journal of Yangtze Gas and Oil
Figure 3. Classified flow region of horizontal well in formation.
3.1. Critical Production Calculation before Water Breakthrough
For the outer flow region, critical production of horizontal well can be obtained from Equation (10).
(
2 2)
h go p
c1
e o o
p π
ln
k g h h
q
R
B s
R
ρ
µ
∆ −
=
+
(15)
where
2 2
e π 2 2
L a a M
R
+ −
= = , and Rp=L 4. qc1 is the critical production of outer flow region, M is drainage area, a is the long half axle of elliptical flow region, L is the length of horizontal well, kh is the horizontal permeability, hp is the distance between the wellbore and the reservoir bottom, Re is the drainage radius, and Rp is the equivalent well radius of circular drainage area.
For inner flow region, considering the well length as thickness, the production of horizontal well in vertical cross-section can be expressed with horizontal radi-al fluid flow method.
v c2
e o o
w 2π
ln k L p q
r
B s
r
µ
∆ =
+
(16)
where re =hp. qc2 is the critical production of inner flow region, re is the drai-nage radius of inner flow region, kv is the vertical permeability, and ∆p is the pressure difference.
When the production of the outer region is the critical production, the pres-sure difference can be expressed as
(
2 2)
go p
2
g h h p
h
ρ
∆ −
DOI: 10.4236/ojogas.2019.41003 37 Open Journal of Yangtze Gas and Oil
(
2 2)
v go p
c2 e o o w π ln
k L g h h q
r
B h s
r ρ µ ∆ − = +
(18)
And the critical production of horizontal wells before water breakthrough can be expressed as
(
2 2)
(
2 2)
h go p v go p
c c1 c2
e e o o o o w p π π ln ln
k g h h k L g h h
q q q
r
R B h s
B s r
R ρ ρ µ µ ∆ − ∆ − = + = + + + (19)
3.2. Critical Production Calculation after Water Breakthrough
After water breakthrough, critical production of horizontal wells can be calcu-lated using the same method as the directional wells.Critical production of outer flow region is
(
2 2)
h go p ro rw
c1
e o o w w
p π
ln
k g h h k k
q R B B s R ρ µ µ ∆ − = + + (20)
Critical production of inner flow region is
(
2 2)
v go p ro rw
c2
o o w w
e
w π
ln
k L g h h k k
q B B r h s r ρ µ µ ∆ − = + +
(21)
Critical production is
(
2 2)
h v ro rwc h go p
e e o o w w
p w
π
ln ln
k L k k
k
q k g h h R
B B
r
s h s
R r ρ µ µ = ∆ − + + + + (22)
The relationship between critical production and water cut can be established by the same method of directional wells.
4. Factor Analysis
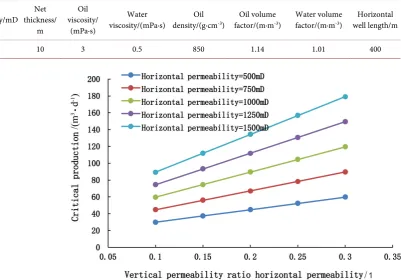
Factor analysis was carried out using data from Bohai oilfield. The layer geolog-ical and fluid parameters are shown as Table 1.
As shown in Figure 4, for horizontal wells, when the water cut is the same, the critical production increases with the increment of the horizontal permeability and the ratio of vertical permeability to horizontal permeability. This is because the better the reservoir property is, the greater the production capacity is and the better the stability of gas cone is. Directional wells also have similar laws.
DOI: 10.4236/ojogas.2019.41003 38 Open Journal of Yangtze Gas and Oil
Table 1. Geological and fluid parameters of reservoir.
Parameters Permeability/mD thickness/ Net m
Oil viscosity/
(mPa·s)
Water
viscosity/(mPa·s) density/(g·cmOil -3) factor/(m·mOil volume -3) Water volume factor/(m·m-3) well length/m Horizontal
[image:8.595.209.542.414.613.2]Values 1000 10 3 0.5 850 1.14 1.01 400
Figure 4. Critical production curve to different permeability.
Figure 5. Critical production curve to different reservoir thickness and well length.
the less likely it is for the gas channeling to occur. For horizontal wells, the longer the horizontal section is, the more stable the gas cone is, and the less likely it is for the gas channeling to occur. Directional wells also have similar laws in net thickness.
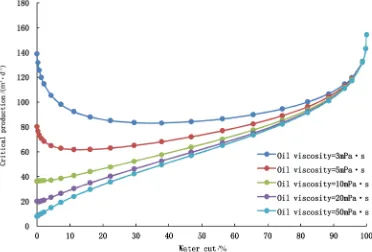
in-DOI: 10.4236/ojogas.2019.41003 39 Open Journal of Yangtze Gas and Oil crement of water cut. If the critical production before breakthrough is set to well work system, gas channeling will happen. So the well production should be li-mited after the water breakthrough to avoid gas channeling. When the oil vis-cosity is larger than 10 mPa·s, the critical production increases with the incre-ment of water cut. Raising liquid production of well properly can be imple-mented when the water cut is high. Directional wells also have similar laws.
Figure 6. Critical production curve to different oil viscosity.
5. Example Applications
BZ oilfield is a complex fault-block oil field with gas cap on Bohai bay yellow river estuary sag. The reliability of the method was illustrated by an example of a well. The critical production of a production well was calculated by using Equa-tions (19) and (22). The critical production before water breakthrough was 139 m3/d. But when the water cut is 20%, the critical production is 92 m3/d. Then the working system of the well was adjusted according to the calculated results. The daily fluid production was limited from 110 m3/d to 80 m3/d. Production prora-tion of the other wells was optimized using the study results. The steam oil ratio of oilfield goes down and oil production goes steadily after optimization as shown in Figure 7.
estab-DOI: 10.4236/ojogas.2019.41003 40 Open Journal of Yangtze Gas and Oil lished with “single well customization”. Five wells were treated with increasing the pump frequency, and six wells were treated with decreasing the chock size or pump frequency. The daily oil of 11 wells was increased by 94 m3/d by working system optimization (Table 2).
Figure 7. Production history curve of oilfield.
Table 2. Effect of 11 wells working system optimization in gas cap reservoir of BZ oilfield.
Well No.
Oil Viscosity
/mPa·s
Before optimization
Measure
After optimization Liquid
/(m3·d−1) /(mOil 3·d−1) Water cut/% /(mGOR 3·m−3)
Calculated critical production
/(m3·d−1)
Liquid
/(m3·d−1) /(mOil 3·d−1) Water cut /% /(mGOR 3·m−3) Oil increment /(m3·m−3)
A01h 10 80 23 71.3 38 116
Pump frequency increasing
115 33 71.4 42 10 A10h 3 100 98 2 61 160 157 155 1.3 63 57 A13h 5 61 29 52.5 50 93 90 41 54.4 53 12 A37h 10 71 16 77.5 46 120 120 25 79.2 47 9 F22h 3 73 45 38.4 65 105 105 64 39 75 19 A02h 5 110 108 1.8 167 100
Pump frequency decreasing
100 99 1 122 −9 D02h 10 58 30 48.3 90 45 41 25 39 61 −5 A19h 1.5 166 98 41 166 145 140 103 26.4 108 5 A29h 3 122 20 83.7 187 90 90 23 74.4 120 3 A33h 3 100 71 29 221 80 Shrink the
nozzle
80 66 17.5 155 −5 F32h 1.5 167 101 39.5 149 140 140 99 29.3 117 −2
Summation 94
6. Conclusions
[image:10.595.57.541.405.633.2]DOI: 10.4236/ojogas.2019.41003 41 Open Journal of Yangtze Gas and Oil 2) New critical production calculation method of horizontal wells was set up using 3D flow field decomposition theory of horizontal wells.
3) Oil viscosity affects the relationship between critical production and water cut. When the oil viscosity is low, the critical production decreases firstly and then increases with the increment of the water cut. Well working system should be adjusted to avoid gas channeling. And when the oil viscosity is high, the criti-cal production increases with the increment of the water cut. Liquid production of wells can be raised properly.
Conflicts of Interest
The authors declare no conflicts of interest regarding the publication of this pa-per.
References
[1] Muskat, M. and Wycokoff, R.D. (1935) An Approximate Theory of Water-Coning in Oil Production. Transactions of the AIME, 114, 144-163.
https://doi.org/10.2118/935144-G
[2] Mayer, H.I. and Garder, A.O. (1954) Mechanics of Two Immiscible Fluids in Por-ous Media. Journal of Applied Physics, 25, 1400-1406.
https://doi.org/10.1063/1.1721576
[3] Schols, R.S. (1972) An Empirical Formula for the Critical Oil Production Rate. Er-doel-Erdgas, 88, 6-11.
[4] Wheatley, M.J. (1985) An Approximate Theory of Oil/Water Coning. SPE Annual Technical Conference and Exhibition, Las Vegas, 22-26 September 1985, SPE-14210.
https://doi.org/10.2118/14210-MS
[5] Chaperon, I. (1986) Theoretical Study of Coning toward Horizontal and Vertical Well in Anisotropic Formations: Subcritical and Critical Rates. SPE Annual Tech-nical Conference and Exhibition, New Orleans, 5-8 October 1986, SPE-15377. [6] Giger, F.M. (1989) Analytic Two-Dimension Models of Water Cresting before
Breakthrough for Horizontal Wells. SPE Reservoir Evaluation & Engineering, 4, 409-416.https://doi.org/10.2118/15378-PA
[7] Joshi, S.D. (1991) Horizontal Well Technology. PennWell Publishing Company, Tulsa, 59-105.
[8] B., Guo and Lee, R.L. (1992) Determination of the Maximum Water-free Produc-tion Rate of a Horizontal Well with Water-Oil-Interface Cresting. SPE Rocky Mountain Regional Meeting, Casper, 18-21 May 1992, SPE-24324.
[9] Fan, Z.F. and Lin, Z.F. (1994) A Study of Critical Rate of a Horizontal Well in a Re-servoir with Bottom-Water Drive. Petroleum Exploration and Development, 21, 65-70.
[10] Dou, H.E. (1994) Calculation of Critical Flow Rate for Horizontal Well in Bot-tom-Water Oil Reservoir. Oil Drilling&Production Technology, 21, 70-75.
[11] Zhou, D.Y., Jiang, T.W., Zhao, J.Z., et al. (1995) The Uncertainty and Prediction of Critical Output of Horizontal Wells in Bottom Water Reservoir. Drilling & Produc-tion Technology, 28, 33-36.
[12] Li, C.L., Yang, B.X. and Cheng, L.S. (2004) A Method to Determine the Optimum Perforation Place and Height in a Vertical Well of Gas-Water Coning Reservoir.
DOI: 10.4236/ojogas.2019.41003 42 Open Journal of Yangtze Gas and Oil
[13] Rao, Z., Wu, F. and Li, X.P. (2006) The Method of Ascertaining the Horizontal Well’s Reasonable Position in Gas-Cap Reservoir. Journal of Southwest Petroleum Institute, 28, 7+42-44.
[14] Lv, A.M. and Yao, J. (2007) Study on Optimal Vertical Position of Horizontal Well in Gas-Cap Reservoir. Oil Drilling & Production Technology, 29, 98-99.
[15] Wang, D.L., Ling, J.J., Zheng, S.J., et al. (2008) Study on Optimum Vertical Location of Horizontal Wells in Reservoir with Bottom Water and Gas Cap. Fault-Block Oil and Gas Field, 15, 76-79.
[16] Yao, K., Chen, S.Y., Jiang, H.Q., et al. (2009) Research and Application of Critical Productivity in Water-Driving Development Horizontal Well Reservoirs. Petroleum Geology and Recovery efficiency, 16, 77-80.
[17] Zhou, K., Tang, H., Lv, D.L., et al. (2010) Optimum Perforated Position for Gas Cap and Bottom Water Reservoir. Well Testing, 19, 8-10.
[18] Chen, Y.Q. (2010) New Methods to Predict Critical Production Rates in Horizontal Wells with Water and Gas Coning. China Offshore Oil and Gas, 22, 22-26.
[19] Tu, B., Han, J. and Sun, J. (2014) A Calculation Method of Critical Production for Oil Wells in Thick Reservoirs with Bottom Water. Petroleum Drilling Techniques, 42, 107-110.
[20] Yuan, L., Li, X.P. and Liu, P.P. (2015) New Method for Determining Critical Rate of Horizontal Well in Gas Cap and Bottom Water Reservoirs. Lithologic Reservoirs, 27, 122-126.
[21] Yuan, L., Li, X.P. and Yan, Y.C. (2015) New Method for Determination of Hori-zontal Well Critical Output in Bottom-Water Reservoir. Natural Gas and Oil, 33, 65-68.