ISSN Online: 2150-4067 ISSN Print: 2150-4059
Inquiry into FDI Pattern of China and the
Economies along the Belt & Road
Junrong Liu
*, Yuan Liu
Trans-Himalaya Studies Center, Leshan Normal University, Leshan, China
Abstract
This paper empirically analyzes the FDI Pattern of China and the other economies along the Belt & Road Initiative. The analysis results show that 1) the mutual FDI between China and the economies along the Belt & Road re-gions has continuously increased, and the mutual dependence of FDI contin-ues to deepen, but there still is some imbalance existing in FDI dependence and distribution; 2) the Belt & Road Initiative has its objective material basis and subjective willingness for regional FDI cooperation; 3) China and the other economies along the Belt & Road Initiative, need to further utilize the complementary advantages in their industrial and economic structures for deepening the bilateral and multilateral FDI cooperation; 4) China and the countries along the Belt & Road need to clear the investment barriers and achieve a win-win situation for international investment and cooperation, in order to promote the continuous deepening of the Belt & Road Initiative and realize regional common prosperity.
Keywords
Belt & Road Initiative, Direct Investment Pattern, Direct Investment Dependence, Regional Common Prosperity
1. Introduction and Previous Studies
The Belt and Road Initiative (hereinafter referred to as OBOR), a sub-region cooperation initiative, has been put forward by the Chinese government. The In-itiative aims to create active economic partnership between OBOR Economies and China. OBOR, bannered with peaceful development, revives the historical and ancient Silk Road, by developing and evolving into a sub-regional commu-nity of interest, fate and responsibility with multilaterally political trust, eco-nomic integration and cultural inclusiveness. Foreign direct investment (FDI) How to cite this paper: Liu, J.R. and Liu,
Y. (2018) Inquiry into FDI Pattern of China and the Economies along the Belt & Road. Technology and Investment, 9, 161-177. https://doi.org/10.4236/ti.2018.93012
Received: June 24, 2018 Accepted: August 10, 2018 Published: August 13, 2018
Copyright © 2018 by authors and Scientific Research Publishing Inc. This work is licensed under the Creative Commons Attribution International License (CC BY 4.0).
http://creativecommons.org/licenses/by/4.0/
Open Access
has long been considered as the important content of financing which proves the nucleus agent driving ahead the cooperation of OBOR economies. Hence, the research on OBOR economies’ FDI pattern and FDI dependence within OBOR regions enjoys very important significance, which is the main research content of this article.
Scholars have carried out extensive research on OBOR, especially in the study of China’s direct investment in the countries along OBOR regions. The recent research of “direct investment in OBOR regions” mainly covers four aspects in-cluding evaluation of investment risk, location choice of investment, investment selection and the general investment pattern.
In the study of the investment risk, Wang Yongzhong and Li Xichen (2015) [1], Huang He and Starostin Nikita (2016) [2], Li Xiaomin and Li Chunmei (2016) [3], Zhou Wuqi (2015) [4], Nie Na (2016) [5], Zhao Zhou (2015) [6], Cui Na (2017) [7], Hu Wei and Sun Haokai (2016) [8] and others studied on China’s direct investment in the countries along OBOR regions in terms of assessing and analyzing the political risks, institutional risk and economic risk, and so on from the regional and country perspectives. Moreover, they have promoted risk iden-tification and risk prevention measures accordingly.
In the study of location choice, Wang Peizhi, Pan Xinyi and Zhang Shuyue (2018) [9], Sun Qiankun (2017) [10], Peng Jizeng (2017) [11], Yang Lijun (2017) [12], Liu Xiaofeng, Ge Yuejing and Zhao Yabo (2017) [13], Sun Pengjun and Yu Peng (2016) [14], Li Qinchang and Xu Weicong (2017) [15] and others had in-tensive study on the location choice of China’s direct investment in countries along OBOR from theoretical and empirical perspective, which includes the principle, determinant and influence factors, and mechanism of location choice, etc.
In the study of industry selection, Li Kun (2016) [16], Wu Lin and Li Liqin (2015) [17], Zhou Guolan, Zhou Jihe, Ji Kaiwen (2017) [18], Li Qinchang and Xu Weicong (2017) [19] and other scholars had a systematic research on the in-fluence factor, selecting orientation, and principle and strategy of industry selec-tion of China’s direct investment in OBOR countries.
In the study of the general pattern, Ding Zhifan and Sun Genjin (2016) [20], Jin Fang (2016) [21], Dong Qin (2016) [22], Zheng Lei and Liu Zhigao (2015) [23] had a systematic study on re-layout of regional investment, promotion of direct investment, benefit sharing of international investment, and the motiva-tions, mechanisms and measures of China’s OFDI pattern reconstruction based on OBOR.
However, these studies mentioned above have considered China’s direct in-vestment in the countries along OBOR regions as a main research, they omitted the analyses of direct investment distribution of OBOR regions including China and the research on investment dependence between OBOR economies and China. This paper mainly analyses these omissions with exploring the feasibility and possibility of OBOR construction, which also illustrates that the direct
vestment cooperation of China. These countries collectively form the regional common needs with an objective towards a multilateral win-win situation.
2. Data Sources and Research Region
1) The Time Period of Data
The article sets its investigation period from 2003-2014, because the availabil-ity of the China’s out-ward FDI data to other individual economy only starts in “Statistical Bulletin of China’s Outward FDI 2004” andwe do think the series of 11 years in length is enough to display dynamic trends.
2) Data Sources
The total Outward FDI and Inward FDI data of all the economies are quoted from UNCTAD database. The mutual national investment data between China and OBOR Economies are collected from “Statistical Bulletin of China’s Out-ward FDI” over the years. Meanwhile, the data of FDI of China is from the “China Statistical Yearbook” over the years. National GDP and the GDP growth rate are from the World Bank Data.
3) Research Region
The OBOR involves wide regions where in fact is no obvious boundary of geographical areas. For simply research, besides China, this paper uses the geo-graphic definition of OBOR of Zou Jialing (2015) [24], categorizing the coun-tries along the OBOR into six regions, including 8 Economies in South Asia, 19 economies in Central and Eastern Europe, 11 economies in Southeast Asia, 5 economies in Central Asia, Russia and Mongolia, 19 economies in West Asia and Mid-East (Table 1).
3. Overview of OFDI and INFDI between China and OBOR
Economies
1) Dynamic Analysis of OBOR economies’ OFDI into China
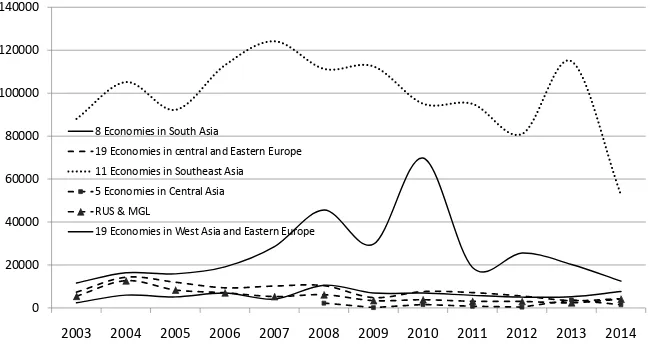
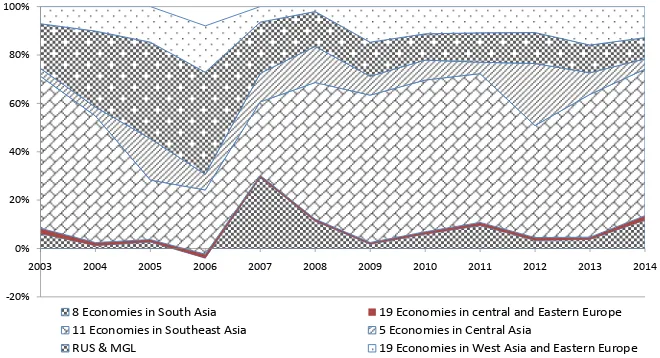
Based on the statistical data of OBOR economies’ OFDI into China in 2003 to 2014 (Figure 1), it was observed that 11 economies in Southeast Asia have made an investment far higher than other regions. 19 economies in West Asia and Mid-East have invested slightly higher in China compared to 8 Economies in South Asia, Russia and Mongolia. 19 economies in Central and Eastern Europe and 5 economies in Central Asia also went through a downfall from period 2003-2008 to 2009-2014 with the turning-down mark of world financial crisis starting 2007. In terms of proportions (Figure 2) calculated in Excel 2011 soft-ware, 11 economies in Southeast Asia occupy 60% to 70%, which could be con-sidered as the main source OFDI within OBOR Sub-region to China. Then, 19 economies in West Asia and Mid-East were the second important regions which have provided 10% - 25% direct investment in China.
In brief, 11 economies in Southeast Asia are among the dominant investors to China. 19 Economies in West Asia and Eastern Europe rank second in terms of investing in China, while the other districts have invested less in China
Figure 1. OFDI Flow of OBOR Economies to China (2003-2014). Data Source: Statistical Bulletin of China’s Outward FDI. Unit: Ten thousand USD.
Figure 2. The Proportion of OFDI Flow of OBOR Economies to China (2003-2014). Data Source: Calculated based on the original data from “Statistical Bulletin of China’s Out-ward FDI”.
comparatively. It is worth mentioning that OBOR economies’ OFDI flow to China has gone down in recent years.
The statistics above largely imply that CAFTA consisting of China and ASEAN functions efficiently and geographical relation matters significantly. 19 Economies in West Asia and the Middle-East have been becoming active INFDI sources for China. It can be deduced that China would have some notable com-plimentary advantages, in industrial strength, production factors, market con-sumption and so on, as compared with Southeast Asia and West Asia and Mid-East as well. Furthermore, China is conducting an industrial structural ad-justment and upgrading, which will lead to transient structural dis-adaptability, partially causing the slowing down of FDI from OBOR regions. However, with the completion of adjustment and upgrading, OBOR economies will enjoy more significant complimentary advantages with China.
0 20000 40000 60000 80000 100000 120000 140000
2003 2004 2005 2006 2007 2008 2009 2010 2011 2012 2013 2014 8 Economies in South Asia
19 Economies in central and Eastern Europe 11 Economies in Southeast Asia 5 Economies in Central Asia RUS & MGL
19 Economies in West Asia and Eastern Europe
0% 10% 20% 30% 40% 50% 60% 70% 80% 90% 100%
2003 2004 2005 2006 2007 2008 2009 2010 2011 2012 2013 2014
8 Economies in South Asia 19 Economies in central and Eastern Europe 11 Economies in Southeast Asia 5 Economies in Central Asia
RUS & MGL 19 Economies in West Asia and Eastern Europe
[image:4.595.211.538.291.471.2]Table 1. The Economies along OBOR.
Districts Main Economies
RUS & MGL Russia, Mongolia
5 Economies in
Central Asia Kazakhstan, Kyrgyzstan, Tajikistan, Uzbekistan, Turkmenistan 19 Economies in central
and Eastern Europe
Poland, Czech, Slovakia, Hungary, Slovenia, Croatia, Bulgaria, Serbia, Montenegro, Macedonia, Bosnia and Herzegovina, Albania,
Estonia, Lithuania, Latvia, Ukraine, Belarus, Moldova
19 Economies in West Asia and Mid-East
Turkey, Iran, Syria, Iraq, the United Arab Emirates, Saudi Arabia, Bahrain, Qatar, Kuwait, Lebanon, Oman, Yemen, Jordan,
Israel, Palestine, Azerbaijan, Georgia, AMI Leah, Egypt
8 Economies in South Asia India, Pakistan, Bangladesh, Afghanistan, Nepal, Bhutan, Sri Lanka, Maldives
11 Economies in
Southeast Asia Vietnam, Laos, Kampuchea, Thailand, Malaysia, Singapore, Indonesia, Brunei, Philippines, Burma, East Timor
2) Dynamic Analysis on China’s Direct Investment in OBOR Economies Based on the calculation in Excel 2011 software (the same in following calcu-lations), the 11 economies in Southeast Asia attracted 40% to 50% of FDI stocks from China with the fastest growth, while China’s direct investment went up slowly in other regions but increased yearly, which all accounts for 10% to 15% with 19 economies in Central and Eastern Europe excluded (Figure 3, Figure 4). It was easily observed that 11 economies in Southeast Asia obtain much higher flows of direct investment from China than other Countries (Figure 5, Figure 6). China accounts for 50% - 60% of total FDI in this region since the international financial crisis happened in 2008. Besides, China also provided 10% to 15% di-rect investment in all other four regions except 19 economies in Central and Eastern Europe.
Broadly speaking, the general trend of China’s OFDI flow to OBOR has prov-en to be an upward trprov-end. And Southeast Asia has emerged as the dominant taking-in area for China’s OFDI. While other districts, such as the 8 Economies in South Asia and 19 Economies in West Asia and Middle-East, were becoming hot investment destination for China. At large, economies along OBOR also provide an opportunity for China’s direct investment, based on notable compli-mentary advantages along OBOR. And the CAFTA is well operational for Si-no-ASEAN cooperation economically. The statistics shows that 8 economies in South Asia and 19 Economies in West Asia and Mid-East have been becoming favourable OFDI destination for China.
3) Static Analysis on FDI between OBOR economies and China
In 2014, the flows and stocks of China’s investment reached in 12.91 billion USD and 89.79 billion USD respectively. In terms of the flows (Table 2), 11 economies in Southeast Asia takes the largest share at 60.53%, followed by 19 economies in West Asia and Mid-East and 8 Economies in South Asia with share of 12.83% and 11.73% respectively. The 19 economies in Central and East-ern Europe only obtain the smallest percentage of 1.85%.
Figure 3. Outward-FDI Stock of China to Economies along OBOR (2003-2014). Data Source: Statistical Bulletin of China’s Outward FDI. Unit: Ten thousand USD.
Figure 4. China’s OFDI Stock Proportion Taken by OBOR Economies (2003-2014). Data Source: Calculated based on the original data from “Statistical Bulletin of China’s Out-ward FDI” and UNCTAD.
Table 2. The Mutual Direct Investment between OBOR Economies and China (2014).
Districts China’s OFDI to and INFDI from OBOR China OFDI-Flow
to OBOR China OFDI-Stock to OBOR OBOR OFDI-Stock to China 8 Economies in South Asia 11.73% 9.27% 9.22% 19 Economies in central and
Eastern Europe 1.85% 1.88% 5.20%
11 Economies in Southeast Asia 60.53% 53.07% 63.67% 5 Economies in Central Asia 4.26% 11.24% 1.78%
RUS & MGL 8.80% 13.87% 4.97%
19 Economies in West Asia
and Mid-East 12.83% 10.67% 15.15%
Data Source: Calculated based on the original data from “Statistical Bulletin of China’s Outward FDI” and UNCTAD.
0 1000000 2000000 3000000 4000000 5000000 6000000
2003 2004 2005 2006 2007 2008 2009 2010 2011 2012 2013 2014 8 Economies in South Asia
19 Economies in central and Eastern Europe 11 Economies in Southeast Asia
5 Economies in Central Asia RUS & MGL
19 Economies in West Asia and Mid-East
0% 10% 20% 30% 40% 50% 60% 70% 80% 90% 100%
2003 2004 2005 2006 2007 2008 2009 2010 2011 2012 2013 2014
8 Economies in South Asia 19 Economies in central and Eastern Europe 11 Economies in Southeast Asia 5 Economies in Central Asia
RUS & MGL 19 Economies in West Asia and Mid-East
[image:6.595.210.538.292.470.2] [image:6.595.209.540.543.696.2]Figure 5. OFDI Flow of China to OBOR Economies (2003-2014). Data Source: Statistical Bulletin of China’s Outward FDI. Unit: Ten thousand USD.
Figure 6. China’s OFDI Flow Proportion Taken by OBOR Districts (2003-2014) Data Source: Calculated based on the original data from “Statistical Bulletin of China’s Out-ward FDI” and UNCTAD. Unit: Ten thousand USD.
In terms of stocks (Table 2), the 11 economies in Southeast Asia occupy 53.07%, followed by Russia and Mongolia, 5 economies in Central Asia, 19 economies in West Asia and Mid-East with accounting for 13.87%, 11.24% and 10.67%. While 19 economies in Central and Eastern Europe takes up only 1.88%. Regarding FDI from the OBOR into China, the FDI invested to China from 11 economies in Southeast Asia takes up 63.67%, followed by 19 economies in West Asia and the Middle-East Block with accounting for 15.15%. The 8 Economies in South Asia’s investment constitute 9.22%, while 5 economies in Central Asia only take a small share of 1.78%.
4. Analysis on FDI Dependence between OBOR Economies
and China
1) Methods for Investment Dependence -100000
0 100000 200000 300000 400000 500000 600000 700000 800000 900000
2003 2004 2005 2006 2007 2008 2009 2010 2011 2012 2013 2014
8 Economies in South Asia
19 Economies in central and Eastern Europe 11 Economies in Southeast Asia
5 Economies in Central Asia RUS & MGL
19 Economies in West Asia and Eastern Europe
-20% 0% 20% 40% 60% 80% 100%
2003 2004 2005 2006 2007 2008 2009 2010 2011 2012 2013 2014
8 Economies in South Asia 19 Economies in central and Eastern Europe 11 Economies in Southeast Asia 5 Economies in Central Asia
RUS & MGL 19 Economies in West Asia and Eastern Europe
[image:7.595.208.538.293.472.2]The Measure method of Absolute Investment Dependence
We adapt FDI share index to measure the absolute dependence of direct in-vestment among OBOR Economies (China included). FDI share index can comprehensively reflect the influence of OFDI and INFDI, and computation equation is as follows:
(
ij ji ij ji)
100%ij
i j i j
x x D x x ϕ ϕ ϕ ϕ + + + × =
+ + + (1)
In the Formula (1),
ij
x refers to the total outward direct investment (OFDI) of country i to coun-try j
ji
x refers to the total OFDI of country j to country i
ij
ϕ refers to the total inward direct investment (INFDI)accepted by country i from country j
ji
ϕ refers to the total INFDI accepted by country j from country i And herein hence xij=ϕji, xji=ϕij.
i
x and xj refer to the total OFDI of country i and country j respectively
i
ϕ and ϕj refer to the total INFDI accepted by country i and country j re-spectively
ij
D values between [0 - 1.0], and 1.0 indicates the maximum investment de-pendence between the two countries i and j countries while 0 means minimum dependence.
The Measure method of Relative Investment Dependence
In fact, some scholars (Brown, 1949; Kojima, 1964; Drysdale and Garnaut, 1982; etc.) have created the concept of international trade dependence and fig-ured out the computational formula. We apply their formula to calculate relative investment dependence between the two countries. The equation is as follows:
2 2
RD ij ji ij ji w w ij
i j i j i j i j
x x x
x x x x
ϕ ϕ ϕ
ϕ ϕ ϕ ϕ
+ + + +
= ×
+ + + + + + (2)
In the equation, xw and ϕw are the world OUTFDI total amount and total INFDI.
HM Index Method
We use the HM Index (Hubness Measurement Index) constructed by Baldwin (2003) to measure the investment dependence between the routes of the OBOR and China. The Index calculation equation is as follows:
1 ij ij j j i x HM x ϕ ϕ = × −
(3) In the equation:
ij
x refers to the total direct investment from country i into country j
i
x refers to the total FDI of country i
ij
ϕ refers to the total direct investment accepted by country i from country j in the routes
j
ϕ refers to the total FDI of country j in the routes
Here, HM measures the level of country i’s investment dependence on coun-try j. HM takes range of values between 0 and 1. It denotes that the bigger HM is, the higher the level of country i’s investment dependence on country j is and vice versa.
2) Absolute Investment Dependence of FDI between OBOR Economies and China
Based on the Equation (1), we can calculate the absolute investment depen-dence of FDI between China and OBOR Economies (Table A1). Calculated re-sults indicate a general upward trend and an increasing absolute investment de-pendence, especially the highest level existing between China and 11 economies in Southeast Asia, followed by similar level between 8 Economies in South Asia, 19 economies in West Asia and Mid-East, and Russia and Mongolia. China and 5 economies in Central Asia have the lowest level of absolute investment depen-dence of FDI (Figure 7).
Broadly speaking, FDI interdependence between OBOR and China seems to be deepening. The majority of districts along OBOR are clearly interdependent with China. Particularly, FDI interdependence between Southeast Asia and Chi-na proves even more remarkable. Figure 7 shows that 2003-2014 witnessed a fluctuation of the FDI interdependence between OBOR and China, inconspi-cuously or intensely. The implications of the FDI interdependence between OBOR and China are obvious that OBOR regions is under economic integration process, and the economic connectivity between OBOR economies and China, has proven to be more and more robust. There have been some instances of dis-cordances existing between OBOR economies and China, which have exerted negative impacts on international economic cooperation in OBOR regions in the short run.
3) Relative FDI Dependence of China and OBOR Economies
Figure 7. Absolute FDI Dependence of China and OBOR Economies. Data resource: Calculated according to the original data from “Statistical Bulletin of China’s Outward FDI” and UNCTAD.
-0.01 0 0.01 0.02 0.03 0.04 0.05
2003 2004 2005 2006 2007 2008 2009 2010 2011 2012 2013 2014
8 Economies in South Asia
19 Economies in central and Eastern Europe 11 Economies in Southeast Asia 5 Economies in Central Asia RUS & MGL
19 Economies in West Asia and Mid-East
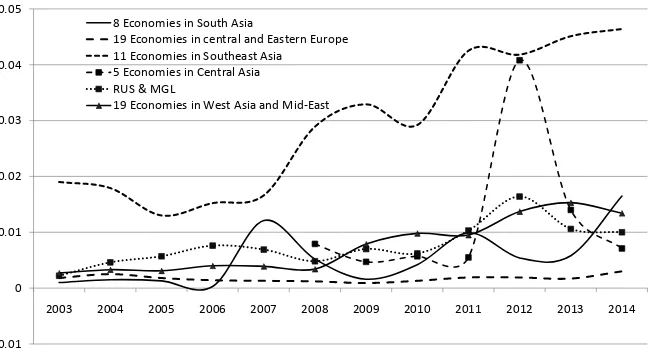
[image:9.595.213.539.504.680.2]Based on the Equation (2), we can calculate the relative investment dependence of FDI between China and OBOR Economies shown in Table A2. In terms of long-term trend, calculated results indicate a general upward trend with fluc-tuating in relative investment dependence level, especially the highest one ex-isted between China and 11 economies in Southeast Asia. There are similar le-vels of relative investment dependence between China and other Countries along the Routes, 5 economies in Central Asia (Figure 8).
4) China’s FDI Dependence on OBOR Economies
After analyzing the relative investment dependence of FDI between China and OBOR Economies, in order to understand precisely the level of dependence, we used HM index to calculate the one-way dependence of China on the countries or the countries on China shown in Table A3.
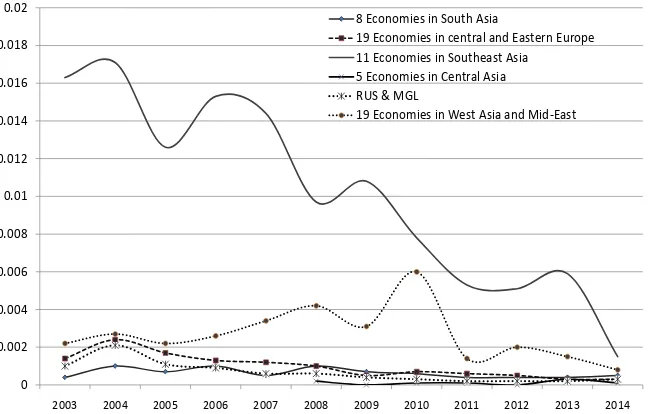
According to the Equation (3), we can calculate the levels of China’s FDI de-pendence on OBOR Economies. As shown in Figure 9, China has the highest level of FDI dependence on the 11 economies in Southeast Asia, then on the 19 economies in West Asia and Mid-East, with comparatively low level on the other regions. The trend of China’s FDI dependence on OBOR Economies has plunged from 2003 to 2014.
[image:10.595.212.538.506.677.2]To sum up, China’s FDI Dependence on OBOR shows that the trend of Chi-na’s FDI dependence on the districts along OBOR is downward. China notably depends on Southeast Asia in FDI. This shows that China has got far-reaching development economically, and the INFDI policies were under adjustment from merely accepting to screening INFDI to meet the renewed economical and in-dustrial structure requirement. With significant economic enhancement, China’s optimizing investment climate and rising market opportunities attract mul-ti-FDI-sources to China. And China’s economical and industrial adjustment and upgrading caused short-run partially non-adaptive effect on OFDI of OBOR to China.
Figure 8. Trend of Relative FDI Dependence between China and OBOR Economies. Data resource: Calculated according to the original data from “Statistical Bulletin of China’s Outward FDI” and UNCTAD.
-0.20
0.00 0.20 0.40 0.60 0.80 1.00
2003 2004 2005 2006 2007 2008 2009 2010 2011 2012 2013 2014 8 Economies in South Asia
19 Economies in central and Eastern Europe 11 Economies in Southeast Asia
5 Economies in Central Asia RUS & MGL
19 Economies in West Asia and Mid-East
Figure 9. Trend of China’s FDI Dependence on OBOR Economies. Data resource: Cal-culated according to the original data from “Statistical Bulletin of China’s Outward FDI” and UNCTAD.
5) OBOR FDI Dependence on China
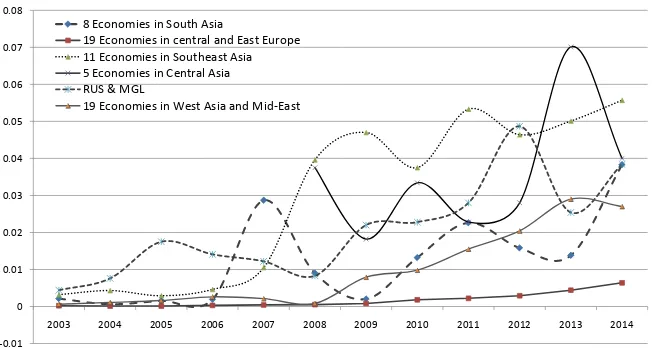
According to the Equation (3), we can calculate the levels of OBOR countries’ FDI dependence on China (Table A4). From 2003 to 2014, the FDI dependence of the countries on China has presented the obvious trend of rising since the global financial crisis of 2008. As shown in Figure 10, except the 19 economies in Central and Eastern Europe, the five regions had had high investment depen-dence level on China, especially the 11 economies in Southeast Asia have reached the highest level of FDI dependence on China. During the period, 8 Economies in South Asia, 19 economies in Central and Eastern Europe, Russia and Mongolia and 19 economies in West Asia and Mid-East have had similar level of FDI on China.
The OBOR FDI Dependence on China demonstrates that OBOR FDI depen-dence on China shows a rising trend. Majority of districts in OBOR are appar-ently dependent on China. Particularly, Southeast Asia notably depends on Chi-na. Hence, as a rising economy, China has been becoming more and more im-portant direct investment source, or OBOR economies have been being hotter and hotter DI (direct investment) destination. And OBOR economies need DI from China to promote their home economy.
5. Conclusion and Discussion
1) Obvious Growing Trend of Direct Investment of OBOR Regions with China
From above analyses, it is easy to sum up that the mutual direct investment between OBOR economies and China evidently grows up, which manifests OBOR promoting economic cooperation and evident complimentary advantage.
0 0.002 0.004 0.006 0.008 0.01 0.012 0.014 0.016 0.018 0.02
2003 2004 2005 2006 2007 2008 2009 2010 2011 2012 2013 2014
8 Economies in South Asia
19 Economies in central and Eastern Europe 11 Economies in Southeast Asia 5 Economies in Central Asia RUS & MGL
19 Economies in West Asia and Mid-East
Figure 10. Trend of OBOR Economies’ FDI Dependence on China from 2003-2014. Data resource: Calculated according to the original data from “Statistical Bulletin of China’s Outward FDI” and UNCTAD.
From the data of 2003-2014, increasing direct investment of the OBOR regions with China shows that the international economic cooperation has been gradu-ally deepening and bilateral economic cooperation has been continugradu-ally streng-thening. Specifically, direct investment of OBOR regions with China also sug-gests that these countries have complementary advantages in the industry and in the consumer market, especially larger mutual direct investment scale and quick investment growth of China with 11 countries of the Southeast Asia and 19 countries of the western Asia and the Middle East, which are the main destina-tions of direct investment, with complementary advantages between regional and national, industry and market. The cooperation between China with ASEAN based on CAFTA “10 + 1” is an efficient platform for promoting the comple-mentary advantages and international investment cooperation and providing a good demonstration effect for the OBOR. And analyses result still shows OBOR collaborative mechanism needs to be desired to enhance regional DI.
2) The Enhancing Investment Interdependence Level of China and OBOR Economies
Although investment dependence has regional imbalance, from the data of 2003-2014, the investment interdependence level of China and gradually in-creased. To be specific, China and 11 economies in Southeast Asia has the high-est direct invhigh-estment dependence on each other, while it has the lowhigh-est with 19 economies in Central and Eastern European. In overall, the trend of one-way investment dependence of the OBOR Economies to China is obviously rising, other regions’ investment dependence on China is more apparent, except for the 19 economies in Central and Eastern Europe.
From the tendency of 2003-2014, China’s one-way investment dependence on OBOR is weakening. This is because of the reform and opening-up policy of China for nearly 30 years, which has comprehensive benefits of economic scale, economic structure, industrial structure, the domestic market and the policy itself,
-0.01 0 0.01 0.02 0.03 0.04 0.05 0.06 0.07 0.08
2003 2004 2005 2006 2007 2008 2009 2010 2011 2012 2013 2014 8 Economies in South Asia
19 Economies in central and East Europe 11 Economies in Southeast Asia 5 Economies in Central Asia RUS & MGL
19 Economies in West Asia and Mid-East
diversifying the sources of external direct investment and reducing INFDI’s de-pendence on a particular area. For 30 years, through a reform and opening poli-cy, China has demonstrated a high FDI and FDI flows and scale, sharing the in-ternational investment cooperation and experience with countries along the OBOR.
In short, the FDI interdependence between OBOR economies and China is continuously strengthening. The mutual economic interdependence and mutual beneficial opportunity among the economies along OBOR have provided the objective and subjective foundation for OBOR promotion as well in their exis-tence already.
Generally, summing-up, based on the above analysis, China and the countries along the OBOR have the foundation of the international investment coopera-tion. According to OBOR Initiative framework, countries in OBOR regions will benefit from the agreeable win-win and sharing cooperation in the aspects of industry cooperation, market cooperation, and financial cooperation and so on. The OBOR regional investment cooperation will optimize and promote the na-tions’ economic and industrial structure, and hence the people living-hood will be bettered off, and eventually lead to OBOR common prosperity with peaceful development and hence the regional peace would be warranted.
However, the coverage of Belt & Road is changing with more and more economies participation into the OBOR Initiative and FDI pattern studied in the article would change. And importantly, with deepening and promotion of BRI, the FDI pattern of China and the economies along Belt & Road will be optimized to the great extent, which needs further systematic researches on. The paper only provides a current scenario of the FDI pattern that manifests the subjective and objective foundation for BRI.
Funding
Supported by the National Social Science Fund Project (14XJL007) of China.
Conflicts of Interest
The authors declare no conflicts of interest regarding the publication of this paper.
References
[1] Wang, Y.Z. and Li, X.C. (2015) China’s Evaluation of Investment Risks in Countries along “One Belt, One Road”. China Opening Journal, No. 4, 30-34.
[2] Huang, H. and Nikita, S. (2016) Political Risks and Controls of Oversea Investment by Chinese Enterprises: Based on the Countries along “One Belt One Road”. Journal of Shenzhen University (Humanities & Social Sciences), No. 1, 93-100.
[3] Li, X.M. and Li, C.M. (2016) The Institutional Risks of the Countries along “the Belt and Road” and the Economic Logic of the “Going-Out” Strategy of Chinese Enter-prises. Contemporary Economic Management, No. 3, 8-14.
[4] Zhou, W.Q. (2015) The Direct Investment Distribution along the “One Belt and One Road” and Its Challenges. Reform, No. 8, 39-47.
[5] Nie, N. (2016) China’s Risks in Overseas Investment and the Preventions in Partic-ipating in the “One Belt and One Road” Project. Contemporary Economic Man-agement, No. 9, 86-90.
[6] Zhao, Z. (2015) A Study on Extraterritorial Direct Investment under One Belt and One Road Strategy—Based on Characterization and Analysis of International Law.
Journal of Huaqiao University (Philosophy & Social Sciences), No. 6, 94-104. [7] Cui, N., Liu, C. and Hu, C.T. (2017) The Efficiency of China’s Outward FDI,
In-vestment Risk and the Host Country Institution—An Empirical Analysis Based on “One Belt One Road” Countries. Journal of Shanxi University of Finance and Eco-nomics, No. 4, 27-38.
[8] Hu, W. and Sun, H.K. (2016) An Analysis of Risk and Countermeasures of Chinese Enterprises Outward FDI under “One Belt and One Road”. Journal of Hubei Uni-versity of Economics (Humanities and Social Sciences), No. 3, 56-58.
[9] Wang, P.Z., Pan, X.Y. and Zhang, S.Y. (2018) Institutional Factors, Bilateral In-vestment Treaties and China’s OFDI Location Selection—Based on the Panel Data of Countries along “The Belt and Road”. Review of Economy and Management, No. 1, 5-17.
[10] Sun, Q.K. (2017) A Study on Location Choice among the Belt and Road Countries of OFDI from China. University of International Business and Economic, Beijing. [11] Peng, J.Z., Liu, Y. and Fan, Y.J. (2017) The Deterministic Analysis of the Location
Choice along the Belt and Road of OFDI from China. Jiangxi Social Sciences, No. 4, 43-51.
[12] Yang, L.J. (2017) The Location Choice along the Belt and Road of OFDI from Chi-na—Empirical Analysis Based on the Gravity Model. Social Sciences in Xinjiang, No. 3, 38-46.
[13] Liu, X.F., Ge, Y.J. and Zhao, Y.B. (2017) National Distance and Chinese Companies’ Choice of Location along the Belt and Road. Economic Geography, No. 11, 99-108. [14] Sun, P.J. and Yu, P. (2016) The Impact of Cultural Distance on Chinese Enterprises
in Implementing the Belt and Road Initiative. China Business and Market, No. 2, 83-90.
[15] Li, Q.C. and Xu, W.C. (2017) The Location Choice among the Belt and Road Area of OFDI from China—Based on the Perspective of Spatial Effect. Macroeconomics, No. 8, 3-18, 102.
[16] Li, K. (2016) Research on Industry Selection of China’s Direct Investment in One Belt and One Road Countries. Hubei University, Wuhan.
[17] Wu, L. and Li, L. (2015) The Industry Choice of FDI on ASEAN from Fujian under “One Belt and One Road” Strategy—Based on Competitiveness and Complemen-tarity of Trade. Fujian Tribune, No. 12, 186-191.
[18] Zhou, G., Zhou, J. and Ji, K. (2017) The Industry Choice of OFDI from China under “One Belt and One Road” Strategy. Enterprise Economy, No. 9, 72-79.
[19] Li, Q. and Xu, W. (2017) The Industry Choice along the Belt and Road of OFDI from China. Journal of Dalian Maritime University (Social Science Edition), No. 4, 72-79.
[20] Ding, Z. and Sun, G. (2016) The Spatial Pattern Reconstruction of OFDI from Chi-na under “One Belt and One Road” Strategy. Journal of Sichuan Normal University
(Social Sciences Edition), No. 2, 54-61.
[21] Jin, F. (2016) The Belt and Road Initiatives and a New Pattern of China’s Foreign Direct Investment. Journal of International Relations, No. 2, 68-80, 154.
[22] Dong, Q. (2016) “Belt and Road Initiative” Strategy and China OFDI Pattern Re-construction. Journal of Hebei GEO University, No. 5, 88-96.
[23] Zheng, L. and Liu, Z. (2015) Spatial Pattern of Chinese outward Direct Investment in the Belt and Road Initiative Area. Progress in Geography, No. 5, 563-570. [24] Zou, J., Liu, C., et al. (2015) Spatial Patterns and Economic Effects of China’s Trade
with Countries along the Belt and Road. Progress in Geography, No. 5, 598-605.
Appendix
Table A1. Absolute FDI Dependence of OBOR Economies and China.
Year 8 countries of southern Asia
19 economies in Central and Eastern
Europe
11 economies in Southeast
Asia
5 economies in
Central Asia Russia and Mongolia
19 economies in West Asia and
Mid-East
2003 0.0010 0.0018 0.0190 0.0022 0.0027
2004 0.0015 0.0025 0.0179 0.0046 0.0033
2005 0.0013 0.0018 0.0130 0.0057 0.0031
2006 0.0003 0.0014 0.0152 0.0076 0.0040
2007 0.0121 0.0013 0.0166 0.0069 0.0039
2008 0.0052 0.0012 0.0289 0.0079 0.0048 0.0034 2009 0.0016 0.0009 0.0329 0.0047 0.0070 0.0079 2010 0.0042 0.0013 0.0292 0.0057 0.0062 0.0098 2011 0.0099 0.0019 0.0425 0.0055 0.0103 0.0095 2012 0.0054 0.0019 0.0418 0.0408 0.0164 0.0137 2013 0.0058 0.0017 0.0451 0.0140 0.0106 0.0153 2014 0.0165 0.0030 0.0464 0.0071 0.0100 0.0134 Data resource: Calculated according to the original data.
Table A2. Relative Investment Dependence of FDI between China and OBOR Economies.
Year 8 countries of southern Asia in Central and 19 economies Eastern Europe
11 economies in Southeast
Asia
5 economies in Central
Asia
Russia and Mongolia
19 economies in West Asia and
Mid-East
2003 0.0289 0.0444 0.3909 0.0567 0.0600
2004 0.0535 0.0683 0.4059 0.1377 0.0841
2005 0.0458 0.0461 0.2779 0.1677 0.0674
2006 0.0119 0.0460 0.4317 0.2623 0.1040
2007 0.6051 0.0527 0.5052 0.2651 0.1254
2008 0.1456 0.0306 0.7443 0.2929 0.1079 0.0693
2009 0.0415 0.0251 0.6459 0.1468 0.1708 0.1487
2010 0.1005 0.0301 0.4429 0.1506 0.1326 0.1778
2011 0.3161 0.0587 0.8237 0.2041 0.2754 0.2302
2012 0.1650 0.0502 0.7142 0.9000 0.4406 0.3168
2013 0.1764 0.0545 0.6605 0.4749 0.2149 0.2973
2014 0.4465 0.0841 0.6700 0.2341 0.2216 0.2605
Data resource: Calculated according to the original data.
[image:16.595.209.541.432.709.2]Table A3. China’s FDI Dependence on OBOR Economies.
Year 8 countries of southern Asia 19 economies in Central and Eastern Europe
11 economies in Southeast
Asia
5 economies in Central
Asia
Russia and Mongolia
19 economies in West Asia and
Mid-East
2003 0.0004 0.0014 0.0163 0.0010 0.0022
2004 0.0010 0.0024 0.0171 0.0021 0.0027
2005 0.0007 0.0017 0.0126 0.0011 0.0022
2006 0.0010 0.0013 0.0153 0.0009 0.0026
2007 0.0005 0.0012 0.0144 0.0006 0.0034
2008 0.0010 0.0010 0.0097 0.0002 0.0006 0.0042 2009 0.0007 0.0005 0.0108 0.0000 0.0004 0.0031 2010 0.0006 0.0007 0.0078 0.0001 0.0003 0.0060 2011 0.0004 0.0006 0.0053 0.0001 0.0002 0.0014 2012 0.0004 0.0005 0.0051 0.1919 0.0002 0.0020 2013 0.0004 0.0003 0.0059 0.0003 0.0002 0.0015 2014 0.0005 0.0003 0.0015 0.0001 0.0003 0.0008 Data resource: Calculated according to the original data.
Table A4. OBOR Economies’ FDI Dependence on China (Base on the World).
Year 8 countries of southern Asia 19 economies in Central and Eastern Europe
11 economies in Southeast
Asia
5 economies in Central
Asia
Russia and Mongolia
19 economies in West Asia and
Mid-East
2003 0.0021 0.0002 0.0032 0.0044 0.0006
2004 0.0006 0.0001 0.0043 0.0076 0.0011
2005 0.0015 0.0001 0.0029 0.0175 0.0016
2006 0.0019 0.0003 0.0046 0.0141 0.0026
2007 0.0287 0.0004 0.0105 0.0122 0.0021
2008 0.0090 0.0005 0.0396 0.0375 0.0083 0.0008 2009 0.0020 0.0008 0.0470 0.0182 0.0220 0.0079 2010 0.0132 0.0018 0.0375 0.0334 0.0228 0.0098 2011 0.0226 0.0022 0.0533 0.0228 0.0280 0.0155 2012 0.0158 0.0029 0.0464 0.1919 0.0487 0.0204 2013 0.0138 0.0044 0.0501 0.0701 0.0254 0.0290 2014 0.0383 0.0064 0.0557 0.0400 0.0384 0.0270 Data resource: Calculated according to the original data.
[image:17.595.207.539.374.614.2]