^ in Gnat Britain © The Company ofBiobgisti Limited 1983
EYE MOVEMENT DYNAMICS IN THE DOGFISH
B Y J . C. MONTGOMERY
Leigh Marine Laboratory, and Department of Zoology, University of Auckland, Auckland, New Zealand
{Received 19 October 1982-Accepted 18 February 1983)
SUMMARY
A method is described of obtaining the relationship between electrical stimulation of the abducens nerve and horizontal eye movement in the dogfish. The stump of the Vlth nerve was stimulated intracranially in a fish in which the brain had been removed, but in which the circulation remained intact, and the gills were perfused with sea water. Horizontal rotation of the eye was monitored with an opto-electronic movement detector. Eye rotation was linearly related to stimulus frequency in the 0-20 Hz range, and was maximal at frequencies above 40 Hz. Stimulation of the Vlth nerve, with a pulse train whose frequency was modulated sinusoidally between 0 and 20 Hz, produced sinusoidal eye movements. The frequency response of the system approximates a first order low pass filter with a characteristic frequency of 0-23 Hz, and an additional phase lag equivalent to a time delay of approximately 50 ms.
INTRODUCTION
The control of eye movement is one of the most studied, and beat understood, vertebrate motor control systems. The system is amenable to study for several reasons: for example, the functions of eye movements are known, detailed mechanical analysis can be made, and eye movements can be induced through several reflex pathways.
Eye movement mechanics have been extensively studied in mammals (e.g. Collins, 1977) in which despite the complexity of the movements, a single first order model provides a satisfactory description of the system for most purposes (Carpenter, 1977; Robinson, 1981). The parameters of the model can be obtained from a knowledge of the eye mechanics (Robinson, 1965), the relationship between motoneurone firing and eye movement (Robinson, 1981) or the movement responses to nerve stimulation (Zuber, 1968a). The last of these methods is perhaps the easiest to carry out and provides a characteristic frequency (2-5 Hz) which is in good agreement with Robin-son's mechanical model (Carpenter, 1977). Eye movement responses to nerve stimu-lation are probably dominated by the faster motor units, and represent an overestimate of the characteristic frequency of the transfer function relating eye movement to motoneuronal firing. The characteristic frequency obtained from the behaviour of an average motoneurone is around 0 7 Hz (Robinson, 1981). The practice of representing
298 J. C. MONTGOMERY
a complex physiological system as a single first order model must be treated winP caution, but for the case of the oculomotor system this approach is justified in that it provides a simple description which is commensurate with observed behaviour.
Due to the accessibility of the labyrinth the physiology of the elasmobranch ves-tibular system is well known (e.g. Lowenstein, 1974; O'Leary, Dunn & Honrubia, 1976), and indeed these studies have been fundamental to our understanding of the sensory transduction process. Aspects of the central vestibular pathways have been investigated (Montgomery & Roberts, 1979; Montgomery, 1982) and their responses to horizontal head rotation determined (Montgomery, 1980). The operation of the horizontal vestibulo-ocular reflex during swimming in dogfish has been studied by Harris (1965). Two components of the direct horizontal vestibulo-ocular pathway thus remain to be characterized: the transfer characteristics from vestibular to oculomotor neurones, and the transfer characteristics of the oculomotor system itself. This study provides a characterization of the oculomotor system.
MATERIALS AND METHODS
Experiments were performed on the carpet shark Cephaloscyllium Isabella caught in trawl nets, or on long-lines, and kept in seawater circulation at the Leigh Marine Laboratory. In fish anaesthetized with Tricaine (by immersion in a 0-02% solution in sea water), the cranium was opened and the brain removed leaving the stumps of the cranial nerves accessible intracranially. Bleeding was controlled by cautery and fish were then placed in a tank and the gills perfused with sea water at the ambient temperature of 14 °C. The stump of the abducens nerve (cranial nerve VI) was secured in a suction electrode, and the cranial cavity filled with elasmobranch Ringer.
Electrical stimuli were trains of supramaximal square wave pulses (0-5 ms, 1-5-2 V). Pulse trains were delivered at a constant frequency in the range 0-50 Hz, or sinusoidally modulated between 0-20 Hz at modulation frequencies in the range 0-01-1 Hz (Fig. 1).
Eye movements produced by electrical stimulation of the Vlth nerve were recorded by an opto-electronic movement detector (Helversen & Eisner, 1977). A small patch (4 mm2) of 'Scotchlite' brand reflective sheeting was fixed to the eye by cyano-acrylate glue. The reflective patch was illuminated through a semireflective mirror (Fig. 1). The patch reflected light back along the incident path, through the semireflective mirror and onto a photodetector (PIN-SC, United Detextor Technology, Santa Monica, Cal. U.S.A.) built into the film plane of a camera. The voltage output of the photodetector was directly related to the position of the eye patch, and was calibrated at the conclusion of each experiment. The linear movement of the patch was conver-ted into an angular measure by simple trigonometry on the assumption that the eye rotated about its centre. Eye movements were monitored on a storage oscilloscope and chart recorder.
RESULTS
Eye movement dynamics in the dogfish
JO°
Fig. 1. The carpet shark preparation. (A) Sinusoidally modulated, or constant frequency, pulse trains are applied to the Vlth nerve via a suction electrode. (B) Sea water is passed over the gills of a fish in which the brain has been removed. A retro-reflective patch is attached to the eye. (C) and illuminated (D) via a half silvered mirror (arrows represent the light path). Eye rotation is monitored by an opto-electronic movement detector mounted in the film plane of the camera (E). (F) Example of eye movement record.
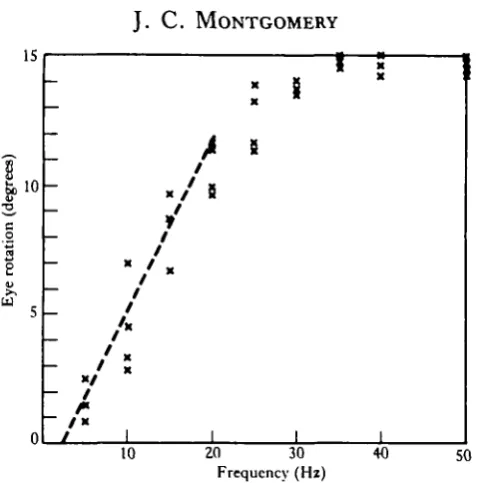
The frequency response curve for the preparation (Fig. 2) was determined by presenting a 10 s pulse train at each frequency. This length of pulse train was suf-ficient to obtain a plateau response at all frequencies; at 20 Hz the plateau was reached after 3-5 s. The relationship between eye position and stimulus frequency was approximately linear up to about 20 Hz, but saturated at frequencies above this. The maximum eye rotation of about 15° was obtained by stimulus frequencies of 35 Hz and above.
300
J. C. MONTGOMERY [image:4.451.107.346.46.288.2]Frequency (Hz)
Fig. 2. Frequency response curve. Maximum eye deviation induced by 10 s, constant frequency pulse trains in the range 0-50 Hz. The response is linear in the 0-20 Hz range and saturates at higher frequencies.
15°
0°
Time
Fig. 3. Record of eye movement response to sinusoidally modulated pulse train. Solid line is a record of eye movement in degrees, dotted line represents stimulus wave form (peak-to-peak 0—20 Hz, modulation frequency 0 0 5 H i ) . Note the phase lag of the response at this low modulation frequency.
G(f) =
Vl + (f/f
c)
2Eye movement dynamics in the dogfish
301
I o-4
o
0-2
I I I I I i I i I I l i i i i l i i
001 0-1
30
3
bo
60
90
i l l l I l i l l l M
001 0 1
[image:5.451.85.374.51.389.2]Frequency (Hz)
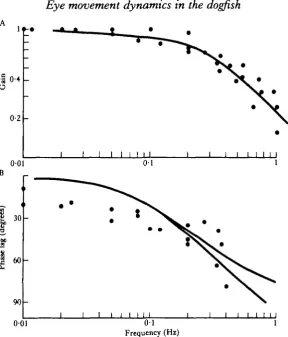
Fig. 4. Bode plots of gain and phase vs modulation frequency (see text for details). (A) Log gain vs log modulation frequency. Three fish were used, dots represent the means of 10 measurements of gain from one fish at a particular modulation frequency, the solid line represents the best fit first order model. (B) Phase lag vs log modulation frequency. The upper solid line represents the theoretical first order model, the lower line takes account of the phase contribution of the time delay. Each point represents the mean of 10 phase measurements for one fish. Note the low frequency phase lag.
D I S C U S S I O N
302 J. C. MONTGOMERY
nystagmus induced by vestibular (horizontal canal) stimulation are in the r g 10-15 °/s (unpublished observation). It is also likely that the low operating range of the oculomotor system reported here is in part due to the lower temperature at which these recordings were made. There is evidence in other preparations that a reduction in temperature produces a parallel lowering of the frequency response curve (Truong, Wall & Walker, 1964; Fisher & Florey, 1981; MacDonald & Montgomery, 1982).
Stimulation with sinusoidally modulated pulse trains provides a useful description of the oculomotor system. The relationship between gain and modulation frequency is similar to that of a first order low pass filter which can be specified by its characteris-tic frequency. It is notable that the characterischaracteris-tic frequency is nearly one order of magnitude less than that found for the cat oculomotor system (Zuber, 1968a).
The same model provides a reasonable prediction of the phase relationship between stimulus and response (at higher stimulus frequencies than those shown in Fig. 4 allowance would have to be made for the additional phase lag contributed by the time delays in the system). Systematic departure from the model is shown at low modula-tion frequencies. This is possibly due to the activamodula-tion of the slow fibres which occur in the extraocular muscle in carpet shark (unpublished observation). The slow res-ponse of this component of the muscle is equivalent to a degree of integration in the response which would introduce phase lag at low frequency.
The natural frequency of head movement in these fish is in the range 0 1 - 1 Hz. Harris (1965) shows an example of a fish swimming at 0 4 Hz with eye position in phase with head position. At this frequency maximum firing in the vestibular primary afferents would be in phase with head velocity (Montgomery, 1980), that is 90° phase advanced with respect to head position. The present study shows that at this same frequency there is considerable phase lag between motoneurone firing and eye position (Fig. 4B). For this reason the velocity signal of the contralateral canal and secondary vestibular cells will be appropriate to drive the abducens motoneurones directly; there is less requirement for an integration step in this pathway as is pos-tulated in higher vertebrates (Carpenter, 1977). The paucity of saccadic eye move-ments, and correspondingly low characteristic frequency, may enable the vestibulo-ocular reflex system in carpet shark to operate satisfactorily without substantial central processing of the sensory signal.
I wish to acknowledge grants from the Auckland University Research Committee, University Grants Committee and the Medical Research Council of New Zealand. I also wish to thank the staff of the Portobello Marine Station, especially Mr P. Meridith, for assisting in the supply of experimental animals.
R E F E R E N C E S CARPENTER, R. H. S. (1977). Movements of the Eyes. London: Pion.
COLLINS, C. C. (1977). Orbital mechanics. In The Contrvl of Eye Movements, (eds P. Bach-Y-Rita, C. C. Collins & J. Hyde), pp. 283-325. New York: Academic Press.
FISHER, L. & FLOREY, E. (1981). Temperature effects of neuromuscular transmission (opener muscle of crayfish, Astacus leptodactylus). J. exp. Biol. 94, 251-268.
Eye movement dynamics in the dogfish 303
BIN, P. & STERLING, P. (1977). Anatomy and physiology of Goldfish oculomotor system. II. Firing patterns of neurons in abducens nucleus and surrounding medulla and their relation to eye movements. J.
Neuwphysiol. 40, 573-588.
HARRIS, A. J. (1965). Eye movements of the dogfish Squalus acanlhias h.J. exp. Biol. 43, 107-130. HELVERSEN, O. N. & ELSNER, N. (1977). The stridulatory movements of acridid grasshoppers recorded with
an opto-electronic device. J. comp. Pkytiol. 122, 53-64.
HELWIG, J. T . & COUNCIL, K. A. (1979). The Statistical Analysis User's Guide. North Carolina: S.A.S. Institute.
HERMANN, H. T . (1971). Eye movement correlated units in the mesencephalic oculomotor complex of Gold-fish. Brain Res. 35, 240-244.
LOWENSTEIN, O. (1974). Comparative morphology and physiology. In Handbook of Sensory Physiology, Vol. 6, (ed. H. H. Komhuber), pp. 75-120. Berlin: Springer.
MACDONALD, J. A. & MONTGOMERY, J. C. (1982). Thermal limits of neuromuscular function in antarctic fish.
J. comp. Physiol. 147, 237-250.
MONTGOMERY, J. C. (1980). Dogfish horizontal canal system: responses of primary afferents, vestibular and cerebellar neurons to rotational stimulation. Neurosd. 5, 1761-1769.
MONTGOMERY, J. C. (1982). Functional organization of dogfish vestibulo-cerebellum. Brain Behav. Evol. 20, 118-128.
MONTGOMERY, J. C. & ROBERTS, B. L. (1979). Functional organization of the vestibular afferents to the vestibular nuclei of the dogfish. Brain Behav. Evol. 16, 81-98.
O'LEARY, D. P., DUNN, R. F. & HONRUBIA, V. (1976). Analysis of afferent responses from isolated semi-circular canal of the guitarfish using rotational acceleration white-noise inputs. I. Correlation of response dynamics with receptor innervation. J. Neuwphysiol. 39, 631-644.
ROBINSON, D. A. (1965). The mechanics of human smooth pursuit eye movement. J. Physiol., Land. 180, 569-591.
ROBINSON, D. A. (1981). The use of control system analysis in the neurophysiology of eye movements. Ann.
Rev. Neurosd. 4, 463-503.
TRUONG, X. T., WALL, B. J. & WALKER, S. M. (1964). Effects of temperature on isometric contraction of rat muscle. Am. J. Physiol. 207, 393-396.
ZUBER, B. L. (1968a). Eye movement dynamics in the cat: the final motor pathway. ExplNeurol. 20, 255-260. ZUBER, B. L. (19686). Sinusoidal eye movements from brain stem stimulation in the cat. Vision Res. 8,