Comparison of Independent Component
Analysis and Conventional Hypothesis-Driven
Analysis for Clinical Functional MR
Image Processing
Michelle A. Quigley, Victor M. Haughton, John Carew, Dietmar Cordes, Chad H. Moritz, and M. Elizabeth Meyerand
BACKGROUND AND PURPOSE: With independent component analysis (ICA), regions of activation can be identified on functional MR (fMR) images without a priori knowledge of expected hemodynamic responses. The purpose of this study was to compare the results of fMR imaging data processed with spatial ICA with results obtained with conventional hypothesis-driven analysis.
METHODS: Eleven patients with focal cerebral lesions and one with agenesis of the corpus callosum were enrolled. Each patient performed text-listening, finger-tapping, and word-generation tasks. Conventional activation maps were generated by fitting time courses of each voxel to a boxcar reference function. Maps were created from the same image data with ICA techniques. To compare the maps, a concurrence ratio (CR) (number of voxels activated on both maps to number of voxels activated on either map) was calculated.
RESULTS: In the ICA analysis, maps with appropriate spatial and temporal features for auditory, sensorimotor, or language cortices were identified in most patients. Images processed with ICA resembled images processed with conventional means. In patients who moved or performed the task incorrectly, ICA produced a map that resembled the expected activation pattern but differed from the conventional image. CRs averaged 70% for all comparisons in the 12 patients.
CONCLUSION: fMR imaging maps for auditory, sensorimotor, and language tasks produced with ICA and conventional techniques were similar in most cases. Differences were consistent with the particular characteristics of the method. In data sets corrupted by motion or incorrect task performance, ICA may produce more accurate maps.
Independent component analysis (ICA) is a blind source separation method that does not require knowledge of the expected hemodynamic response to identify activation with functional MR (fMR) imaging data sets. It can be used to identify task-related com-ponents in the data that are due to different spatial hemodynamic responses without the necessity of as-suming a reference function, as in conventional re-gression analyses (1–3). ICA, as formulated by Bell and Sejnowski (1), is a method of factoring measured
signals into a set of signals that are statistically inde-pendent by using a feed-forward neural network to estimate the independent components in the data. ICA can be used to effectively identify activated vox-els in synthetic fMR imaging data sets and data sets acquired in healthy subjects (4, 5). However, to our knowledge, ICA has not been extensively tested in patients.
The purpose of this study was to compare fMR images processed with spatial ICA and fMR imaging processed with conventional hypothesis-driven tech-niques in a series of patients referred by neurosur-geons for presurgical mapping. The advantage of ICA over conventional hypothesis-driven postprocessing methods is that it can be used to distinguish hemody-namic responses even if the response is not known. It may allow distinction of responses that do not ap-proximate or are not fully correlated with the ex-pected response. Therefore, in patients who do not
Received October 1, 1999; accepted after revision August 22, 2001.
From the Departments of Radiology (M.A.Q., V.M.H., C.H.M.) and Medical Physics (J.C., D.C., M.E.M.), University of Wisconsin, Madison.
Address reprint requests to M. Elizabeth Meyerand, PhD, De-partment of Medical Physics, 1530 Medical Sciences Center, 1300 University Avenue, Madison, WI 53706-1532.
©American Society of Neuroradiology
remain still during data acquisition or perform the tasks according to instructions, ICA may provide sat-isfactory maps when conventional hypothesis-driven methods fail.
Methods
For this study, data acquired in 12 patients referred for fMR imaging for neurosurgical planning were retrospectively ana-lyzed. Functional imaging was performed with a 1.5-T commer-cial imager equipped with high-speed gradients for echo-planar (EP) imaging. High-resolution anatomic images were obtained with multisection spin-echo sequences. For fMR imaging, a series of images was acquired in the coronal, axial, or sagittal plane, as the radiologist (V.M.H.) prescribed. Technical pa-rameters for these acquisitions included the following: 18 sec-tions, 64⫻64 matrix, 90° flip angle, 2000/50 (TR/TE), 24-cm field of view, 7-mm section thickness, and 1-mm intersection gap. Each patient performed three tasks: passive text listening, intermittent finger tapping, and silent word generation, accord-ing to a standard on-off block-type paradigm. For each para-digm, four or five epochs of tasks were interspersed with ep-ochs of rest. These tasks have been described elsewhere in detail (6–10).
Several filtering processes were applied to the data. Prior to reconstruction, the raw EP data were filtered by using a Ham-ming filter in the spatial-frequency domain to increase the signal-to-noise ratio (SNR) (11, 12). Voxels outside the brain were excluded from the analysis by eliminating those voxels on the EP image that had signal intensities below a prescribed threshold. In the remaining voxels, the temporal offset due to the order of section acquisition was corrected by means of linear interpolation. The Analysis and Visualization of Func-tional Neuroimages ( AFNI) 3D registration motion correction algorithm (13) was applied to the data to attempt to control for random and systematic patient motion.
For conventional processing of image data, the voxel time courses were analyzed with a linear regression model. The model parameters were estimated with a locally developed least-squares-fit algorithm. The observed data were compared voxel by voxel with constant (baseline signal intensity), ramp (signal drift), and boxcar (idealized expected response to the task or stimulus) functions. The boxcar function was convolved with a Poisson function and had a unit amplitude and a period matching each of the on-off cycles of the task or stimulus. A 6-s lag was incorporated into the reference function to account for the expected hemodynamic delay. The statistical significance of the estimated parameter for the boxcar reference function was assessed for each voxel with the Studentttest. Thistscore was then converted to azscore for comparison with ICA results. The level of significance on thezmaps was assessed with a test of their corresponding time courses. The null distribution for the test was estimated by randomizing of the boxcar reference function with a nonparametric statistical method (14, 15). This correspondingPvalue was determined to be less than .0001 for azscore greater than 4. Voxels with a zstatistic exceeding a threshold value of four were merged with coregistered ana-tomic images by using the AFNI display program (13).
For ICA, the code of Bell and Sejnowski (1) was used to separate the data into independent components. The resulting data matrix had approximate dimensions of 148 time frames⫻
14,000 voxels. The spatial maps of each component were over-laid on coregistered 3D volume anatomic datasets. Standard parcellation methods were used to identify the structures in which activation was observed. The spatial ICA component maps were ranked according tozscore. The maps were then inspected to select those that best conformed to the expected spatial patterns of activation. The ranking scheme, according to zscore, limited the number of components that needed visual inspection. The temporal characteristics of the selected ICA components were then correlated to the reference function to
verify that it was temporally related to task performance. The components that had temporal characteristics unrelated to the reference function were classified as artifacts, presumably due to head motion or pulsatile flow artifacts.
Concurrence between the maps processed with the hypoth-esis-driven method and the blind source separation method was measured by creating an intersect map that showed only those voxels with a significantzscore with both methods. A concurrence ratio (CR) was then calculated; it was equal to the number of these concurrent voxels in the intersect map divided by the average of the number of voxels that were independently activated with each of the two methods. CRs were then ex-pressed as percentages.
For each task in each patient, CRs were calculated for each section, and the section with the maximum CR was identified. Also, for each task in each patient, the average CR for all sections with activation in the eloquent cortex was tabulated. In some comparisons, averages were computed for as many as nine or 10 sections with activation in the auditory or motor cortices. In other comparisons, such as that involving the lan-guage task, as few as one or two sections were available for averaging. Additionally, overall average CRs were calculated for each patient and all patients.
Results
fMR imaging activation maps of good technical quality were acquired with the conventional hypoth-esis-driven method; all but two image sets that had evidence of patient motion or other corrupting arti-facts. These conventional maps showed activation in the superior temporal lobes (text listening); sensori-motor cortices, supplementary sensori-motor areas, and cer-ebellum (finger tapping); and left inferior frontal gy-rus (word generation). Examples of each of these eloquent areas are depicted in Figures 1A, 2A, and 3A. Other regions with activation were identified in some subjects.
In each of the 12 patients, one or more of the ICA components produced an activation map correspond-ing to the expected activation pattern for auditory and motor tasks. In four patients, ICA could not be used to identify a component with the appropriate spatial and temporal characteristics of an activation pattern for language. Examples of selected ICA components for auditory, motor, and language tasks are presented in Figures 1B, 2B, and 3B. Multiple components were mapped and inspected in each task. In most cases, the component with the task activation was among the 20 with the highestzscore. Of the multiple components generated with the ICA algorithm, only a few of those identified had maps of eloquent cortical regions.
and 3B) are depicted in Figures 1E, 2E, and 3E. The ICA components that temporally resembled the he-modynamic response correlated with the reference function, with correlation coefficients of .70, .64, and .38 in the cases illustrated. The use of a reference function is not necessary as part of the ICA. We included a correlation to a reference function simply as a method of verifying that the ICA component chosen on the basis of spatially expected patterns also was similar in the temporal domain.
In two patients, the data acquired during the alter-nating finger-tapping task had evidence of corruption.
In one case, the conventional map showed activation in both left and right sensorimotor cortices (Fig 4A), although, with this task and reference function, acti-vation typically is predominant in one hemisphere. Inspection of the time courses of voxels in the right and left motor cortices revealed temporal patterns of signal that suggested incorrect performance of the finger-tapping task. The patient moved the right hand not only when instructed but also when instructed to move the left hand. ICA, however, revealed robust activation in only the contralateral sensorimotor cor-tex (Fig 4B), as expected.
FIG2. Finger-tapping task in a patient with a left temporal glioma.
A–C, fMR images. The image pro-cessed with reference function analysis (A) shows activation in the sensorimotor cortices and sensorimotor area. The im-age processed with ICA (B) shows a sim-ilar pattern of activation. The intersect map of pixels identified on both the image processed conventionally and that pro-cessed with ICA (C) has a high CR (83%). Note the similarity of the three maps.
D, Time course plot of the activated voxel shows that the changes in signal are temporally correlated with task per-formance.
E, Temporal pattern of a selected ICA component (representing the highest z
score) has a .64 correlation between the time course of the component and the boxcar reference function.
FIG 1. Text-listening task in a patient with cortical dysplasia involving the left occipital lobe.
A–C, fMR images. The z score map processed with conventional analysis (A) and that processed with ICA (B) are sim-ilar. Both show bilateral activation in the auditory cortices. The intersect map of pixels identified inAandBis shown inC; it demonstrates a 91% CR between the maps inAandB.
D, Time course plot from an activated voxel in the conventional analysis shows that the changes in signal are temporally correlated with task performance.
E, Temporal pattern of a selected inde-pendent component in the ICA with the highest z score closely resembles the time-course plot of the activated voxel in
In the other case, the data acquired during finger tapping was corrupted by task-correlated head mo-tion (Fig 5A and C). Patient movement during the finger-tapping task was demonstrated on the motion-versus-time graph (Fig 5E), which revealed significant inferior-superior motion that was temporally related to the task periods. This motion led to notable false-positive findings in the conventionalzmaps (Fig 5A and C). However, in the ICA analysis, task activation and head motion were separated into different inde-pendent components; therefore, the maps of the com-ponent related to finger tapping (Fig 5B and D) were not corrupted.
CRs in all patients in the single section with the highest CR for auditory, motor, and language cortices are listed in Table 1. In patient 1, both the left and the right auditory cortices had a 79% concurrence be-tween the ICA and conventional z score activation map; 67% and 79% concurrence was observed in the left and right motor cortices, respectively, and a 78% concurrence was observed in the Broca area. The overall concurrence for this patient was 76%. In other patients, the CRs ranged from a low of 25% in the Broca area in patient 3 to a high of 98% in the left and right auditory cortices in patient 2. CRs ranged from 55% to 98% for auditory cortices, 35% to 84% for motor cortices, and 25% to 80% for the Broca area, with combined averages of 79%, 68%, and 57%, respectively. Average ratios with auditory, motor, and language tasks ranged from 55% to 85% for each patient, while the overall CR for all tasks in all pa-tients was 70%.
In Figures 6 and 7, multisection comparisons of auditory cortices are shown, and in Figures 8 and 9, the multisection comparisons of motor cortices are shown. The conventional, ICA, and intersect maps are shown for four representative cases. In most pa-tients in this study, one component was identified in each auditory and language task that was spatially related to the appropriate eloquent cortex. In the motor task data for this group, however, components were sometimes split between two ICA components, with the left cortex activated in one component and the right cortex in another. One such case is illus-trated in Figure 8. In this case, a component that mapped to only the left sensorimotor cortex and an-other that mapped to only the right sensorimotor cortex were found. The activation of the left (domi-nant) hemisphere in this left-hand finger-tapping task
FIG4. fMR images in a patient with a right meningioma. For this task, predominant activation typically is seen in the senso-rimotor cortex of one hemisphere.
A, Image processed with reference function analysis. The patient moved the left hand according to the on-off commands; however, the patient moved the right hand when instructed to move right hand and when instructed to move the left hand. Therefore, this image shows anomalous activation.
B, However, the image processed with the ICA component specific for activation in the right hemisphere shows the ex-pected unilateral activation pattern.
FIG3. Word-generation task in a patient with a left arteriovenous malformation.
A–C, fMR images. The image pro-cessed by using the reference function (A) and the image processed with ICA (B) are similar. The intersect map of pixels (C) shows that 80% of the pixels identified with the methods were the same (80% CR between the maps).
D, Time course plot selected from an activated voxel shows that the fluctuation in signal is temporally related to task per-formance.
differed from that of the right hemisphere (contralat-eral to the finger that was active). Because the dom-inant hemisphere had some activation with both con-tralateral and ipsilateral finger movements, different ICA components were found in the left and right hemispheres.
Table 2 lists the CRs determined when all the sections covering the relevant activated cortex were used in the calculation. With the auditory and motor data in all patients and with the language data in some patients, this calculation involved multiple sec-tions. Ratios were calculated, on average, in auditory cortices (typically six contiguous coronal sections), motor cortices (typically three sections), and the Broca area (typically one section). CRs for this com-parison ranged from a low of 25% in the Broca area in patient 3 to a high of 87% in the left and right auditory cortices in patient 6. Concurrence ratios ranged from 34% to 87% in the auditory cortices, 30% to 75% in the motor cortices, and 25% to 80% in the Broca area, with combined averages of 61%, 56%,
and 55%, respectively. Average ratios with auditory, motor, and language tasks ranged from 32% to 67% in each patient, while the overall CR for all tasks in all patients was 58%.
Discussion
These findings show concurrence between the ac-tivation maps produced with a conventional hypoth-esis-driven method and that produced with a blind source separation method. This overall concurrence is comparable to that of a first and second iteration of a task (ie, test-retest precision) (16). The findings further show that, in the case of task-related motion or improper performance of the task, ICA produced a map that was less severely confounded by artifact than those produced with the conventional method.
Major weaknesses of the ICA method at present are the lack of criteria for determining the physiologic importance of each component and the incomplete development and optimization of the method for
clin-FIG 5. Findings in a patient with focal seizures and a history of resection of a primitive neuroectodermal tumor and presumptive postoperative complica-tions. When performing the finger-tap-ping task with either hand, the patient appeared to move.
A–D, fMR images. The z score maps processed with reference to the standard boxcar (AandC) show activation in the sensorimotor cortex and motion-related artifact. Thezscore maps based on an independent component identified with ICA (BandD) show activation with less motion artifact.
[image:5.614.69.386.61.492.2]ical use. In the ICA algorithm used in this study, components identified with ICA were ranked accord-ing to theirzscores, that is, according to the proba-bility that the component did not merely represent a random series of values. We ranked independent components for mapping on the basis of theirzscores and then selected them on the basis of their spatial patterns. Thus, we examined the components in order of theirzscore. The components related to the acti-vation usually had the topzscores. Other components (eg, related to motion of the head) also often had the topzscores. We classified components as sensorimo-tor-, auditory-, or language-related on the basis of the spatial mapping pattern of the component. In addi-tion, we calculated the correlation with the standard reference function as a means to verify that the com-ponent was likely related to a task-induced hemody-namic response and not to some other effect, such as motion. Notably, while this correlation to the task
timing was effective in identifying task-related com-ponents, a reference function was not incorporated in the ICA algorithm. The components were produced on the basis of an assumption of statistical indepen-dence.
Selection of the components based on their spatial patterns introduced a bias in the study, because the investigator chose the components for mapping. Methods based on ICA, which would eliminate this source of bias, have been developed (17). They permit the selection of components based on both temporal and spatial patterns by using a hybrid application of data-driven analysis and an a priori reference function. Such programs may overcome the problem of observer bias in assigning physiologic importance to compo-nents identified with blind source separation meth-ods. However, this reduction in bias reduces the data-driven sensitivity of pure ICA, because the hybrid method requires a reference function.
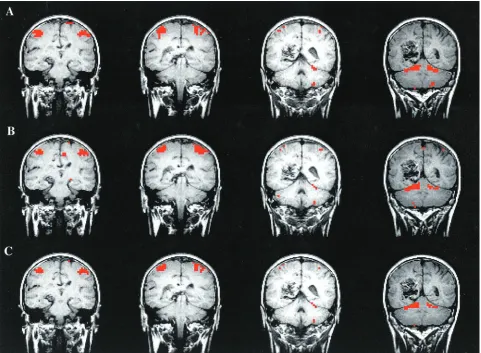
FIG6. fMR images obtained with the text-listening task in a patient with a cor-tical dysplasia involving the left occipital lobe. (Images in theleftmost columnare those in Figure 1, with the addition of the next three consecutive sections.)
Top row, Thez score maps obtained with conventional hypothesis-driven analysis.
Middle row, Thezscore maps obtained with ICA show good agreement with those in thetop row.
[image:6.614.67.548.74.243.2]Bottom row, The intersect map reflects an 87% CR for these four consecutive sections.
TABLE 1: CRs in the comparison of conventional z maps and ICA maps determined with single sections
Patient No. Auditory Cortex CR (%) Motor Cortex CR (%) Left Language Cortex CR (%)
Average CR (%)
Left Right Left Right
1 79 79 67 79 78 76
2 98 98 81 81 68 85
3 92 92 83 83 25 75
4 84 84 76 76 64 77
5 86 86 67 82 80 80
6 91 91 35 52 None 67
7 76 76 84 71 None 77
8 74 74 57 57 None 65
9 90 90 67 67 40 71
10 61 61 66 66 38 58
11 62 62 52 37 64 55
12 55 55 63 63 None 59
Average 79 79 67 68 57 70
[image:6.614.227.548.500.738.2]At times, ICA results in the identification of mul-tiple components for activation with a task. For ex-ample, different components were identified in the left and the right hemispheres with the finger-tapping task in one patient, and often, more than one com-ponent for activation is identified in each hemisphere
with finger tapping. For instance, when a right-handed person performs a left-hand task, the left sensorimotor cortex activation is less than that of the right sensorimotor cortex. The participation of the dominant hemisphere in ipsilateral motor tasks has been described previously (5). ICA can be used to
FIG7. fMR images obtained with a text-listening task in the patient with a left temporal glioma.
Top row, Consecutivezscore map obtained with conventional analysis.
Middle row, Consecutivezscore map obtained with ICA.
Bottom row, Concurrence in 81% with for these six sections, as reflected in the intersect map.
FIG8. fMR images in a right-handed patient with a right parasylvian arteriovenous malformation (depicted in the figure) performing the
find other components related to finger tapping in the basal ganglia and cerebellum, because the time courses of activation in the basal ganglia differ from those in the sensorimotor cortices (18). Ipsilateral
cerebellum and supplementary motor areas usually are included in the same component as sensorimotor activation, because the duration of activation in these areas is comparable.
FIG9. fMR images in a left-handed patient with a left posterior parietal arteriovenous malformation (depicted in the Figure) performing
[image:8.614.68.549.61.414.2]the finger-tapping task. Note that the four consecutive sections of the conventionalzscore map (top row), spatial ICA map (middle row), and intersect map (bottom row) are similar. In this case, just one independent component showed the left and right sensorimotor cortices in the same component. This component even included activation in the cerebellum that was found in both analyses. The CR in this four-section example was 73%.
TABLE 2: CRs in the comparison of conventional z maps and ICA maps determined with all sections
Patient No. Auditory Cortex CR (%) Motor Cortex CR (%) Left Language Cortex CR (%)
Average CR (%)
Left Right Left Right
1 75 (7) 75 (7) 49 (2) 59 (3) 78 (1) 67
2 59 (8) 59 (8) 73 (4) 73 (4) 68 (1) 66
3 81 (6) 81 (6) 71 (5) 71 (5) 25 (1) 66
4 63 (6) 63 (6) 75 (2) 75 (2) 50 (2) 65
5 68 (10) 68 (10) 47 (3) 51 (3) 80 (1) 63
6 87 (4) 87 (4) 35 (1) 48 (2) None 64
7 58 (5) 58 (5) 63 (2) 67 (2) None 62
8 64 (5) 64 (5) 49 (2) 49 (2) None 57
9 61 (8) 61 (8) 55 (4) 55 (4) 38 (2) 54
10 46 (7) 46 (7) 57 (4) 57 (4) 38 (1) 49
11 38 (5) 38 (5) 52 (1) 31 (2) 64 (1) 45
12 34 (6) 34 (6) 30 (4) 30 (4) None 32
Average 61 61 55 56 55 58
Compared with model-dependent methods, such as conventional correlation analysis, ICA can be used to distinguish functions on the basis of patterns in the data not a correlation of the data with an expected response or reference function. Therefore, it can be used to detect activation when the hemodynamic re-sponse is atypical or unexpected. It may demonstrate activation that is missed with model-dependent tech-niques when the actual hemodynamic response differs from the expected response. As these findings illus-trate, conventional methods are more sensitive to corruption of the data caused by the improper per-formance of the task or by motion during the task than ICA.
ICA does not replace conventional methods. It requires more computation than do conventional methods. It fails to identify activation secondary to word generation more often; the reason for this is not known. Possibly, the hemodynamic responses in vox-els within the expressive language regions differ suf-ficiently so that multiple independent components are generated, and no one component provides a map of the entire region. The conditions under which components are separated are not well known. Addi-tional studies, possibly with synthetic datasets, are required to understand the effects of ICA on varia-tions in the data.
Another reason for the inability of ICA to depict activation consistently in language areas may be the lack of uniformity of the blood oxygen level–depen-dent (BOLD) SNR across the brain. ICA, as applied in this study, is a spatial technique. Thus, spatial variations in the noise characteristics from one spatial location to another create a spatial bias for ICA. This bias is less significant for time-domain methods such as linear regression, because the BOLD response in each voxel is tested independently. We observed in our data a spatial variation in the SNR across the brain. Specifically, we found that the SNR was higher in the auditory and motor cortices than that in the frontal lobe regions. This observation may explain why the ICA method mapped language areas less robustly than did the regression analysis in this study. The difficulty in detecting language activation with ICA also may reflect the fact that simpler tasks (such as auditory or motor responses) are controlled and confirmed more easily than are more complex cognitive tasks (such as language production).
Additional studies are needed to determine if ICA has substantial advantages in clinical practice or re-search. While these findings suggest that ICA and conventional methods agree in most cases, more work is needed to determine if systematic differences exist. For ideal simulated fMR imaging responses, ICA was shown not to detect activation as well as traditional techniques such as regression models and Kolmog-orov-Smirnov tests (19). However, the variety of ab-normal fMR imaging responses is difficult to simulate in patients. ICA may perform better with the abnor-mal responses than with common responses at clinical fMR imaging. To address this issue, further clinical
case studies are needed. By definition, the two meth-ods are used to measure different characteristics of BOLD signal. Therefore, the two methods should not be expected to yield identical results. We would not necessarily expect CRs of 100%. Moreover, the CRs themselves, as calculated herein, were limited as a means of evaluating comparisons. First, a bias was introduced into the CR calculation, because the in-vestigator selected a single threshold for both the ICA and conventional fMR imaging maps. Second, CR values could be ambiguous; for instance, it is possible for two vastly different comparison scenarios to lead to the same CR value. To address these and other potential concerns, a more complete comparison of the two methods may include an exhaustive average CR on the basis of every threshold value pair that is possible between the two methods. Such an exhaus-tive comparison was beyond the scope of this study. The interest here was to determine if the established techniques for mapping functional activation with each of the two methods produce similar results.
The possibility that ICA has greater accuracy than that of conventional methods when the actual hemo-dynamic response differs from the expected response needs additional testing. ICA has not been optimized yet for fMR image processing. Optimal matrix size, task paradigms, and technical parameters for ICA have not been determined yet. Additional studies should be per-formed, with an increased number and variety of patient data under varying conditions and with fMR imaging paradigms that allow further comparison of conven-tional regression analysis with ICA results.
Conclusion
In most cases, ICA maps of task activation, without the assumption of a specific hemodynamic response, were comparable to maps prepared with conventional methods in which the hemodynamic response is mod-eled a priori. In cases in which the patient performed the task incorrectly or moved during data acquisition, ICA seemed to provide images of better quality. Fur-ther investigation of ICA for clinical fMR imaging is warranted.
References
1. Bell AJ, Sejnowski TJ.An information-maximization approach to blind separation and blind deconvolution.Neural Comput1995;7: 1129–1159
2. McKeown MJ, Sejnowski TJ.Independent component analysis of fMRI data: examining the assumptions.Hum Brain Mapp1998;6: 368–72
3. McKeown MJ, Makeig S, Brown GG, et al.Analysis of fMRI data by blind separation into independent spatial components. Hum Brain Mapp1988;6:160–188
4. Biswal BB, Ulmer JL.Blind source separation of multiple signal sources of fMRI data sets using independent component analysis. J Comput Assist Tomogr1999;23:265–71
5. Moritz CH, Haughton VM, Cordes D, and Meyerand ME. Whole-brain fMRI activation from a finger tapping task examined with independent components analysis.AJNR Am J Neuroradiol, 2000; 21:1629–1635
Haughton VM.Functional magnetic resonance imaging of somato-sensory stimulation.Neurosurgery1994;35:677–681
7. Mueller WM, Yetkin FZ, Hammeke TA, et al.Functional magnetic resonance mapping of the motor cortex in patients with cerebral tumors.Neurosurgery1996;39:515–521
8. Yetkin FZ, Hammeke TA, Swanson SJ, et al. A comparison of functional MR activation patterns during silent and audible lan-guage tasks.AJNR Am J Neuroradiol1995;16:1087–1092 9. Yetkin FZ, Mueller WM, Hammeke TA, Morris GL III, and
Haughton VM.Functional magnetic resonance image mapping of the sensorimotor cortex with tactile stimulation.Neurosurgery1995; 36:921–925
10. DeYoe EA, Bandettini P, Neitz J, Miller D, Winans P.Functional magnetic resonance imaging (fMRI) of the human brain.J Neurosci Methods1994;54:171–187
11. Lowe MJ, Mock BJ, Sorenson JA.Functional connectivity in single and multislice echoplanar imaging using resting state fluctuations. Neuroimage1998;7:119–132
12. Lowe MJ, Mock BJ, Sorenson JA.Resting state fMRI signal cor-relation in multi-slice.Neuroimage1996;3:257
13. Cox RW.AFNI: Software for analysis and visualization of
func-tional magnetic resonance neuroimages.Comput Biomedl Res1996; 29:162–173
14. Sprent P.Applied Nonparametric Statistical Methods.London, En-gland: Chapman and Hall; 1993
15. Holmes AP, Blair RC, Watson DG, Ford I.Nonparametric anal-ysis of statistic images from functional mapping experiments.J Ce-rebral Blood Flow Metab1996;16:7–22
16. Nybakken GE, Quigley M, Moritz C, Cordes D, Haughton V, Meyerand E.Test-retest precision of two fMRI data processing techniques: independent component analysis and student t-test. NeuroradiologyIn press.
17. McKeown MJ.Detection of consistently task-related activations in fMRI data with hybrid independent component analysis. Neuroim-age2000;11:24–35
18. Moritz CH, Meyerand ME, Cordes D, Haughton VM.Functional MR imaging activation after finger tapping has a shorter duration in the basal ganglia than in the sensorimotor cortex.AJNR Am J Neuroradiol2000;21:1228–1234