N
ATIONAL
S
URVEY OF
V
ACANCIES IN THE
P
RIVATE
N
ON-AGRICULTURAL
S
ECTOR
2001/2002
A study for the Expert Group on Future Skills
Needs by the Economic and Social
Research Institute
Gerard Hughes James Williams Sylvia Blackwell Barra Casey
Final Report December 2002
ESRI Project Team
F
OREWORD
II
This report is submitted by the Expert Group on Future Skills Needs to Mary Harney, T.D., Tanáiste, and Minister for Enterprise, Trade ane Employment. The report presents the results of research into national vacancies in the private non-agricultural sector in Ireland. It is the third in a series of national vacancy studies undertaken by the Economic and Social Research Institute, who were appointed by Forfás and FAS, acting on behalf of the Expert Group on Future Skill Needs.
The aim of the work was to assess the incidence, level, nature and consequences of vacancies in Ireland today. The survey, which was based on a nationally representative sample, was carried out the end of 2001 and in the first quarter of 2002 and this report summarises the key findings of the work. In addition to detailing the extent and nature of vacancies, the study provides useful information about firms experiencing difficulties in retaining staff, the extent of recruitment from abroad, perceptions of changes in skills and on the regional variations of vacancies.
The report highlights the changes that have taken place in the labour market since the second national vacancy survey was undertaken in 1999/00. It charts the changes in the number of reported vacancies, by sector and by occupation, and provides details on those occupations and sectors in which vacancies have either increased or decreased.
On behalf of the Expert Group on Future Skill Needs, we wish to thank the steering group who guided the work, Prof. Gerard Hughes and Prof. James Williams of the Economic and Social Research Institute for their dedicated work on the project, and in particular, all the firms who participated in the study. The findings of this study are important and provide a valuable insight into the changes in the Irish labour market over the period 1999/00 to 2001/02.
Dr Daniel O'Hare, Chairman
C
ONTENTS
Executive SummaryXI
Chapter
1. INTRODUCTION 1
2. SURVEY DESIGN AND IMPLEMENTATION
2.1 The Questionnaire 3
2.2 Sample Design and Response Rate 4
2.3 Re-weighting the Data 4
2.4 Survey Implementation 6
3. EMPLOYMENT LEVELS AND TRENDS 7
3.1 Sectoral Changes in Employment Structures 7
3.2 The Structure of Employment, 2001/2002 8
3.3 Changes in Employment Structures 1998/1999 to 2001/2002 12
3.4 Employment Projections for One Year’s Time 12
3.5 Summary 16
4. INCIDENCE AND LEVELS OF CURRENT VACANCIES 23
4.1 The Incidence of Current Vacancies 23
4.2 The Level of Current Vacancies and Changes Therein Over
the Last Twelve Months 25
4.3 Recruitment Abroad 32
4.4 The Incidence of Difficult-to-Fill Vacancies 34
4.5 Summary 35
5. VACANCIES OVER THE PREVIOUS YEAR 42
5.1 Incidence of Difficult-to-Fill Vacancies of the Last Year 42
5.2 Nature of Most Difficult-to-Fill Vacancies 45
5.3 Consequences of Difficult-to-Fill Vacancies 46
5.4 Steps Taken to Address Difficult-to-Fill Vacancies 47
5.5 Summary 51
6. DIFFICULTIES IN RETAINING STAFF AND PERCEIVED
CHANGES IN SKILL LEVELS 52
6.1 Difficulties in Retaining Staff -Incidence Levels
and Nature of Jobs Affected 52
6.2 Perceptions of Changes in Skill Requirements 54
6.3 Summary 55
7. REGIONAL VARIATIONS 56
7.1 Regional Trends in the Incidence of Current Vacancies
and Vacancy Rates 56
7.2 Regional Trends in Vacancy Rates 58
7.3 Regional Trends in Difficult-to-Fill Vacancies 60 7.4 Regional Trends in Difficulties in Retaining Existing Staff 64
7.5 Summary 66
8. TRAINING 68
8.1 Incidence of Formal, Structural Training 68
8.2 Summary 72
9. MAIN FINDINGS 73
9.1 Background 73
9.2 Size and Forecasted Growth of the Labour Market 73
9.3 Incidence and Level of Vacancies 73
9.4 Difficult-to-Fill Vacancies 74
9.5 Difficulties in Retaining Staff 74
L
IST OF
T
ABLES
Table Page
2.1 Response Outcomes from 2001/2002 Survey of Vacancies 4 2.2 Structure of Population of Enterprises as Derived from Census of Industrial
Production, Various Annual Services Enquiries and the Labour Force Survey 6
3.1 General Trends in Employment Levels 7
3.2 Breakdown of Current Employees by Occupational Grade 9 3.3 Comparison of Employment Structures by Grade, 1998/99, 1999/00 and
2001/02 13 3.4 Employment Projections by Occupational Grade for Twelve Months Period,
2002 to 2003 14
3.5 Summary Employment Projections by Broad Sector 2002 to 2003 15 3.6 Projected Employment Change 2002 to 2003 Classified by Occupational
Grade and Broad Sector 17
4.1 Firms Classified by (a) Whether or Not They Currently Have Job
Vacancies and (b) Size/Sector 24
4.2 Comparison of Sectoral Incidence Rates for Vacancies by Sector, 1998/99,
1999/00 and 2001/02 24
4.3 Summary of Vacancies by Occupational Grade, All Sectors in Aggregate 26 4.4 Summary Rates of Vacancies by Occupational Grade Within Each
Size/Sector Category in Percentages 28
4.5 Distribution of Firms According to (a) Number of Current Vacancies
and (b) Vacancies as a Percentage of Current Workforce 29 4.6 Comparison of Vacancy Levels and Rates in 1998/99, 1999/00 and
2001/02 29 4.7 Distribution of Number of Private Sector Employees, Vacancies
and Vacancy Rates Classified by Occupational Grade, 1998/99,
1999/00 and 2001/02 31
4.8 Firms Which Have Current Job Vacancies Classified According to
Whether or Not They Are Attempting to Recruit Abroad 32 4.9 Comparison of the Incidence of Attempted Overseas Recruitment by
Firms Which Were Experiencing Current Vacancies Classified by
Size/Sector Classification 33
4.10 Number of Persons Recruited from Other EU Countries or from the
Rest of the World in the 12 Months Preceding the 2001/02 Survey 34 4.11 Firms Classified by Whether or Not They Currently have Job Vacancies
Which They Consider Difficult-to-Fill 34
4.12 Firms Which Have Current Vacancies Classified According to Whether
or Not They Feel that Some or All of their Vacancies are Difficult-to-Fill 35 4.13 Comparison of Percentage of Firms in 1998/99, 1999/00 and 2001/02
Rounds of the Survey Which Experience Current Vacancies and Which Also Feel that Some of those Vacancies are Difficult-to-Fill 36 5.1 Firms Classified According to Whether or Not They Have Had any
Vacancies in the Last Year Which Were Particularly Difficult-to-Fill 42 5.2 Firms Which Had Difficult-to-Fill Vacancies Throughout Last Year
Classified According to Whether or Not They Also Had Current Vacancies
Which Were Difficult-to-Fill 43
5.3 Percentage Breakdown of Firms Which Had Experienced Both a Current Difficult-to-Fill Job Vacancy and Also a Difficult-to-Fill Vacancy in the Year Preceding the Survey, Classified According to Size/Sector 43
5.4 Percentage of Firms Reporting Having Experienced a Difficult-to-Fill Vacancy in the 1998/99, 1999/00 and 2001/02 Rounds of the Survey Classified by
Size/Sector Category 45
5.5 Nature of the Single Vacancy or Type of Vacancy Which the Firm
Found Most Difficult-to-Fill in Last Year 45
5.6 Comparison of the Nature of the Single Vacancy or Type of Vacancy Which the Firm Found the Most Difficult-to-Fill in the Year Preceding
the Survey 46
5.7 Perceived Consequences of Difficulties Associated with Hard-to-Fill
Vacancies Which Firm Experienced in the Last Year 47 5.8 Comparisons of Perceived Consequences of Difficulties Associated
with Hard-to-Fill Vacancies Which Firm Experienced, in the Year
Preceding the Survey in the 1998/99, 1999/00 and 2001/02 Rounds 48 5.9 Steps Taken by Firms to Address the Difficult-to-Fill Vacancies
Which Were Experienced by Firms in the Last Year 49 5.10 Comparisons of Steps Taken by Firms to Address the Difficult-to-Fill
Vacancies Which They Had Experienced in the Preceding Twelve
Months in 1998/99, 1999/00 and 2001/02 50
6.1 Current Difficulties in Retaining Existing Staff 52 6.2 Percentage of Firms Reporting Difficulties in Retaining Staff in the
1998/99, 1999/00 and 2001/02 Rounds of the Survey Classified by
Size/Sector Category 53
6.3 Nature of Jobs in Which Firms Currently Find Most Difficulties in
Retaining Staff 53
6.4 Firms’ Perceptions of Trends in the Overall Skills Needed to Keep Their
Company Running Effectively 54
6.5 Comparison in Perceptions of Required Skill Levels in 1998/99,
1999/00 and 2001/02 Surveys 55
7.1 Firms Classified by (a) Whether or Not They Currently Have Job
Vacancies and (b) Broad Region 57
7.2 Comparison of the Incidence of Vacancies by Sector and Region
1998/99, 1999/00 and 2001/02 Surveys 58
7.3 Summary of Labour Requirements Satisfied by Occupational Grade in
Dublin and the Rest of the Country in 1998/99, 1999/00 and 2001/02 59 7.4 Firms Classified by (a) Whether or Not They Currently Have Job
Vacancies Which They Consider Difficult-to-Fill and (b) Broad Region 61 7.5 Comparison of the Incidence of Vacancies by Sector and Region 1998/99,
1999/00 and 2001/02 Surveys 61
7.6 Firms Classified According to (a) Whether or Not They Have Had any Vacancies in the Last Year Which Were Particularly Difficult-to-Fill
and (b) Broad Region 62
7.7 Comparison of the Incidence of Difficult-to-Fill Vacancies in the Year Preceding the Survey by Sector and Region 1998/99, 1999/00
and 2001/02 Surveys 63
7.8 Current Difficulties in Retaining Existing Staff Classified by Broad Region 64 7.9 Comparison of the Incidence of Difficulties in Retaining Staff by Sector
and Region in the 1998/99, 1999/00 and 2001/02 Surveys 65 7.10 Comparison of the Nature of Jobs in Which Firms Find Difficulty
in Retaining Staff, Classified by Broad Region in the 1998/99, 1999/00 and
8.1 Firms Classified According to Whatever or Not Anyone in the
Company (Apart from Apprentices) Attended Formal, Structured Training Course in the Twelve Months Preceding the Survey 69 8.2 Summary of the Incidence of Formal Training Among Companies
1998/99, 1999/00 and 2001/02. Percentage of Firms Participating
in Formal, Structured Training 69
8.3 Number of Persons Undertaking Formal, Structural Training; Total Days on Such Training Courses and Average Length of Such Training Classified
by Size and Sector 70
8.4 Firms Which were Engaged in Formal, Structured, Training in the Twelve Months Preceding the Survey Classified According to the Percentage of their Total Workforce which Attended Such Training 71
Appendix Tables Page
Appendix Table A3.2: Breakdown of Current Employees by
(i) Occupational Grade (ii) Size and (iii) Sector 19 Appendix Table A3.6: Current Employment, Projected Employment
in One Year’s Time and Absolute Change and Percentage Change
Classified by Sector and Size 20
Appendix Table A4.4: Current Employment, Vacancies and Percentage of Labour Requirement Currently Being Met, Classified
by Size and Sector 39
X
E
XECUTIVE
S
UMMARY
T
his report is based on a national survey of just over 4,600 private sector firms which was carried out on behalf of The Expert Group on Future Skills Needs in late 2001/early 2002. The data provided by respondents in the survey were statistically adjusted to ensure that they adequately represented the population of non-agricultural private sector employment. This adjustment was based on national population figures from various official Central Statistics Office sources such as the Quarterly National Household Survey, the Censuses of Industrial Production, Census of Services etc. The survey is the third in a series – the first and second were undertaken in the same period in late 1998/early 1999 and late 1999/early 2000. This provides us with a firm basis for making comparative statements on changes and trends in the incidence and levels of vacancies over the period 1998/1999 to 2001/2002.The focus of the study is the incidence of vacancies (i.e. the percentage of different types of firms – by sector, size etc. – which experienced such vacancies), the number of vacancies, the incidence of difficult-to-fill vacancies, and the problems posed by the vacancies in question as well as employers’ responses to them etc. In addition, we examine issues such as the difficulties experienced by employers in retaining their existing staff, and broad regional variations in vacancy levels.
T
he unprecedented levels of economic growth in the five years up to 2000 were accompanied by equally unprecedented growth in employment. During the period April 1995 to March-May 2000 the number employed grew by almost 78,000 annually. Since then employment growth has slowed down to about half that figure with employment growing at about 40,000 annually between March-May 2000 and March-May 2002. The current vacancies survey took place in late 2001/early 2002 which was well into the period of slower employment growth. These figures include three main exclusions to the figures contained in this report, viz. the Agricultural Sector, the Public Sector and those employed in their own right without employees. When these exclusions are taken into account the estimated employment in the sectors covered by the survey grew from 1,053,000 in 1998/99 to 1,141,000 by end 1999/start 2000 to 1,181,000 in 2001/2002. This gives a growth level of the order of 88,000 persons at work in the sectors in question between 1998/99 (representing a growth rate of 8.4 per cent) and an annual growth of 20,000 between 1999/2000 and 2001/2002 (representing a growth rate of less than 2 per cent). In the context of the slow down in the number of persons at work, it is not surprising that labour shortages have reduced in the economy. The most rapid growth rates in employment in the relevant sectors over the period in question were experienced in the Construction sector (20 per cent or 23,000 persons) and Finance/Insurance/Business Services (14 per cent or 23,000 persons). Employment in Traditional Manufacturing and Hi-Tech. Manufacturing fell by 4 and 2 per cent respectively (5,000 and 4,000 persons) and there was also a small fall in employment in Transport/Personal/Other Services.Background
I
n the course of the survey firms were asked to project their employment growth to the end of 2002 beginning of 2003. The respondents’ forecast employment growth throughout 2002 of 1 per cent (12,000 jobs) in the relevant sectors of the economy.This figure may be a little pessimistic as The Economic and Social Research Institute (ESRI) is forecasting 2 per cent employment growth in 2002.
INCIDENCE OF VACANCIES
Vacancies were defined in the course of the survey as “…unmet demand for labour where the positions are currently unoccupied, available immediately and where the company is actually searching for workers”. A significant minority of firms (22 per cent) recorded that they currently had some such vacancies.
The incidence of vacancies was highest in the Manufacturing sectors in which about one-third of firms recorded having a vacancy.
In general, the incidence levels were substantially higher amongst large firms in each sector than among their smaller counterparts. This contrast between large and small firms was quite substantial for some sectors. For example, in Finance/Insurance/Business Services a total of just over 25 per cent of small as compared with 52 per cent of large firms said that they were experiencing a current vacancy. These differences between large and small firms may not be too surprising. By definition, the larger the firm the more employment “slots” it has. The more employment “slots” which the firm has the higher will be its probability of one or more of them being vacant at any time.
The 22 per cent of firms which reported having vacancies in the 2001/02 survey represents a nine percentage point decrease in the situation from the second round of the survey when the corresponding figure was 31 per cent. In terms of sectoral change over the preceding survey, the incidence of vacancies fell in all sectors except Finance/Insurance/Business Services in which the percentage of firms reporting vacancies increased from 26 to 28 per cent. The decrease was greatest in Distributive Services where the percentage of firms reporting vacancies almost halved from 28 per cent in 1999/00 to 15 per cent in 2001/02 and in Construction where the percentage reporting vacancies fell by almost 40 per cent from 34 per cent to 21 per cent between the 1999/00 and 2001/02 surveys. The proportion of firms reporting vacancies in the remaining sectors fell by 30-35 per cent.
T
hese incidence levels translated to a total of 40,000 vacancies in 2001/02. This represents a fall of nearly 50 per cent in the number of vacancies over the previous survey, when the figure stood at 77,600.This level of vacancies represents a vacancy rate from the 2001/02 survey of 3 per cent. In other words, 3 per cent of the total labour requirement in the economy is not being met. The comparable rate from the 1999/00 survey was over 6 per cent.
The occupational grades with the highest vacancy rates were Skilled Maintenance & Production Workers (8 per cent) and Science Professionals and Engineering Technicians (both 5 per cent). Comparison of vacancy rates by occupational category with those in the previous survey indicates that they have fallen for all occupational groups except Science Professionals, Science Technicians, and Other Associate Professionals. In terms of the share of vacancies accounted for by particular occupations most of the existing vacancies are for jobs requiring intermediate or lower level skills. Between them five occupational categories accounted for almost two-thirds of all
Employment
Forecasts
EXECUTIVESUMMARY XII
vacancies in the economy in the 2001/02 survey: Skilled Maintenance & Production Workers (21 per cent), Sales (12 per cent), Production Operatives (11 per cent), Personal Services, and Labourers & Security (both 10 per cent).
In addition to considering vacancy rates and shares of vacancies the report also considers, in detail, the level of vacancies by sector and occupation and provides a comparison of changes in vacancy levels between the second and third survey. The most substantial change in vacancy levels by sector was found in the Transport/Personal/Other sector where the figure fell from an estimated 25,200 in the second survey to 9,400 in the 2001/02 round. This represents a decrease of 60 per cent over the previous survey.
There were only two occupations which experienced an increase in the number of vacancies between the second and third rounds of the survey. These were Science Technicians and Other Associate Professionals which had an increase of 300 and 200 vacancies respectively.
The report finds that the remaining occupational groups experienced a fall or no change in the number of vacancies between 1999/00 and 2001/02. The most substantial absolute fall in vacancy numbers was in Personal Services which declined from 12,400 in 1999/00 to 4,200 in 2001/02. Vacancies in the Computer Technical (Associate Professional) and Computer Professional groups also fell in absolute terms – by 400 persons in each case.
O
ne response to the problem of labour shortages is, of course, to recruit abroad. Just over 27 per cent of all firms which had a vacancy were attempting to recruit abroad. The incidence of this was highest in the Transport/Personal/Other Services (42 per cent of such firms) and Traditional Manufacturing sectors (35 per cent of such firms). Rates were lower than average in the Hi-Tech. Manufacturing, Construction, and Distributive Services sectors all in the region of 18 per cent.Additional information was collected in the current survey on the areas from which firms recruited abroad. Approximately 21,000 workers were recruited from outside Ireland in the twelve months preceding the survey. Over one-third of these came from other EU countries and the remainder from countries outside the EU. The Finance/Insurance/Business Services sector had the highest percentage of overseas recruits from other EU countries (67 per cent) while Construction and Traditional Manufacturing recruited 75 per cent and 83 per cent respectively of their overseas recruits from countries outside the EU. The data on the sourcing of labour from overseas suggests that relatively high-skill sectors are likely to find the workers they require in other EU countries whereas relatively low-skill sectors are likely to fill their vacancies by recruiting from countries outside the EU.
I
t was found that 56 per cent of firms which were experiencing current vacancies felt that some or all of them were difficult-to-fill. This means that about one-eighth of all firms in the population were experiencing a difficult-to-fill vacancy. This is substantially lower than the levels recorded in both of the previous rounds of the survey when around one-quarter of all firms experienced difficult-to-fill vacancies. The reduction in the percentage of firms experiencing current vacancies reporting some difficult-to-fill vacancies was spread across all sectors. The reduction was greatest in Transport/Personal/Other Services and Construction and least in Traditional Manufacturing.Recruitment
Abroad
T
he perceived consequences of difficult-to-fill vacancies principally included increased strain on management and staffing due to their covering the labour shortages in question (mentioned by 81 per cent of relevant respondents). This was followed by restricted business development (56 per cent), and loss of quality of services (53 per cent). Other consequences mentioned on a quite frequent basis included increased recruitment costs, increased running costs and loss of business to competitors (each mentioned by 28-37 per cent of relevant respondents). Comparing the responses in the current survey with those in previous surveys it is evident that decreasing proportions of firms are saying that their business development is restricted or their recruitment costs are increased by difficult-to-fill vacancies.I
n the course of the survey a set of pre-coded options for dealing with difficult-to-fill vacancies was presented to the respondent. These included short- to medium-term pay and non-pay options. The pay strategy related to offering increased pay levels to employees. The short-term non-pay strategies ranged from hiring part-time or contract staff to considering a wider range of people for the jobs available. The medium-term strategies ranged from retraining existing staff, to developing greater links with schools and colleges. When presented with this set of options it was found that 51 per cent of firms which had experienced difficult-to-fill vacancies in the twelve months preceding the survey said that labour shortages had forced then to offer higher pay to staff. This was 4 percentage points lower than in the previous round of the survey. The incidence of using part-time and contract staff as a response to difficult-to-fill vacancies fell by 5 percentage points from 35 per cent in the previous survey to 30 per cent in the current survey. In contrast, about the same percentages of firms seemed to be adopting policies related to the retraining of their existing staff or to the training of less qualified recruits.O
ne particularly positive consequence of labour shortages for employees is the extent to which they are offered a greater range of job opportunities from which to choose. As a result, however, firms may experience increasing levels of staff turnover as employees move more rapidly from one employer to another. This means that firms may experience not only difficulties in recruiting staff, they may also experience difficulties in retaining existing staff. The survey found that about 12 per cent of all firms reported difficulties in retaining their current staff. This rate was highest in the Hi-Tech.. Manufacturing sector, where about one-fifth of companies (21 per cent) said that they were experiencing difficulties in retaining staff and in the Transport/Personal/Other Services and Traditional Manufacturing sectors (16 per cent in both cases). The percentage of firms experiencing difficulties in retaining staff was significantly lower in the current survey, 12 per cent, than in the previous survey, 19 per cent.The types of jobs for which firms were finding most difficulty retaining staff were in areas such as Skilled Trades Persons, Unskilled Workers, and Clerical Workers.
Compared with the previous survey there were some fairly substantial changes in the types of workers mentioned as being most difficult to retain. For example, the percentages of firms mentioning both Skilled Trades Persons and Retail Sales staff have fallen substantially while the percentages mentioning Unskilled Workers and Clerical Workers have increased.
Consequences
of
Difficult-to-Fill Vacancies
Steps taken to
Address
Difficult-to-Fill
Vacancies
EXECUTIVESUMMARY XIV
T
he report finds that only 3 per cent of firms said that required skill levels among their workers were decreasing, 68 per cent said they were static while the remaining 29 per cent said they were increasing. At a broad sectoral level the highest percentage of firms stating that skill requirements among workers were increasing was in the following three sectors: Finance/ Insurance/Business Services sector (44 per cent), Hi-Tech. Manufacturing (38 per cent), and Traditional Manufacturing (34 per cent). Among large companies in the Finance/Insurance/Business Services sector 48 per cent said that skill levels were increasing. The percentage of firms in the current survey which said that skill levels are static has increased as compared to the 1999/00 survey and, consequently, the percentage saying they have increased has dropped. Nonetheless, these responses indicate that a significant minority of firms in all sectors believe that higher levels of education and/or training will be needed by workers in the future.P
revious vacancy surveys were somewhat constrained in the extent to which they could disaggregate the data geographically because of the relatively small number of sample responses in any resultant breakdown. The sample size for the current survey was increased to permit analysis of vacancies data for three regions: Dublin (city and county), the Border, Midlands and Western region and the Southern and Eastern region.From this regional analysis the survey found that the percentage of firms in Dublin which were experiencing a current vacancy (25 per cent) was somewhat higher than the percentage in the Border, Midlands and Western region (22 per cent) and in the Southern and Eastern region (18 per cent).
The overall regional trends suggest that the differences in the incidence of vacancies between Dublin and the Rest of the Country narrowed somewhat between the 1998/99 and 1999/00 surveys but widened between the 1999/00 and 2001/02 surveys. In the first survey the incidence levels in Dublin were some 40 per cent higher than those in the Rest of the Country. In the second survey they had fallen to 21 per cent while in the current survey they had increased to 28 per cent. These figures suggest that the upswing in demand for labour occurred initially in the Dublin region and then spread to the Rest of the Country while the downswing in demand was initially felt in the Rest of the Country.
F
irms were asked to indicate if anyone in the company (including the owner-manager or proprietor (but excluding apprentices and on-the-job training) had attended formal structured training in the twelve months preceding the survey. About one-third of firms said that some of their staff had participated in such training. The incidence levels were highest in the Manufacturing sectors with 60 per cent of firms in the Hi-Tech. sector and 53 per cent in Traditional Manufacturing reporting such training. The Transport/ Personal/Other Services sector reported the lowest incidence level with only about a quarter of firms reporting that some of their staff had participated in formal structured training in the twelve months before the survey. Much higher percentages of larger than smaller firms reported some staff participating in such training.Changing Skill
Levels Required
in Business
Regional
Variations in
Vacancy Rates
1
1. I
NTRODUCTION
T
he Irish economy has experienced a slow down in employment growth since the last vacancies survey was carried out at the end of 1999 and the beginning of 2000. In the quarter December to February 2000 the total number of persons at work stood at 1.65 million. This represented an increase of 102,700 persons at work over the preceding 12 months or an increase of almost 175,000 persons over the preceding two years. In the same quarter in 2002 total employment amounted to 1.75 million, an increase of 35,600 over the preceding year or of almost 95,000 over the preceding two years. This slow down in the growth of employment was expected as expansion at the rate experienced during the last half of the 1990s was unsustainable. Nevertheless, the increasing demand for labour continued to be accommodated by an increase in the female labour-force participation rate from 46.8 in 2000 to 48.7 in 2002 and continuing net immigration.In the context of a slow down in employment growth it is clearly important to attempt to measure the extent of constraints to further expansion and development of the labour market in both the private and public sectors of the economy. The 2001/2002 survey extended the scope of the previous surveys to encompass public sector organisations. The results for the public sector will be presented in a separate report. The current report is the third in the series published by FÁS, Forfás and the ESRI. The first report was authored by Williams and Hughes (1999) and the second by Williams, Blackwell, and Hughes (2001).1
The two reports examined the situation regarding vacancies in 1998/1999 and 1999/2000. The present report updates the earlier ones and presents information on vacancies and other labour market indicators for 2001/2002 for the private non-agricultural sector.
This report is based on a nationally representative sample of private sector firms. It was jointly commissioned by Forfás and FÁS for the Expert Group on Futures Skills Needs with a view to assessing the incidence, level, nature and consequences of vacancies in Ireland today. Of particular interest is an examination of vacancies which businesses feel are “difficult-to-fill”.
The information was collected in postal surveys with intensive phone follow up. In addition to details on the level and structure of employment, the report provides information on vacancy rates and where vacancies occur both by sector and occupational group within sector. The impact and consequences of vacancies (and especially difficult-to-fill vacancies) are considered in detail. Issues related to the retention of existing staff within business are also addressed.
The report is divided into nine chapters. In Chapter 2 we discuss survey design, questionnaire structure, response rates and re-weighting of the data. In Chapter 3 we discuss the size and structure of the current labour force in terms of sectoral distributions and grade within sector. Chapter 4 addresses the core issue of the incidence, level, nature and consequences of current vacancies. Chapter 5 examines vacancies which were experienced in the
1
James Williams and Gerard Hughes, 1999. National Survey of Vacancies in the Private
Non-Agricultural Sector 1998. Dublin: The Economic and Social Research Institute, and James
Williams, Sylvia Blackwell and Gerard Hughes, 2001. National Survey of Vacancies in the Private
3
2. S
URVEY
D
ESIGN AND
I
MPLEMENTATION
I
n this section we explain how the survey was designed and outline our approach to the analysis of the data. First, we consider the structure and content of the questionnaire; second, we discuss sample design and response rates; third, we consider the way in which the data were re-weighted. This third section presents a detailed breakdown, in terms of NACE composition, of the sectoral classification adopted throughout the report. Finally, in the fourth section we discuss the way in which the survey was implemented.T
he questionnaire was designed to collect details on, inter alia, current employment size and structure; projected employment; and vacancies. In the context of vacancies a large proportion of the survey form was devoted to recording information on the nature of difficult-to-fill vacancies both those which are currently being experienced as well as those which were experienced over the twelve months preceding the survey. The questionnaires contained a total of 9 sections as follows:A. Background details and classificatory variables; B. Current employment size and structure;
C. Level of current vacancies and incidence of difficult-to-fill vacancies; D. Employment projections for one year’s time;
E. Nature, characteristics and consequences of the current difficult-to-fill vacancies;
F. Incidence, nature, and consequences of difficult-to-fill vacancies; G. Difficulties in retaining current staff;
H. Firms’ perceptions of changes in skill levels required to ensure the efficient running of their company;
I. The incidence, level and nature of training undertaken by companies.
A common questionnaire was used to survey both the public and private sectors with some questions amended to take account of upper limits on the number who can be employed in public sector organisations. In the 2001/02 survey firms were asked to provide for each broad occupational category information on the job titles of the types of vacancies which currently exist along with the number of each type of vacancy. This required an increase in the number of questions relating to type of vacancy. In order to accommodate this increase it was necessary to drop some of the questions asked in previous surveys relating to reasons for problems in filling vacancies, reasons for difficulties in retaining staff, and type of training provided. The sample size was increased substantially from about 2,900 firms in the 1999/00 survey to almost 3,900 in the current survey to permit analysis of the vacancies data for three regions: Dublin (city and county), the Border, Midlands and Western Region (BMW), and the Southern and Eastern region (S&E).
T
he objective of the survey was to provide a representative picture of the issues surrounding vacancies among private sector employing entities. The sample used came from two sources. First, we approached all firms which we successfully interviewed in the second round of the survey in 1999/00. A total of 969 of these firms was found to still be in business and so were included in the valid target sample. In addition, a fresh random stratified target sample of just over 2,900 private sector businesses was selected from lists of firms which are maintained in The Economic and Social Research Institute. Prior to sample selection these firms were stratified according to sector, size (number of employees) and region. A total of 8 sectors was used as follows: traditional manufacturing, hi-tech manufacturing, construction, wholesale/retail, property/renting/business services, finance/insurance/ banking/computer services, transport/personal/other services. Within each sector firms were also stratified according to number of employees. Firms were stratified by region within each of these broader stratifications. A disproportionate systematic sample was then selected with a view to ensuring that each sector/size stratum would be reasonably represented in terms of absolute number of cases in the final effective sample for analysis and reporting.These two sources left us with a total target sample of 3,880 firms for interview. The response outcomes are as outlined in Table 2.1 below.2
From this one can see that a total of 1,635 firms successfully completed the questionnaire and the report is based on the analysis of their responses. This means that the overall effective sample response rate is 42 per cent. The response among the sample from the 1999/00 survey was 60 per cent while that from the additional fresh sample was 36 per cent. These figures are largely in line with what one would expect from a general,3
nationally representative survey of firms in the target sample. Only 4 per cent of all firms explicitly refused to participate in the survey. A substantial proportion of firms, however, did not respond to the survey and their non-responses could be interpreted as a de facto refusal.
Table 2.1: Response Outcomes from 2001/02 Survey of Vacancies Sample from 1999/00
Survey
Fresh Sample for 2001/02
Total Sample No. of Cases Per Cent No. of Cases Per Cent No. of Cases Per Cent
Successfully Completed 586 60 1,049 36 1,635 42 Partially Completed but Unusable 13 1 26 1 39 1
Non Response 345 36 1,695 58 2,040 53
Refusal 25 3 141 5 166 4
Total 969 100 2,911 100 3,880 100
P
rior to analysis, the 1,635 questionnaires from responding firms were statistically adjusted in order to ensure that the structure or composition of the effective sample is in line with the structure or composition of the population from which it has been selected according to a number of important classificatory variables such as size, sector etc. The re-weighting of the data is necessary for two reasons.2 This table excludes businesses which were initially selected but which were identified in the
course of fieldwork as: having gone out of business; unknown at address; not relevant.
3
A sample survey of firms from the membership lists of a representative body or industry group would achieve a slightly higher response rate. For example, the survey conducted by the ESRI on a sample of firms from the Forfás list of client companies in 1997 achieved a response rate of 51 per cent. This higher response rate in that earlier survey is attributable to the fact that the survey was being conducted for Forfás on a sample of its own client companies in contrast to a general sample of all firms with no specific link back to the commissioning body or research organisation.
2.2
Sample Design
and Response
Rates
SURVEY DESIGN AND IMPLEMENTATION 5
First, there may be systematic and differential levels of non-response as between one group of firms and another within the sample. For example, small firms in a given sector may have an above average propensity to respond. If this were the case then they would be over represented in the final sample for analysis and would consequently be contributing “too much” to the aggregate results. Accordingly, one should statistically adjust or re-weight the data to ensure that all subgroups of the population are approximately represented in the sample, in line with their representation in the overall population.
Second, the sample was selected on a disproportionate stratified basis. This meant that some size/sector strata were over-represented in the original sample so as to ensure adequate coverage in the final effective sample for analysis. This over-representation at sample selection was adjusted for in the re-weighting scheme.
In deriving the weights or adjustment factors two related but independent weighting systems were prepared. The first is based on the firm as the entity for most of the analysis. The second is based on the employee. In the latter weighting scheme each firm is regarded as a group of employees rather than as a simple entity in its own right.
To derive both sets of weights one has to establish the structure of the population from which the effective sample has been selected. The structure used in this survey was based on size and sector. A total of 8 sectors and two size categories was used. The size categories were 0-99 and 100+ employees for Traditional Manufacturing and High-tech. Manufacturing; and 0-9 and 10+ employees for the Service sector and Construction. This provides a total of 16 strata or size/sector cells in the re-weighting matrix (2 size categories by 8 sectors). Using a number of sources such as the Census of Industrial Production, the Annual Services Enquiries and the Labour Force Survey the overall structure of the population of businesses can be derived in terms of both enterprises (firms) and also employees within the 16 size/sector strata use in re-weighting. This is outlined in Table 2.2.
The classification in the table was used to re-weight the data using a standard ratio weighting technique in which each of the 1,635 responding enterprises was assigned a weight corresponding to the ratio of the population total to the sample total in the relevant cell. In other words, the weight is given as:
Wi = Pi/Si
where the i’s refer to the size/sector cells in Table 2.2. The Pi is the total number in the population of each cell and the Si refers to the number in the corresponding cell in the sample which successfully completed the questionnaire and so were included in the analysis. The Wi’s are the weights associated with each unit in the sample and it is this which ensures that the sample figures are adequately grossed to population totals.
The weights are derived using two bases, viz. the enterprise and the number of employees. The employee-based weight is used in deriving estimates of employment structures, vacancies and employment projections in Chapter 3 of this report. The enterprise-based weight is applied in deriving population estimates of the characteristics of firms in other sections.
Table 2.2: Structure of Population of Enterprises as Derived from Census of Industrial Production, Various Annual Services Enquiries and the Labour Force Survey Size/Sector/Stratum No. of Enterprises
(000s)
Nos. Engaged (000s)
NACE Sectors Covered
Traditional Manuf- 0-99 employees acturing: 100+ employees
2.4 0.3
58.0 77.0
10; 11; 12; 13; 14; 15; 16; 17; 18; 19;20; 21; 22; 36; 37; 40 ;41 Hi-Tech. Manuf- 0-99 employees
acturing: 100+ employees
2.1 0.3
56.0 119.0
23; 24; 25; 26; 27; 28; 29; 30; 31; 32; 33; 34; 35
Construction: 0-9 employees 10+ employees
12.0 2.0
68.8 66.3
45
Wholesale/Retail: 0-9 employees 10+ employees
29.5 4.2
99.0 134.0
50; 51; 52
Property/Renting/ 0-9 employees Business Services: 10+ employees
14.6 1.6
38.0 57.8
70; 71; 73; 74
Finance/Insurance/ 0-9 employees Banking: 10+ employees
2.3 0.5
10.9 54.4
65; 66; 67
Computer Services: 0-9 employees 10+ employees
1.5 0.3
3.3 26.5
72
Transport/Personal/ 0-9 employees Other Services 10+ employees
20.9 4.2
58.7 253.8
55; 60; 61; 62; 63; 64; 74; 80; 91; 92; 93
Total above 1181.5
Agriculture 127.0
Non-Agric. Self Employment 148.0 Public Admin/Defence/Education 289.0 Total in Employment 1,745.5
T
he survey was implemented on a so-called mixed mode postal/telephone basis. This involved initially sending the questionnaire to the respondent in the post, followed by a postal reminder two weeks later. There then followed an extended period of very intensive phone follow-up in which all respondents were repeatedly contacted by phone with a view to securing a completed questionnaire or other definitive outcome. This phase of the fieldwork involved posting and faxing questionnaires on request. Interviews were completed from December 2001 through March 2002.When completed surveys were returned to the ESRI each was immediately inspected and checked to ensure completeness and also internal consistency of the data provided. By this latter means, the figures on total employment, for example, were reconciled with the sum of total employment by occupational grade.
7
3. E
MPLOYMENT
L
EVELS AND
T
RENDS
I
n this chapter we consider three aspects of trends in employment levels and structures. First we discuss changes in employment levels by broad sector in recent years. Second, we consider the structure of employment by sector and by detailed occupational grade within sector, along with changes therein between the 1998/99, 1999/00 and 2001/02 rounds of the survey. Third, we outline employment projections over 2002 by sector and occupational grade. Finally, we present a summary of the main trends identified in the chapter. [image:24.595.183.526.459.670.2]A
s noted in Chapter 1, the Irish labour market has undergone very substantial change in recent years. The figures in Table 3.1 outline general trends in employment levels at the end of 1999 and the beginning of 2002. The levels during the first quarter of 2002 are taken as representative of the size and structure of the labour market when fieldwork for the 2001/02 survey was undertaken. These figures relate to the population of non-agricultural private sector employees at that time.Table 3.1: General Trends in Employment Levels Q.4
1999
Q.1 2002
Absolute Change
Per Cent Change (000s) (000s) (000s) %
Traditional Manufacturing 140 135 -5 -3.6 Hi-Tech. Manufacturing 179 175 -4 -2.2 Wholesale/Retail 228 233 5 2.2 Finance/Insurance/Business
Services 168 191 23
13.7 Construction 112 135 23 20.5 Transport/Personal/Other Services 314 312 -2 -0.6
Sub-total 1,141 1,181 40 3.5 Non-Commercial Public Sector 239 289 50 20.9 Agricultural 140 127 -13 -9.3 Self-Employed with No Employees 127 148 21 16.5
Total 1,647 1,745 98 5.9
Source:QNHS, Q4 99 release of 7 March 2000 and Q1 02 release of 30 May 2002; relevant CIP; Census of Services; special runs by CSO from CIP and QNHS.
One can see that the total number of persons in employment at the end of 2001 and the beginning of 2002 was 1,745,000. Of these, a total of 289,000 were in the Non-Commercial Public Sector, a further 127,000 were in agriculture while a further 148,000 were in employment in their own right with no employees. This group includes a mixture of all trades and
professions. The exclusion of these three categories leaves us with a total of 1,181,000 persons which represent the non-agricultural private sector workforce to which all figures in the report have been grossed.4
The figures in Table 3.1 illustrate the continuing growth in the size of the Irish labour market over recent years. In the two years from 1999/00 to 2001/02 the total number of persons at work grew by 40,000 (3.5 per cent). This came in the wake of very rapid growth in the number at work between the 1998/99 and 1999/00 surveys. In the 1998/99 survey the target population for the study was 1,053,000 persons whereas for the current survey it was 1,181,000 persons. Within our target population the strongest growth rates were experienced in the Construction Sector (20 per cent) followed by Finance/Insurance/Business Services (14 per cent). Employment fell in three of the target sectors with Traditional Manufacturing down by about 4 per cent, Hi-Tech. Manufacturing down by 2 per cent, and Transport/ Personal/Other services down by about half a per cent.
T
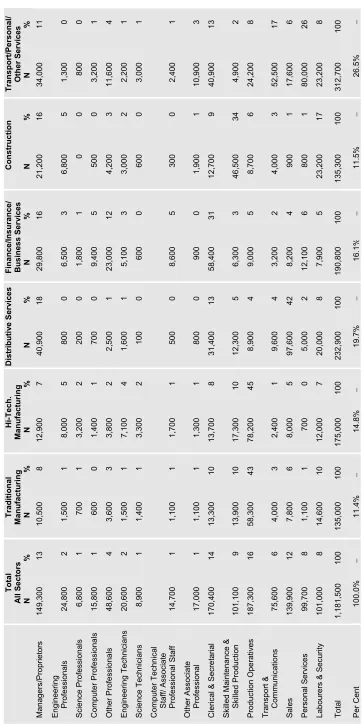
able 3.2 provides details on the breakdown into occupational grades of current employment in the relevant private sector categories as recorded in the survey. The figures in the table are based on the detailed breakdown of persons engaged as recorded by respondents to the survey. Respondents were presented with a total of 17 different pre-defined grades. This grading structure reflects different levels of skill and managerial content. It ranges from a number of professional grades such as Managers/Proprietors, through Engineering Professions, Science Professionals etc. to Associate Professional/Technical grades. Intermediate skill levels are reflected in grades such as Clerical/Secretarial, Skilled Maintenance/Skilled Production, Production Operatives, Sales Personnel through to Unskilled Labourers. A set of examples of the various jobs included in each of the grades was included on the questionnaire as an aid to the respondent when breaking down his/her workforce. Although the classification system presented to respondents appears to have worked well there is, understandably, a subjective element in the assignment of workers by the respondent to the categories in question.The figures in Table 3.2 allow one to consider the structure of employment according to sector as well as by detailed occupation grade within sector. We first consider the sectoral distribution of employment before moving on to discuss the distribution of occupational grades.
3.2.1
EMPLOYMENT STRUCTURE ACCORDING TO SECTOR2001/2002
The bottom row in Table 3.2 presents details on the percentage breakdown of relevant private sector employment according to broad industrial sector. From this one can see that a total of 26 per cent is involved in Manufacturing: 11 per cent in Traditional Manufacturing and 15 per cent in Hi-Tech. Manufacturing. Distributive Services account for 20 per cent of the relevant labour force, 16 per cent are accounted for by the Finance/Insurance/ Business Services sector, 11 per cent by Construction and 26 per cent by Transport/Personal/Other Services.
4
In reconciling the figures in Table 3.1 with those published in, for example, the QNHS one should take account of some Public Sector employment and self employment with no employees in several sectors. For example, the QNHS Q1 2002 figure for the Construction sector is 186,000. From special data rounds prepared by the CSO we estimate that 51,000 of these are employed in the Public Sector or in their own right with no employees. This leaves a total of 135,000 relevant workers in the sector.
Table 3.2: Brea
kdo
w
n
of Current Employ
ees b
y Occupational Grade
Total A ll Se ctor s Traditi onal Manuf act uring Hi-Tec h. Manuf act uring Distrib uti ve S erv ices Fina nce/Ins u ranc e/ Busin ess Ser vi ces Cons truc tio n Trans port/Perso nal / Ot her Ser vices N % N % N % N % N % N % N % Managers/Pro prietors 149,300 13 10,500 8 12,900 7 40,900 18 29,800 16 21,200 16 34,000 11 Engineering Professionals 24,800 2 1,500 1 8,000 5 800 0 6,500 3 6,800 5 1,300 0 Science Professionals 6,800 1 700 1 3,200 2 200 0 1,800 1 0 0 800 0 Computer P rofessionals 15,800 1 600 0 1,400 1 700 0 9,400 5 500 0 3,200 1 Other P rofessionals 48,600 4 3,600 3 3,800 2 2,500 1 23,000 12 4,200 3 11,600 4 Engineering Technicians 20,600 2 1,500 1 7,100 4 1,600 1 5,100 3 3,000 2 2,200 1 Science Technicians 8,900 1 1,400 1 3,300 2 100 0 600 0 600 0 3,000 1 Computer Technical
Staff/ Associate Professional Staff
14,700 1 1,100 1 1,700 1 500 0 8,600 5 300 0 2,400 1 Other Associate Professional 17,000 1 1,100 1 1,300 1 800 0 900 0 1,900 1 10,900 3
Clerical & Secretarial
170,400 14 13,300 10 13,700 8 31,400 13 58,400 31 12,700 9 40,900 13
Skilled Maintenance &
Skilled Production 101,100 9 13,900 10 17,300 10 12,300 5 6,300 3 46,500 34 4,900 2 Production Ope ratives 187,300 16 58,300 43 78,200 45 8,900 4 9,000 5 8,700 6 24,200 8 Transpo rt & Communications 75,600 6 4,000 3 2,400 1 9,600 4 3,200 2 4,000 3 52,500 17 Sales 139,900 12 7,800 6 8,000 5 97,600 42 8,200 4 900 1 17,600 6 Personal Services 99,700 8 1,100 1 700 0 5,000 2 12,100 6 800 1 80,000 26 Laboure
rs & Securit
3.2.2
EMPLOYMENT STRUCTURE ACCORDING TO GRADE WITHIN SECTORThe figures in the first column of Table 3.2 provide details on the total number of persons engaged in each grade as well as the relevant percentage breakdown. From this one can see, for example, that a total of 149,300 persons are engaged as Managers/Proprietors. This represents a total of 13 per cent of all relevant employment. Other major employment categories include: Clerical & Secretarial (14 per cent), Skilled Maintenance & Skilled Production (9 per cent), Production Operatives (16 per cent), Sales (12 per cent), Personal Services and Labourers & Security (both 8 per cent).
A total of 21 per cent of persons are engaged in professional grades (Managers/Proprietors to Other Professionals) while a further 5 per cent are classified in Associate Professional/Technical levels (Engineering Technicians to Other Associate Professionals).
The remainder of the table provides a comparable breakdown for each of the relevant sectors. (A more detailed breakdown by broad size category and sector is provided in Appendix Table A3.2).
Traditional Manufacturing
The largest grade in Traditional Manufacturing is Production Operatives (accounting for 43 per cent of persons engaged). This is followed by the Labourers & Security category (11 per cent). Three groups each represent 8-10 per cent of persons engaged, viz. Managers/Proprietors, Clerical & Secretarial, Skilled Maintenance & Skilled Production.
From the detail of Appendix Table A3.2 one can see that Production Operatives are relatively more important for the larger firms in this sector (50 per cent in firms employing 100 or more persons compared with 34 per cent in their smaller counterparts). In contrast, Managers/Proprietors and Clerical/Secretarial grades are relatively more important in the smaller than larger enterprises in the sector.
Hi-Tech. Manufacturing
The figures in Table 3.2 show that the Production Operative grades are of slightly greater relative importance for the Hi-Tech. sector than Traditional Manufacturing. Production Operatives account for 45 per cent of the Hi-Tech. sector compared with 43 per cent for their counterparts in Traditional Manufacturing, while Skilled Maintenance/Skilled Production grades account for the same percentage, 10, of persons engaged in the Hi-Tech. sector as in the Traditional sector.
One can further see from the detail of Appendix Table A3.2 that the Skilled Maintenance & Skilled Production grades are substantially more important to smaller firms in the Hi-Tech. sector at the apparent expense of the Production Operative category. For example, among businesses in the smaller Hi-Tech. sector Skilled Maintenance & Skilled Production account for 16 per cent of persons engaged while Production Operatives account for 34 per cent. Comparable figures for the larger Hi-Tech. sector are 7 per cent and 50 per cent respectively.
Distributive Services
EMPLOYMENT LEVELS AND TRENDS 11
From the detail of Appendix Table A3.2 one can see that, in general, the same broad trends are apparent in terms of the occupational structure of large and small businesses in the sector. Managers/Proprietors assume a greater relative importance in smaller enterprises (29 per cent in the 1-9 persons category compared with 9 per cent in the 10 or more person group). In contrast, the Production Operative grade accounts for a recorded 5 per cent of those engaged in larger businesses in the sector compared with 2 per cent among smaller enterprises.
Finance/Insurance/Business Services
The figures in Table 3.2 indicate the relative importance of Clerical/Secretarial grades to this category (31 per cent of all persons engaged). Manager/ Proprietors account for 16 per cent of persons while “Other Professionals” account for 12 per cent of persons.
The detail of Appendix Table A3.2 shows that Managers/Proprietors are relatively twice as important in the smaller than the larger firms in this sector. These respectively account for 24 per cent and 12 per cent of persons engaged. The Clerical/Secretarial grade is relatively more important for larger firms in the sector. This grade accounts for 32 per cent of persons engaged among larger firms in the sector compared with 28 per cent among smaller ones.
Construction
A total of 34 per cent of persons engaged in this sector are classified in the Skilled Maintenance/Skilled Production category with a further 17 per cent being recorded as Labourers & Security. Managers/Proprietors account for 16 per cent.
As one would expect, the detail of Appendix Table A3.2 shows that the Managers/Proprietors grade is relatively more important for the smaller firms in the sector, representing some 24 per cent of those engaged compared with only 7 per cent among their larger counterparts. As a corollary to this the relative percentage of the Labourer & Security category is lower in the smaller firms (13 per cent compared with 20 per cent among larger businesses) in the sector.
Transport/Personal/Other Services
The importance of the Personal Services grades to this sector is underlined by the figures in Table 3.2 with this grade accounting for 26 per cent of all persons engaged. This is followed by Transport & Communications (17 per cent), Clerical & Secretarial (13 per cent) and Managers/Proprietors (11 per cent).
T
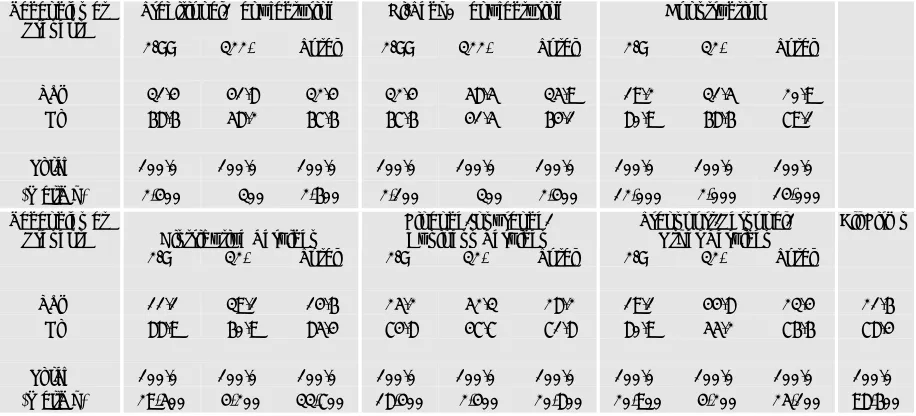
able 3.3 provides details of a comparison between the employment structure of relevant private sector firms as reflected in the 1998/99, 1999/00 and 2001/02 surveys. The left hand column in the table shows that, in aggregate, there is very limited evidence to suggest any systematic change in the structure of employment by occupational grade. This is, of course, entirely as one might expect, given the relatively short period between the three surveys in question. Such differences as exist at the aggregate level between the three surveys are very small indeed.In general, the same level of constancy in employment structures is evident for each of the individual sectors in turn. In the Traditional Manufacturing sector there would appear to have been a reduction in the Production Operative grade with a fall from 50 per cent in 1998/99 to 45 per cent in 1999/00 and to 43 per cent in 2001/02.
The Hi-Tech. Manufacturing sector showed some change over the period in question. Engineering Professionals and Engineering Technicians both increased their share of employment by 2 and 1 percentage points respectively and the share of the Skilled Maintenance & Skilled Production category fell from 16 per cent in 1998/99 to 10 per cent in 2001/02. The Distributive Services sector showed an increase in the relative importance of Sales Personnel (37 per cent in 1998/99, 41 per cent in 1998/1999 and 42 per cent in 2001/02).
The Finance/Insurance/Business Services sector appears to have experienced a reasonably substantial fall in the relative importance of the Personal Services grade from 9 per cent in 1998/99 to 2 per cent in 1999/00 but the share recovered to 6 per cent in 2001/02. This sector showed a decrease in the relative importance of the Clerical and Secretarial category from 36 per cent in 1998/99 to 35 per cent in 1999/00 and to 31 per cent in 2001/02
The Construction sector showed a reasonable level of stability in terms of occupational structure. The main changes in the sector were an increase of 4 percentage points in the relative importance of the Clerical and Secretarial category and a fall of 6 percentage points in the Skilled Maintenance & Skilled Production category.
Finally, the Transport/Personal/Other Services category also showed stability in its occupational structure with only a slight fall of 3 percentage points in Clerical & Secretarial grades and an increase of 5 percentage points in the Production Operatives category.
Overall the changes in the occupational structure of private sector employment over the three surveys in question have been rather small.
I
n the course of the survey respondents were asked to record an estimate of their projected employment level in one year’s time (i.e. employment as it would relate to early 2003). From this information one can derive one-year employment projections according to grade and sector. In interpreting the figures the reader must remember that the figures are based on the respondents’ perceptions of likely future trends in employment outturns. These will reflect his/her views and expectations of trends in the general economy and also trends within their sector within the broader economy. The estimated future employment figures are likely to be based on past trends in respondents’ markets and, as a consequence of the recent slow down in employment growth, they may be based on a pessimistic view of the firms’ niche in its market.3.3
Changes in
Employment
Structures
1998/1999 to
2001/2002
Table 3.3: Comparison of Employ m ent Structure s by Grade, 1 998/ 99, 199 9/20
00 and 20
01/0 2 Percenta ge Brea kdo w
n of Person
These factors may result in an under estimate of the level of total employment in one year’s time. The relevance of the figures, however, is that they do provide a clear and unambiguous signal of firms’ expectations about future short-term trends in employment over the coming twelve months. Consequently, they provide an important indication of the general scale and nature of expected employment growth by occupational grade and sector.
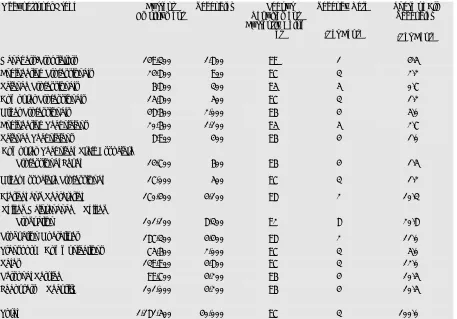
Table 3.4 provides a breakdown of employment projections by occupational grade for one year’s time as recorded in the 2001/02 survey. The figures show that in aggregate terms across all grades, sector and size categories employers are forecasting a further growth in employment of around 1.0 per cent over 2002 to 2003. This would represent an employment growth of about 12,000 jobs in the private non-agricultural sector over the twelve months in question. In the Spring of 2002, shortly after the survey was taken, the ESRI forecast for non-agricultural employment growth between 2002 and 2003 was 2 per cent but this was reduced to 1.8 per cent in the Summer 2002 Quarterly Economic Commentary.5
Although it is somewhat more pessimistic the employers’ employment forecast for the year following the survey is, therefore, broadly in line with the ESRI forecast.
The detail of Table 3.4 shows that the greatest percentage growth is forecast among the Skilled Maintenance & Skilled Production category (7 per cent); followed by Other Professionals (5 per cent), Computer Professionals and Sales (both 3 per cent). Categories in which employment is projected to decline are: Science Technicians (down 4 per cent), Personal Services (down 10 per cent), and Labourers & Security (down 1 per cent).
In terms of absolute growth levels the firms project the largest growth in numbers of employees among Skilled Maintenance/Production workers (7,600) followed by Sales (4,800), Transport & Communications (3,000) and Other Professionals (2,600). The largest losses in absolute terms are expected to occur in Personal Services (a decrease of nearly 10,000) and Labourers & Security ( a fall of 1,000).
5
Table 8, Quarterly Economic Commentary, Spring 2002 and Summer 2002, Dublin: The
[image:31.595.57.526.478.708.2]Economic and Social Research Institute.
Table 3.4: Employment Projections by Occupational Grade for Twelve Month Period, 2002 to 2003 All Sizes All Sizes Current Projected Change
%
Change Current Projected Change % Change
Managers/Proprietors 149,300 150,800 1,500 1.0 Clerical and Secretarial 170,400 171,800 1,400 0.8 Engineering
Professionals 24,800 25,300 500 2.0
Skilled Maintenance/
Production 101,100 108,700 7,600 7.5 Science
Professionals 6,800 6,900 100 1.5 Production Operatives 187,300 187,600 300 0.2 Computer
Professionals 15,800 16,300 500 3.2 Transport & Comm. 75,600 78,600 3,000 4.0 Other Professionals 48,600 51,200 2,600 5.3 Sales 139,900 144,700 4,800 3.4 Engineering
Technicians 20,600 21,500 900 4.4
Science Technicians 8,900 8,500 -400 -4.5 Personal Services 99,700 89,800 -9,900 -9.9 Computer
Technical/Associate
Professional Level 14,700 14,700 0 0 Labourers & Security 101,000 100,000 -1,000 -1.0 Other Associate
EMPLOYMENT LEVELS AND TRENDS 15
Table 3.5 outlines projected growth levels by broad sector. Growth is projected for four sectors and decline for the remaining two. Highest growth is forecast in the Finance/Insurance/Business Services sector: 6 per cent or 10,000 employees. This is followed by Distributive Services with growth of around 3 per cent or 6,000 employees and by Construction with growth of about 1 per cent or 1,200 employees. The Transport/Personal/Other Services sector is projected to lose over 5,000 jobs while Traditional Manufacturing is expected to lose 1,300 jobs.
Table 3.5: Summary Employment Projections by Broad Sector 2002 to 2003 Sector Current Project Absolute ChangeProjected Projected %Change
Traditional Manufacturing 135,000 133,700 -1,300 -1.0 Hi-Tech. Manufacturing 175,000 175,800 800 0.4 Distributive Services 233,000 239,000 6,000 2.6 Finance/Insurance/
Business Services 190,900 201,300 10,400 5.5 Construction 135,100 136,300 1,200 0.9 Transport/Personal/Other
Services 312,500 307,300 -5,200 -1.7 Total 1,141,000 1,251,900 110,900 1.0
Table 3.6 and Appendix Table A3.6 present details on employment projections classified by grade within size/sector category. The main points to emerge from these tables are as follows:
Traditional Manufacturing
Growth projections in this sector are 3 per cent among smaller firms compared with -4 per cent among their larger counterparts giving an overall employment forecast of minus 1 per cent or a loss of 1,300 jobs. Table 3.6 shows that the largest absolute loss in terms of numbers of persons engaged is in the Production Operative grade – 1,800 workers representing an overall 3 per cent loss in this category. Although a high growth forecast of 10 per cent is returned for Computer Professionals in this sector, the absolute numbers involved are small – only of the order of 100 persons.
Hi-Tech. Manufacturing
Employment growth in this sector is forecast at less than 0.5 per cent. Highest growth levels are for Engineering Professionals (300 persons or 3 per cent), Engineering Technicians (300 or 4 per cent), Science Professionals (200 or 6 per cent), Engineering Technicians (300 or 4 per cent) and Sales (200 or 3 per cent).
Employment in smaller firms in the sector is forecast to grow by 2 per cent or 1,100 persons. This compares with a projected decline in employment in larger firms of 400 persons.
Construction
Firms in this sector return a very modest growth forecast of around 1 per cent over the period 2002 to 2003. This represents a growth of about 1,200 persons.
decrease of 2,600 or 64 per cent), Labourers & Security (a fall of 1,300 or 6 per cent) and Clerical & Secretarial (a decline of 1,000 or 8 per cent).
Distributive Services
This sector returned a growth forecast of 3 per cent for the period 2002 to 2003, representing some 6,000 persons. Largest growth levels are forecast among Sales persons (2,300 persons or 2 per cent). This is followed by Skilled Maintenance/Production workers (900 or 7 per cent).
Growth among smaller firms in the sector is running very much ahead of larger ones (7 per cent compared with 0 per cent respectively).
Finance/Insurance/Business Services
Overall growth in this sector is forecast at 5 per cent or 10,400 persons. The highest forecasted growth rates, about 25 per cent, are for the Science Technician and Other Associate Professional grades but the actual number of jobs projected is only around 200 in each case. Although the projected growth rates are smaller much larger numbers of jobs are projected for Other Professionals (2,100), Clerical and Secretarial (2,600), Skilled Maintenance/ Production and Sales (1,000 in each case), and Personal Services (1,200).
Transport/Personal/Other Services
Table 3.6 indicates that aggregate growth forecasts in this sector are of the order of minus 2 per cent. Employment is projected to decline by 3 per cent in larger firms and to increase by 4 per cent in smaller firms. As the bulk of employment is in larger firms these different growth trends result in an overall projected loss in employment of 5,200 jobs in the sector.
The largest job losses are expected to be in the Personal Services category with nearly 10,000 less workers likely to be employed in 2003 than in 2002. Job losses are projected for all categories except Managers/Proprietors, Other Professionals, Other Associate Professionals, Production Operatives, Transport & Communications, and Sales.
I
n this chapter we have examined trends in the structure of employment between the end of 1999/00 and the first quarter of 2002. We saw from the Central Statistics Office figures that the number of persons in employment grow from 1,647,000 in 1999/00 to 1,745,000 in 2001/02. This represented a total employment growth of 98,000 persons (6 per cent) over the period in question. These figures include three main exclusions to the figures contained in this report. First, the agricultural sector; second, the Non-Commercial Public Sector and, third, those employed in their own right. When these exclusions are made we estimate from CSO figures that employment in the private sectors relevant to this report grew from 1,141,000 in 1999/00 to 1,181,000 in 2001/02. This gives a growth level of 40,000 persons (4 per cent) according to CSO figures from the Quarterly National Household Survey (QNHS). These give us the employment figures to which the report is grossed throughout.In Section 3.2 we saw that Manufacturing accounted for approximately 26 per cent of the target employment group covered by this report. Distributive services account for a further 20 per cent; Finance/Insurance/Business Services account for 16 per cent; Construction for 11 per cent; and Transport/ Personal/Other Services for 27 per cent.