1
Measuring the potential emission reductions from a shift towards public transportPáraic Carrolla, Brian Caulfielda, Aoife Ahernb
aDepartment of Civil, Structural and Environmental Engineering, Trinity College Dublin, Dublin 2, Ireland
bSchool of Civil Engineering, Newstead Building, University College Dublin, Dublin 4, Ireland
Abstract
The research presented in this paper investigates the behavioural response and subsequent appraisal of a range of policy incentives devised to encourage greater use of sustainable travel options within the Greater Dublin Area (GDA). Interventions were assessed by employing four-stage modelling techniques, as a tool to identify signs of mode shifting behaviour from single occupancy vehicle (SOV) use to public transport modes. Extensive modelling work was conducted in collaboration with the National Transport Authority (NTA) of Ireland utilising the National Regional Modelling System (RMS) to represent the sustainable policy changes. Parameter modifications in the mode and destination choice and trip assignment stages were made to account for improvements made to frequency, time and cost attributes of public transport modes included in the model. Subsequent changes in vehicle kilometres travelled of various modes modelled were then utilised to estimate the potential emissions savings. In addition to this, the potential monetary savings generated from a reduction in emissions were calculated. The key results produced from this study found that an increase in the mode share of public transport of up to 2.87% could be achieved in the GDA. Up to 1.76% of which was estimated to come directly from private car trips, as a result of implementing the policy incentives tested. Furthermore, daily emissions savings of up to 431.58 tonnes of CO2, 0.95 tonnes of NOx, and 0.046 tonnes of PM2.5 were also estimated.
1. Introduction
Transport is a known derived demand, which responds accordingly to varying economic conditions. Strong post-recession economic growth in Ireland, principally influenced by growth in employment, in recent years has been found to be having an adverse effect on efforts to reduce greenhouse gas emissions. The consequence of which is that Ireland will most certainly fail to meet its 2020 emissions reduction targets (EPA, 2018; CCAC, 2018). Based on evidence compiled by the Environmental Protection Agency of Ireland (EPA), total forecasted emissions are, in fact, estimated to increase by 1% and 4% by 2020 and 2030 respectively, from current records (EPA, 2018). On a European level, according to Eurostat figures, Ireland had the fourth highest levels of CO2 equivalent emissions per capita in the European Union in 2016, with a recorded output of 13.5 tonnes, only following Luxembourg, Iceland and Estonia (Eurostat, 2016; CSO, 2017). The transport sector was directly responsible for 19.5% of these emissions in 2016, which is projected to rise to 22.9% in 2020 and 23.6% in 2030 (EPA, 2018). Transport related emissions alone have increased by 4.1% from 1990 levels, representing an increase of 0.48 Megatons (Mt) of CO2 equivalent. An increase in the use of diesel fuelled vehicles in the Irish private car and freight fleet has been attributed to this rise in emissions from transport, with diesel emissions rising by 8% from 1990 figures (EPA, 2016). Under a ‘business as usual’ scenario, emissions produced from the transport sector in Ireland are projected to increase by 18% (14.55 Mt CO2eq) from 2017 to 2020 and by 20% (14.75 Mt CO2eq) from 2017 to 2030 (EPA, 2018).
2
As a direct mandate to tackle rising emissions from transport and to enforce sustainable planning and development in the next twenty years, a national development plan, entitled Project Ireland 2040 was launched in 2018 by the Irish government (DPER, 2018). In this plan, several ambitious strategic investment plans, totalling €21.8 billion, were unveiled to accelerate Ireland’s transition to a low carbon and climate resilient nation. Such plans included were: to have 500,000 or more electric vehicles (EV) on Irish roads by 2030 with essential improvements planned in EV charging infrastructure to meet this demand; no new conventionally fuelled vehicles are to be sold in Ireland by 2030; a transitional strategy to a fleet of low emitting hybrid or electric buses; an overhaul of the bus public transport network, introduction of a metro/ underground project, extensions to light rail lines and electrification of heavy rail services, in addition to comprehensive improvements made to the cycling and walking networks in metropolitan areas (DPER, 2018). Project 2040 also includes a range of sustainable travel measures, designed to encourage a mode shift to alternative modes and reduce the dependency of private cars. The research included in this paper will specifically examine this latter aspect of the plan (DRER, 2018).The sustainable travel measures considered in this study are specifically in the form of policy incentives or ‘carrots’ devised to stimulate mode choice of alternatives to the private car, particularly for commuting trip purposes. Several policy incentives were tested by means of four-stage transportation modelling for their potential to stimulate a modal shift to public transport modes in the GDA, namely, bus and rail.
This paper is structured as follows: Section 2 outlines examples of empirical research which examines the use of policy incentives as a tool to attract commuters to bus and rail modes; Section 3 delineates the study area chosen for this research and the methodological approach employed for the analysis; and Section 4 presents the mode share and emission savings results produced from introducing a range of policy measures, in addition to the monetary savings achieved from reductions in greenhouse gas emissions.
2. Literature Review
2.1 Policy incentives to encourage public transport use
Literature examining policies to promote public transport usage is vast. This section details some of the studies closely linked to the work presented in this paper, which examine the use of policy tools, namely incentives, to encourage a sustainable shift from private car use to public transport modes. This literature review was conducted as means of sense-checking the policy interventions that were incorporated into this study by reviewing the success and/ or failure of other measures that were previously empirically tested. The following studies helped to identify the main attributes of interest to potential mode shifters in relation to public transport services, thus ensuring that the policy incentives devised were targeting the statistically significant trip attributes.
3
registration surcharge based on the number of kilometres driven). The remaining 6 policies consisted of a package of incentives for public transport (PT) use (i.e. improved frequency and coverage of services, lower PT fares, reduced trip times and an increase in the number of off-peak services), and cycle use (i.e. increasing cycle lane continuity). Based on the introduction of the policies tested on three varying levels, the respondents were prompted to choose one mode from 7 (continue driving, passenger in a car, carpool, walk and use PT, park and use PT, cycle or other including the option of telecommuting). The preferences from this exercise were then used in MNL models to estimate the likelihood of the mode alternatives being chosen given the presence of the policy measures. The results from this analysis determined that the walk and use PT option was the most popular alternative chosen across the three cities, which suggested that the policy incentives applied to PT were most effective in encouraging a sustainable mode shift. Of these measures, increasing PT frequency at peak times was seen as the most attractive pull factor to PT, followed by improved trip times by taking PT modes. In addition to this, it was found that the stick measures outperformed the carrots in terms of encouraging a modal shift to public transport, akin to findings from Washbrook et al. (2006), Baldassare et al. (1998), Kuppam et al. (1998) and Hunt et al. (1997). The increase in the provision of cycle lanes however, did not have a positive effect on influencing a shift from private cars to cycling, which was comparable to results produced by Mackett (2001), who found that only a 2% shift to cycling from private cars could be achieved based on improvements made to cycling infrastructure (O’Fallon et al., 2004). However, this study did not analyse the effects combining more than one of these carrots or sticks policies together, rather it determined the impact of each of the policies in isolation. This was taken into consideration when designing the experiment discussed in this paper.Ahern and Tapley (2008) performed an SP experiment to gather rail and bus passenger perceptions and mode preferences in Ireland, to ascertain what improvements could be made to attract more potential PT passengers to such services. In this study, questionnaires were distributed to passengers on-board bus and rail services travelling Dublin to Sligo, and Dublin to Galway. The first section of the survey gathered the respondent’s revealed mode choices, which were then compared with the stated preferences elicited from the second section in which respondents were tasked with making hypothetical mode choices based on varying degrees of improved trip characteristics such as: trip cost, frequency, length, service reliability and the availability of toilets. The results from the SP component of the survey were analysed by means of a MNL model that was used to generate behavioural indicators of the effect of improving certain trip attributes. The findings revealed that time and cost were the trip characteristics of highest statistical significance, based on the coefficient size preferences, which were both found to have negative signs, meaning that as expected, cheaper and quicker journeys increased the probability of such modes being chosen. Service reliability did not have as much of a bearing on mode choice than time and cost did, however it was found that respondents valued services that were punctual. This study offers empirical evidence to show that commuters rate the attributes of time and cost as their highest preference of trip characteristic, while frequency and reliability of services were found as being of lesser importance in mode choice in the Irish context. The results from this research were accordingly also considered when devising the policy incentives included in the study presented in this paper.
4
travel (Wong et al., 2018), while the availability of seats had a positive effect on the likelihood of making a trip. Other noteworthy findings from this study were that seat availability and trip cost were found to be of higher statistical significance to the elderly travelling by bus rather than by rail, which supported the extension of a bus fare concession in Hong Kong. The overall policy recommendation made by the authors was for the provision of priority seats for the elderly, a targeting of public transport concessions for those aged 60-64 and to waive fares for those aged 80 or more (Wong et al., 2018). However, in order to incorporate the full selection of public transport modes available in Hong Kong into the experiment, the authors acknowledged that an MNL model would be a more suitable tool to inspect more valuable metrics such as mode shares and the socio demographic characteristics of modal choice. In this way, more robust policy recommendations could be formulated based on the policy analytics generated from a MNL model, rather than a binary logistic model.Eriksson et al. (2010) conducted a study which investigated the potential reduction in car use in response to TDM measures in a ‘carrot’ and ‘stick’ approach in Sweden. This research tested the behavioural response of introducing pull factors to make PT modes more time and cost effective, namely, by reducing fares and increasing the frequency of services, in addition to a disincentive of increasing fuel-based taxes. The degree to which car drivers modified their car use given these TDM actions was first examined from responses collected from an attitudinal pre-questionnaire that determined the perceptions of the policies and potential intentions or motivations to reduce car use. Social or personal norms, i.e. the psychological feeling of individual responsibility to reduce car use in order to limit negative environmental impacts, were explored in this pre-questionnaire. The measures were then surveyed in greater detail in a follow-up SP questionnaire that was used to estimate the behavioural reaction to the carrot and stick measures, that were analysed in univariate ANCOVA and hierarchical regression models. The results from the ANCOVA models found that the combined measure of raised fuel taxes with reduced PT fares and increased frequency of services revealed the highest main effect, suggesting that it was most effective in reducing car use in the sample, as opposed to offering these measures on their own. The effectiveness of this approach (i.e. a joint push and pull measure package) is akin to the findings presented by O’Fallon et al. (2004) and Washbrook (2006) referred to above and Marshall and Banister (2000). The regression findings showed more in-depth details of the socio-demographic profile of respondents who were willing to reduce their car use in response to the policies examined. The results from this model found that the number of cars owned was the greatest determinant of behavioural response to the PT incentives, in other words, respondents who owned fewer cars were more likely to use PT given cheaper fares and a more frequent service. Personal norms were similarly shown to be statistically significant factors (at 95%) and increased the likelihood of respondents reducing their car use from the introduction of the combined tax and PT measure. Overall, this study identified that levels of car ownership and social psychological factors such as personal norms have a statistically significant effect on the extent to which individuals may respond to push and pull measures to limit car usage and increase the numbers of people travelling sustainably. Furthermore, Eriksson et al. (2010) similarly support the notion that packages of policy measures give rise to more concrete behavioural change than isolated policy instruments introduced alone, however they accept more empirical work is required to assess the effectiveness of different combinations of policies.
5
and job destinations, to determine the effect of transport provision, land-use and trip cost on accessibility to job opportunities in different locations. A baseline (2011) scenario and alternative (2015) scenario were then created utilising the generalised costs of commuting by public transport in the model, in addition to job locations and cost-sensitive parameters for the baseline (Guzman and Oviedo, 2018). These scenarios were modelled using VISUM (micro simulation) modelling software, to explore the differences in accessibility between the two years. The results produced from this study found that for low-income households that have long trip times to access their place of employment, a relief in trip cost can lead to an effective increase in potential accessibility to job locations. An overall improvement in the accessibility level of lower earning households to jobs in the urban periphery was recognised on the basis of social spatial equity and highlights the importance of providing tangible policy incentives in order to encourage usage of sustainable modal choice. This study similarly draws attention to the sensitivity of commuters to the cost (fare) of public transport trips, and it demonstrates that a reduction in public transport fares can act as a valuable policy incentive leading to an increase or shift in the number of trips taken by public transport modes, in addition to addressing sensitive issues of accessibility for low-income households.Enoch and Potter (2003) examined the use of local government incentives in the UK, to encourage employee up-take of sustainable ‘travel plans’, that seek to make it more convenient for individuals to commute by alternative modes of transport to their workplace, rather than in single occupancy vehicles. Case studies where travel plan incentives were found to be successful in reducing car usage were similarly drawn upon in this study. A number of benefit mechanisms available to employers, in order to attract their employees to get involved in employee travel plans, were suggested such as: information and exhortation, regulation, subsidies and fiscal measures. Information and exhortation addresses the misconception that travel plans are costly to introduce and result in no real benefits to the company. It emphasises that travel plans and mobility management can result in cost savings from reducing the need to securely monitor and maintain car parks, improve employee productivity and the public image of businesses/ organisations, as well as addressing issues of corporate social responsibility (CSR) by tackling emissions targets (Enoch, 2012). Regulation considers that local authorities in the UK include travel plans in their planning policy and ensure that sites of employment, retail and recreation provide evidence of a developed travel plan for the site. Public subsidies were similarly cited as an effective means of financial assistance to develop travel plans, with lessons drawn from examples in Italy, Canada and the USA. In these case studies, subsidies are designed in the form of discounts for PT or travel passes to entice employees to commute by PT modes, thus making these modes more cost competitive and attractive versus the private car.
Fujii and Kitamura (2003) also offer evidence of implementing the travel demand management approach through a soft policy investigation, whereby PT concessions in the form of free bus passes were given to a sample of car drivers for one month. This tactic was adopted to test the effectiveness of offering a clear and direct incentive to commuters, in order to unsettle the car-use habit and substitute it with a bus-use habit (Carroll et al., 2017; Garling and Axhausen, 2003). The results of this study found that car drivers’ attitudes were immediately enhanced as they viewed bus travel in more positive light, in other words, it shifted the negative perception of public transport. This was represented in a continued increase in the frequency of bus use in the months following the period when the free bus pass was offered (Fuijii and Kitamura, 2003).
6
Transport, 2015). While research has been conducted in this area in Ireland, such as Alam et al. (2018), Farrell et al. (2010), Caulfield (2009), Legge and Scott (2009), more work is needed to fully understand the direct behavioural effects of changes in modal shares, on environmental outcomes such as emissions savings. In addition to this, the monetary savings associated with emissions reductions in gases such as CO2, NOx and PM2.5 have been rarely explored in the literature pertaining to this topic. The research examined in this paper seeks to add to the knowledge base of transport policy, particularly as it offers empirical evidence of the extent to which policy incentives alone may encourage a sustainable mode shift away from single occupancy vehicles to public transport modes, without applying penalties such as taxes or charges for private car users.3. Methods
The predominant objective of this study was to test the effectiveness of improvements made to the level of service of public transport modes in the Greater Dublin Area. The potential success of incentives that impact on the frequency, time and cost of services was determined by changes in trip making behaviour and mode shares, which are primary outputs generated from traditional four stage transport modelling tools (FSM). FSMs are useful instruments that are often employed to forecast the potential effects of changes made in transport policy, particularly policies which have a temporal and/ or monetary bearing of choice making behaviour, such as mode choice. In this way FSMs are popular and valuable policy appraisal tools to ultimately aid the decision-making process of policy makers. Section 3 will set out the study area considered for this research, an examination of the structure of the model used in this study and the policies represented and tested in it, followed by a delineation of the methodology employed to estimate the emissions changes from implementing the policy incentives.
3.1 Study Area
The GDA was chosen as the study area for this research, which includes the counties situated in the east part of Ireland i.e. Dublin, Meath, Kildare and Wicklow. In 2017, the population of the GDA was documented as 1,907,332 (CSO, 2017), which accounted for 40.05% of the total population of Ireland (4,761,865). There is a greater assortment of alternate and sustainable transport options available in this region relative to the rest of Ireland, which consequently presented itself as being the most appropriate study area for this research in Ireland. In other words, in order for there to be realistically viable alternatives to the private car, there must be options that are time and cost competitive to the car. In the GDA there exists an extensive network of cycle lanes (500km in 2013, which is planned to increase to 1,485km by 2021) of varying levels of service or ‘cycle friendliness’, in addition to a heavy rail service (DART1), a light rail tram service (Luas2), several bus operators, stationed and station-less bike-sharing schemes, and finally, car-sharing and carpooling services. However, it is acknowledged that while the GDA was determined as the optimal study area in Ireland for this research, it was also considered that this study could conceivably be replicated elsewhere in Ireland or internationally given sufficient alternatives to private car travel. Finally, the GDA was determined as the best candidate as it has the most advanced four stage model developed for it and in the way the research could test various scenarios with this model.
An increase in the numbers of people travelling using sustainable forms of transport in the GDA has been documented in the past decade (Transport for Ireland, 2017; NTA, 2016; Caulfield, 2014). With the numbers of people commuting to work returning to re-recession
7
levels between 2011 and 2016, there was an increase of 40,000 commuters (1.13 million in 2011 to 1.17 million in 2016) (CSO, 2017). The 2016 Census results recorded an increase of 15% in those commuting by bus and rail modes in the GDA during the same period, which represented an increase of 9,264 (CSO, 2017; Carroll et al., 2017). In Dublin City alone, an annual morning cordon count (07:00 to 10:00) logged an increase of 157% in the numbers cycling, a 45% increase in walking, while there was a notable 14.5% decrease in car numbers, and 2.5% decrease in bus numbers between 2006 and 2017 (NTA, 2018). This represented 7,608 more people crossing the cordon by bicycle, 7,822 more pedestrians, 8,506 fewer cars and 43 fewer buses. Conversely, in the other GDA counties (i.e. Meath, Kildare and Wicklow) there was found to be an increase of 34,422 in those commuting by car to work between 206 and 2016 (CSO, 2017).3.2 Four stage modelling approach
The analysis of trip making behaviour and appraisal of policy incentives explored in this study was conducted by employing a four-stage model (i.e. Trip Generation, Trip Distribution, Mode Choice and Trip Assignment), which models the Eastern Region of Ireland (inclusive of the GDA). The main attributes of this Eastern Regional Model (ERM) are: that it provides comprehensive coverage and an in-depth depiction of the road, public transport and active modes networks and has the capability to estimate all-day demand and travel behaviour for the modes in these networks. The model also considers four main journey purposes (employer business travel, commuting trips, education trips, other), four time periods (AM Peak: 07:00 – 10:00, Lunch Time/ Inter-Peak 1: 10:00 – 13:00, School Run/ Inter-Peak 2: 13:00 – 16:00, PM Peak: 16:00 – 19:00), and finally it can ‘predict change in trip destination and mode choice through changes to traffic conditions, transport provision and/ or policy’ (NTA, 2017).
In the context of this study, the mode and destination choice and PT assignment stages of the model are specifically of interest as it is in these stages that the policy appraisal was conducted, by means of coded parameter modifications. The structure of the choice model is a hierarchical, multinomial logit (MNL) model, where the destination and mode choice functions are carried out sequentially. Depending on the trip purpose the hierarchy can be destination choice followed by mode or mode followed by destination. The multinomial logit component is implemented to calculate the proportion of trips making a choice, of which the function compares the generalised cost of travel by different options, including all perceived and actual costs such as: journey times, vehicle operating costs, tolls, public transport fares, in addition to boarding/ transfer penalties. The mode choice utility equation, which is a function of the generalised cost (the weighted sum of the costs of taking that mode) is calculated as follows:
Equation 1 𝑉!" =𝛼𝑈!"+𝛽ln 𝑈!" +𝐴𝑆𝐶!
where:
Vij is the deterministic component of utility 𝑈!" =!
!𝑙𝑛 𝑒 !"!"#
!∈! is the generalised cost
ASCm is the alternative specific constant α, β are the estimated parameters (NTA, 2017)
8
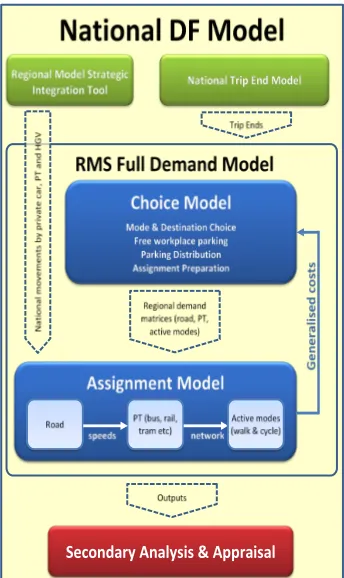
estimated, as a result of policy changes or new transport plans being introduced, the associated parameter changes must first be made at the assignment stage before the generalised costs can then be passed back to the choice model to produce new mode choice estimates. This process is iterative until convergence is achieved. The public transport assignment model runs in a CUBE Voyager3 module through a two-step process to allot trips to their respective routes. The first step (enumeration) calculates all reasonable routes between zone O-D pairs in addition to the probabilities of certain routes being chosen. The second step (evaluation) uses choice models to allocate trips to these routes based on the ‘probabilities of use’, considering crowding and fares (NTA, 2017). Figure 1 sets out the structure of the four stage model within the regional modelling system, whereby the trip ends produced from the trip generation and distribution stages are passed onto the Full Demand Model, where mode choice and trip assignment take place.There are two defined scenarios considered in this study: a Base 2012 scenario, which is based upon the results from the 2011 Census of Ireland; and a 2035 forecast scenario, which is the National Transport Authority’s (NTA) Transport Strategy for the GDA. The 2012 Base Scenario was used as the foundation for the various parameter changes made in the Eastern Regional Model (ERM), as well as acting as a base case/ comparison year in the examination of the effect that the policy changes have on mode share if implemented. The 2035 NTA Transport Strategy for the GDA (NTA, 2016) ‘provides a framework for the planning and delivery of transport infrastructure and services in the GDA over the next two decades’ (NTA, 2016). This strategy includes the introduction of a number of large infrastructural projects such as a redesign of the Dublin bus network (BusConnects) and the construction of Ireland’s first metro/ underground rail line (Metrolink). The key elements or objectives that the 2035 plan proposes are: a reduction in traffic congestion at bottlenecks and public transport priority; improving pedestrian priority and the walkability of urban areas; an increase in the mode share of active modes; and finally a reduction in the safety risk associated with cycling and preventing the number of road accidents involving cyclists by investing in the GDA Cycle Network Plan (NTA, 2016; NTA, 2013).
3
9
Figure 1 Regional Modelling System Structure (NTA, 2017)3.2.1 Parameter Modifications
[image:9.595.225.397.73.362.2]The prime objective of this work was to more accurately predict the potential real-life responsiveness of commuters in the GDA to a range of policy incentives by employing the NTA’s ERM. To achieve this aim, three scenarios (Do Nothing, Do Something and Do Maximum) were devised to simulate the introduction of the policy interventions and to capture the effect of these policies on mode share estimates. In each of these scenarios, changes to the public transport network were introduced in multiple model runs. These parameters were arrived at after a review of the literature and feedback from the project stakeholder group which included public transport owners and regulators. The organisational structure of the parameter changes made in the ERM are outlined in Table 1:
Table 1
Policy incentives and model parameter changes
Mode Incentives Frequency Time Cost parameter changes Justification for
Bus/Rail
Scheduling improvements to ensure reliability, punctuality and increased frequency of services
% improvement in frequency of PT services (% reductions made to headways of PT modes)
% reduction in door-to-door trip times due to reduced wait times
% reduction in trip cost from lower fares
Reduction in PT headways and fares acts as a proxy for changes in service efficiency affecting time and cost parameters.
Reduction in bus and rail fares
Adjustment to headways also acts a proxy for improvements in service frequency.
[image:9.595.88.509.567.707.2]10
This was to ensure that comprehension the capabilities of the model and the CUBE Voyager scripting language, in addition to SATURN4 network coding was attained prior to making any model changes.3.2.2 Changes to the PT network in the Four Stage Model
In the Public Transport (PT) assignment model, headways were reduced as a direct modelled proxy for increased PT service frequency in the network for all routes in the GDA serviced by bus, tram or rail. In addition to this, fares associated with these services, which are coded in the CUBE Voyager scripting language, were also modified to represent staged decreases in the cost of bus and rail services. These parameter changes acted as proxies for improvements made to bus and rail service frequency, leading to shorter wait times, and lower trip costs for PT commuters. The values at which the coded headways and fares were reduced in the model were sense-checked in reference to similar experiments reviewed in the literature, such as studies conducted by O’Fallon et al. (2004); Mackett (2001); Bamberg and Schmidt (2001); Weibin et al. (2017); Eboli and Mazzulla (2008); and Bourgeat (2015). As delineated in Section 2.1, O’Fallon et al. (2004) investigated the effect of making a marked improvement in trip times and costs for commuting trip purposes, through a policy of offering incentives, in a stated preference (SP) study conducted in New Zealand. In this study, all attributes were set on three levels, with the time attribute levels defined at: 10%, 25% and 35% improvements in trip times, and trip cost attribute levels defined at: no change, 25% and 50% decreases in cost, as a result of implementing a range of policy incentives.
Bus and rail are commonly considered by commuters in terms of the cost associated with the service, in addition to trip time and the reliability of it, which is linked to the frequency or the level of service. These factors have been widely examined in the literature; Weibin et al. (2017), for example, conducted a SP experiment to determine urban commuter’s valuation of travel time reliability. They found that both income level and time constraints had significant effects on PT utility for commuters, and individuals in higher income levels usually preferred a mode with less travel time and higher reliability (Weibin et al., 2017). Thus, consideration was placed on travel reliability and its associated factors such as the frequency of service and headways on routes. Research conducted by Eboli and Mazzulla (2008) similarly incorporated frequency as a main attribute in a study examining PT and found that service frequency was a statistically significant attribute for measuring service quality in public transport modes in Italy, by means of an MNL model. Their analysis found that increasing bus frequency to every 15 minutes (from only one every hour) ceteris paribus, resulted in an increase of 2.6 on the service quality index (SQI) (Eboli, Mazzulla, 2008; Hensher et al., 2003). Bourgeat (2015) also found that bus frequency had an impact on the likelihood of bus being chosen by commuters and it was the favoured method of reducing the uncertainty of bus arrival times. Moreover, Bourgeat (2015) stated that raising awareness of bus frequency is essential in generating demand among non-users.
As a result of sense-checking the attributes and attribute values that are used frequently in the literature cited above, which determined the appropriateness and sensitivity of using certain values, it was decided to define the time and cost attributes (i.e. the coded headway and fare values) in this study on two ordinal levels, namely: 25% and 35% reductions in trip time and cost to represent the Do Something and Do Maximum scenarios respectively.
Headways
In the ERM, the frequency of PT services operating in the GDA are represented by coded headways for all bus and rail operators in the ERM in the PT network, for each time period. Thus, for the PT scenarios, changes to the coded headways of the main commuter bus and rail
4
11
services operating in the GDA were applied in the supply component of the PT assignment model. In order to modify such headways values, a macro enabled Microsoft Excel worksheet was developed to ensure that only selected services were modified (i.e. commuter services only operating in the GDA as opposed to the eastern region as a whole: Dublin Bus, Bus Eireann, DART and Luas). When these changes to headways were performed, a new PT input file was generated, which would then be interpreted by the model within CUBE Voyager application. This input file contains detailed information concerning PT services, such as: the PT routes in consideration, a definition of the operator, in addition to wait and crowding curves. This file also contains a large amount of in-depth data associated with the services modelled, namely: the operating company, route type (i.e. circular/ linear), service type (i.e. stopping/ express), the headway values for modelled time periods (AM, LT, PM Peaks), a short and long text description of the serviced routes, and the sequence of nodes serviced along the route.In line with the Do Something and Do Maximum scenarios, it was decided to reduce PT headways as a proxy for increased service frequency for bus and rail services in the GDA, which consequently reduces PT wait times. These new headway values were then coded into Cube Voyager to be run in the ERM.
Fares
In addition to headways, trip costs (i.e. fares) were also reduced as an added measure to represent the policy incentives devised to encourage a modal shift to PT from private car commuting in the GDA. The fare ‘systems’/ structures modelled in the ERM for bus, rail and tram are considered as operator specific as each has a different fare structure (i.e. stage/ zone based versus number of stations or stops travelled). Furthermore, independent fare system coding was used for school services to account for discounted school fares. Akin to the headways/ frequency coding, reductions in bus and rail fares for the operators specified were performed.
3.3 Emissions Estimation
In order to estimate the emissions savings or changes in emissions as a result of implementing the range of policy scenarios tested in this study, the recommended approach outlined in the Department of Transport, Tourism and Sport’s (DTTAS) Common Appraisal Framework (CAF) Report (2016) was adopted. The CAF provides guidance in evaluating a range of aspects related to the transport sector in Ireland including economic appraisal, risk and uncertainty analysis, cost-benefit analysis, in addition to recommending approaches for project assessment, monitoring and implementation. One of the central factors included in the CAF project appraisal criteria is related to evaluating the impact of transport on the environment, such as air, noise, and ecological pollution and architectural impacts. More information of the CAF is accessible from the DTTAS (2016). Under this approach, the estimation of Carbon Dioxide (CO2), Mono-nitrogen oxides (NOx), and Particle matter (PM2.5) are considered, by applying the following equation (DTTAS, 2016; McNamara, 2012):
Equation 2
𝐶𝑂!= (𝐸𝐹!∗𝑉𝐾𝑀)
where:
12
The vehicle kilometres (vkms) travelled were calculated based on the distance of each link in the network and the load of the user classes travelling on the links, per time period. These results were generated from SATURN (Atkins, 2017), and Cube Voyager (Citilabs, 2017) for the following user classes: car employment/ business travel, car commute, car education, car other, bus and rail. Factors were first applied to the vkms for each of the peak hours to estimate the passenger car unit (PCU) kms for bus and rail. Hour-to-period factors were then applied to calculate vkms for all modes in the time periods. When the PCU and hour-to-period vkms were calculated, the emissions factors (EF), included in the 2016 CAF report (DTTAS, 2016), were applied to the vkms to estimate the daily mode specific emissions for private cars and buses in kilograms per kilometre for the 2012 Base Scenario and 2035 GDA Strategy scenarios. ‘The emission factor is, in principle, a universally-applicable parameter specific to a particular vehicle type, where activity data is specific to a particular region’ (EPA, 2007). The factors for private vehicles and bus were sourced from the default values contained in the COPERT 4 (Computer Programme to calculate Emissions for Road Traffic) (Emisia, 2018) road transport emissions model using the Irish inventory. The CO2 emission factor for DART was obtained from Brazil et al. (2013), and the Luas emissions factor was developed by the Veolia Transport Group Eco-Efficient Travel Assessment Methodology (Luas, 2017). For private cars, separate factors were applied to petrol cars and diesel cars, based on a fuel split in the private car fleet of 53.6% diesel and 46.4% petrol, which was outlined in the National Mitigation Plan (DCCAE, 2017). A decision was made, in discussion with the NTA, to employ consistent emissions factors for both the 2012 and 2035 scenarios due to the unavailability of reliable forecast emissions factors for the PT modes analysed.The application of a monetary value to the emissions estimation is outlined as the final stage in the approach set out by the CAF (DTTAS, 2016). In view of this, the CAF provides a range of emissions values per emission type to calculate the cost of road transport emissions. These are the values that were employed in this paper to estimate the potential cost savings generated from emissions reductions.
4. Results
4.1 Public Transport Changes Output
The network changes applied to the PT (bus and rail) networks were in the form of reductions made to service headways and fares to account for reducing time and cost parameters of travelling by bus or rail in the GDA. In the 2012 Base Year, shown in Table 2, the changes in the PT network were found to result in an increase in PT trips of 1.34% in the Do Something and 2.08% in the Do Maximum scenario. Of this increase in the Do Maximum scenario, 0.52% came from private cars, 1.03% from walking and 0.53% from cycling. These mode shifts were as a result of decreasing the headways and fares of bus and rail services in the GDA by 35% as proxies for quicker, more frequent and cheaper PT trips. These results show that the incentives tested were more attractive to active mode users rather than private car users, in other words pedestrians and cyclists were found to be more elastic to the frequency and fare policy changes than car motorists. This finding suggests that more may need to be done to make public transport more attractive car users or rather make private cars less attractive due to the application of disincentives. In this way, it is conceivable that a higher percentage shift away from cars could be achieved.
13
mode shift of car users for all trip purposes was low, commute trips to work and education were found to be directly influenced by the headway and cost savings made as a result of the policy measures introduced.Table 2
PT (bus and rail) changes output for the 2012 Base Scenario
All Trip Purposes (Base Scenario 2012)
Base Scenario
Do Something Scenario 25% decrease in headways and fares
Do Maximum Scenario 35% decrease in headways and fares
No. of Trips: 5,048,523 No. of Trips: 5,047,423 No. of Trips: 5,064,850 Modes Mode Share % Mode Share % % diff. from Base Mode Share % % diff. from Base
Car 62.23 61.95 -0.28 61.71 -0.52
PT 9.69 11.03 +1.34 11.77 +2.08
Walk 23.90 23.22 -0.68 22.87 -1.03
Cycle 4.18 3.80 -0.38 3.65 -0.53
Total 100.00 100.00 100.00
Commute Trip Purpose (Base Scenario 2012)
Base Scenario
Do Something Scenario 25% decrease in headways and fares
Do Maximum Scenario 35% decrease in headways and fares
No. of Trips: 1,046,797 No. of Trips: 1,046,850 No. of Trips: 1,046,765 Modes Mode Share % Mode Share % % diff. from Base Mode Share % % diff. from Base
Car 72.89 71.41 -1.48 71.13 -1.76
PT 10.58 12.77 +2.19 13.45 +2.87
Walk 12.78 12.44 -0.34 12.24 -0.54
Cycle 3.75 3.39 -0.36 3.18 -0.57
Total 100.00 100.00 100.00
The 2035 GDA Strategy results, outlined in Table 3, showed smaller increases in PT mode shares than the 2012 Base Year. However, it must be emphasised that these increases were made in addition to the higher mode share of PT in 2035 given the range of PT projects included in the strategy. For all trips, the PT mode share grew to 17.37% in the Do Maximum scenario, representing a 1.19% increase. Yet, only 0.07% of this shift came from private cars, as larger shifts were found from cycling and walking to PT with reductions of 0.82% and 0.30%, respectively. The PT mode share for commuters resulted in an increase of up to 1.42% in the Do Maximum scenario. The share of PT for commute trips represented the highest mode share for PT across all of the runs conducted in this study at 20.17%. The majority of this shift came from private cars at 0.99%. Overall, the results presented in this scenario showed an increase in PT of 7.68% from the 2012 Base case scenario to the Do Maximum scenario in the 2035 forecast. The results for the 2035 forecast scenario, similarly indicate that the introduction of increases in frequency and fare reductions were not enough to stimulate a further shift away from the private car, on top of the reduction in car mode share achieved following the implementation of the GDA strategy. Therefore, in reference to findings produced by Washbrook et al. (2006), Baldassare et al. (1998), Kuppam et al. (1998) and Hunt et al. (1997), it is likely that a higher reduction in car trips could be attained if the incentives proposed were combined with a sticks measure such as a restriction on free workplace parking or an increase in parking charges and/ or a cordon charge.
Table 3
PT changes output for the 2035 GDA Strategy
All Trip Purposes (2035 Strategy)
14
25% decrease in headways and fares 35% decrease in headways and fares
No. of Trips: 5,984,781 No. of Trips: 5,987,610 No. of Trips: 5,986,137 Modes Mode Share % Mode Share % % diff. from Base Mode Share % % diff. from Base
Car 58.40 58.53 +0.13 58.33 -0.07
PT 16.18 16.82 +0.64 17.37 +1.19
Walk 22.18 21.62 -0.56 21.36 -0.82
Cycle 3.24 3.03 -0.21 2.94 -0.30
Total 100.00 100.00 100.00
Commute Trip Purpose (2035 Strategy)
Base Scenario Do Something Scenario 25% decrease in headways and fares Do Maximum Scenario 35% decrease in headways and fares
No. of Trips: 1,268,512 No. of Trips: 1,266,159 No. of Trips: 1,266,313 Modes Mode Share % Mode Share % % diff. from Base Mode Share % % diff. from Base
Car 68.76 67.90 -0.86 67.77 -0.99
PT 18.75 19.82 +1.06 20.17 +1.42
Walk 10.35 10.25 -0.10 10.11 -0.24
Cycle 2.14 2.04 -0.10 1.95 -0.19
Total 100.00 100.00 100.00
4.2 PT Emissions Results
[image:14.595.89.507.70.312.2]The changes in emissions produced from the PT scenarios in the 2012 Base Scenario are presented in Table 4. These emissions were based on variations in vehicle kilometres travelled, as a result of coded modifications made to headways and fares in the ERM. The results from Table 4 show that reductions of 431.58t in CO2, 0.95t in NOx and 0.046t in PM2.5 could be attained for commute trips in the GDA in the Do Something scenario. Car trips for employment or business purposes also produced emissions reductions in this scenario, with 37.02t of CO2, 0.08t of NOx and 0.004t of PM2.5 being saved in the Do Something scenario. In the Do Maximum scenario, the emissions generated for these trip purposes were lower than in the Do Something scenario, with the exception of car other trips (i.e. purposes other than commuting and education, such as visiting relatives, shopping, recreational, etc.). However, in response to mode shifting behaviour from active modes and private cars to PT in this scenario, a resultant rise in emissions for bus, train and Luas was subsequently found, which was expected given the higher frequency of service in order to meet the shorter headway times modelled in the network.
Table 4
PT changes emissions daily output for the 2012 Base Scenario
CO2 Emissions(t) Total Base Total Do Some Diff. from base Total Do Max Diff. from base
Car Emp. Business 293.45 256.43 -37.02 290.54 -2.91
Car Commute 1,269.41 837.83 -431.58 1,258.36 -11.05
Car Education 19.15 507.29 +488.14 18.23 -0.92
Car Other 1,821.77 1,811.48 -10.29 1,805.98 -15.79
Bus 199.10 236.36 +37.26 324.61 +125.51
DART 2.04 2.38 +0.34 2.55 +0.51
Luas 13.02 14.56 +1.54 15.46 +2.44
NOx Emissions(t) Base Total Do Some Total Diff. from base Do Max Total Diff. from base
Car Emp. Business 0.64 0.56 -0.08 0.64 0.00
Car Commute 2.78 1.83 -0.95 2.76 -0.02
Car Education 0.04 1.11 +1.07 0.04 0.00
Car Other 3.99 3.97 -0.02 3.95 -0.04
Bus 1.61 1.91 +0.30 2.62 +1.01
15
Total Total Diff. from base Total Diff. from base
Car Emp. Business 0.031 0.027 -0.004 0.031 0.00
Car Commute 0.134 0.088 -0.046 0.133 -0.001
Car Education 0.002 0.053 +0.051 0.002 -0.00
Car Other 0.192 0.191 -0.001 0.190 -0.002
Bus 0.014 0.017 +0.003 0.023 +0.009
[image:15.595.106.485.72.138.2]In the 2035 GDA Strategy, there were relativity minor reductions in emissions over the base scenario, given the mode shift to PT between the 2012 Base Scenario and 2035 Strategy with the inclusion of Metro North, Bus Connects and DART and Luas expansions. However, Table 5 shows that in addition to these infrastructural changes, the policy incentives tested in this study were found to result in an added reduction of 1.19t of CO2, 0.002t of NOx and 0.0001t of PM2.5 a day for car business use trips, and 0.11t of CO2, 0.001t of NOx and 0.0001t of PM2.5 for car education trips, in the Do Maximum scenario. These two car user classes were the only ones to experience a reduction in emissions over the two scenarios modelled (i.e. Do Something, Do Maximum) in this scenario, which represented the difficulty in encouraging a further reduction in car mode shares over that already achieved in the 2035 GDA Strategy.
Table 5
PT changes emissions daily output for the 2035 GDA Strategy
CO2 Emissions(t) Total Base Total Do Some Diff. from base Total Do Max Diff. from base
Car Emp. Business 312.96 312.92 -0.04 311.77 -1.19
Car Commute 1,654.59 1,660.75 +6.16 1,657.34 +2.75
Car Education 17.65 17.77 +0.12 17.54 -0.11
Car Other 1,928.89 1,944.70 +15.81 1,937.90 +9.01
Bus 1,551.32 1,977.00 +425.68 1,977.00 +425.68
DART 11.10 11.67 +0.57 11.77 +0.67
Luas 21.97 20.73 -1.24 22.10 +0.13
NOx Emissions(t) Base Total Do Some Total Diff. from base Total Do Max Diff. from base
Car Emp. Business 0.685 0.685 0.00 0.683 -0.002
Car Commute 3.62 3.64 +0.02 3.63 +0.01
Car Education 0.039 0.038 +0.001 0.038 -0.001
Car Other 4.22 4.26 +0.04 4.24 +0.02
Bus 12.54 15.98 +3.44 15.98 +3.44
PM2.5 Emissions(t) Base Total Do Some Total Diff. from base Total Do Max Diff. from base
Car Emp. Business 0.0330 0.0330 0.00 0.0329 -0.0001
Car Commute 0.174 0.175 +0.001 0.175 +0.001
Car Education 0.0019 0.0019 0.00 0.0018 -0.0001
Car Other 0.203 0.205 +0.002 0.204 0.001
Bus 0.11 0.14 +0.03 0.14 +0.03
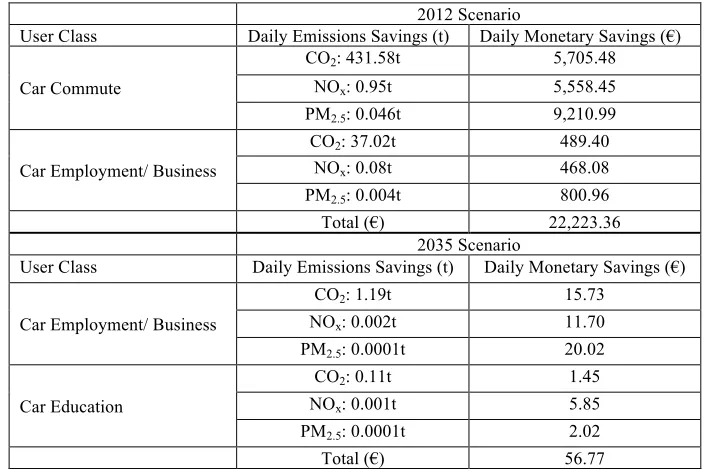
The daily emissions savings estimated for the car commute and employment use purposes in the 2012 Base and 2035 Forecast Scenarios were then used to estimate the following daily cost savings by applying monetary factors outlined by the CAF (DTTAS, 2016), in Table 6. The values in Table 6 were produced in 2016 and haven’t been updated since, but the document does provide guidance on future values. These results show that the dis-benefits and negative externalities associated with PM2.5 emissions result in a high monetary cost. The daily emissions savings recorded as a result of implementing the public transport incentives translated into daily monetary savings of €9,210 for PM2.5, following by €5,705 for CO2, and
16
Table 6Monetary savings from car user class emissions reductions in the 2012 Base and 2035 Forecast Scenario
2012 Scenario
User Class Daily Emissions Savings (t) Daily Monetary Savings (€)
Car Commute
CO2: 431.58t 5,705.48
NOx: 0.95t 5,558.45
PM2.5: 0.046t 9,210.99
Car Employment/ Business
CO2: 37.02t 489.40
NOx: 0.08t 468.08
PM2.5: 0.004t 800.96
Total (€) 22,223.36
2035 Scenario
User Class Daily Emissions Savings (t) Daily Monetary Savings (€)
Car Employment/ Business
CO2: 1.19t 15.73
NOx: 0.002t 11.70
PM2.5: 0.0001t 20.02
Car Education
CO2: 0.11t 1.45
NOx: 0.001t 5.85
PM2.5: 0.0001t 2.02
Total (€) 56.77
5. Discussion and conclusions
The overarching research question of this study was to determine the effect of providing a range of policy incentives alone rather than a carrot and sticks approach, on the commuting population of the GDA. Furthermore, if such policies were implemented, what would the potential impact of this be on commuter car trips versus trips by public transport? This question was appraised by means of four-stage transport modelling to estimate the impact of introducing measures that could lead to time and cost savings for commuting trip purposes. The results from this study determined that offering tangible incentives that improve trip attributes such as trip time and cost can result in sustainable travel behaviour change in terms of modal shift and emissions savings by disrupting long-standing car commute habits. The findings produced from this study determined that a reduction in the mode share of private cars of up to 1.76% as result of shift to public transport modes, which experienced an increase of up to 2.87%, could be attained as a result of employing the policy measures appraised. Daily emissions savings of up to 431.58 tonnes of CO2, 0.95 tonnes of NOx, and 0.046 tonnes of PM2.5 were similarly estimated, which could result in monetary savings of up to €5,705 from reductions in CO2, €5,558 from NOx, and €9,210 from PM2.5.
17
students, following the introduction of a free semester ticket policy. This is similarly supported by Weibin et al. (2017) who stipulated that ‘both income and time constraints have significant effects on the utility of alternative modes of transport for commuters’ (Carroll et al., 2017).The implementation cost of policies tested in this study is similarly a factor that must be considered, particularly when devising a benefit cost analyses. In order to deliver a marked improvement in the frequency of bus and rail services there is, of course, a requirement to procure additional buses and trains to meet the evident demand and to sustain busier timetables. The cost of vehicle procurement figures supplied by the Department of Transport, Tourism and Sport (DTTAS) (2015), states that €35,211,194 was spent in total (or €320,101 per vehicle) for the Dublin Bus procurement contract with Volvo Bus UK for the acquisition of 110 double deck buses. At present day values, a EURO VI diesel double-deck city bus costs approximately €350,000, however from July 2019 the state has committed to banning the procurement of diesel buses and trialling low/zero emission bus technologies. Thus, the cost of procuring new zero-emission double-deck city buses will be likely be a multiple of the cost of the EURO VI diesel price. In relation to revenue lost as a result of a reduction in fare prices, it is suggested that this could arguably be addressed by increasing the subvention funding that bus and rail companies receive from the National Transport Authority (NTA), in order to take account of new lower fares. For context, in 2017 Dublin Bus received over €56 million in subvention funds from the NTA (Dublin Bus , 2018), while customer revenue was recorded at €252 million.
Overall, the findings presented in this paper demonstrate that the implementation of policy incentives alone, without considering any ‘stick’ measures, can aid efforts in reducing greenhouse gases emissions produced from transport in the GDA. This study provides supporting empirical evidence to justify the adoption of incentive policy measures that have been shown to be effective instruments in initiating sustainable travel behaviour change in the Greater Dublin Area, by targeting the trip attributes that commuters value most, i.e. trip time and cost. A suggestion for further research, which seeks to replicate a study of this nature would be to firstly, reduce the study area to just Dublin city and repeat the study using a sample from this area, rather than the Greater Dublin Area. Secondly, as a means of comparison, further research is planned to examine the impact of introducing a carrot and sticks approach in this study area, to determine the impact that combining incentives and disincentives can have on mode shares in the GDA and the potential additional emissions savings that can be attained on top of those examined in this paper.
In summary, if the ultimate goal is to encourage sustainable travel behaviour change by ensuring the optimal operational efficiency of public transport services, and to increase the competitiveness of bus and rail versus the private car, then it is recommended that the Irish Government increase its investment and expenditure in the actual day-to-day operation of the public transport services and not only in public infrastructure that supports it.
Acknowledgement
The authors would like to thank the Environmental Protection Agency of Ireland for funding this research under the Greening Transport project, and the National Transport Authority for their assistance in producing this research.
References
Ahern, A., Tapley, N. (2008) The use of stated preference techniques to model modal choices on interurban trips in Ireland, Transportation Research Part A, Vol. 42, pp. 15-27.
Atkins (2017) SATURN: Congested Highway Assignment Software.Available at: https://saturnsoftware2.co.uk/. (Accessed on: 07/12/2017).
18
Bamberg, S., and Schmidt, P. (2001) Theory-driven, subgroup-specific evaluation of an intervention to reduce private car-use, Journal of Applied Social Psychology, Vol. 31, pp. 1300–1329.Brazil, W., Alam, S., McNabola, A., Caulfield, B. (2013) PEACOX: D3.4 Validating the Door-to-Door Emission Model and Behaviour Model. Available at: http://www.project- peacox.eu/uploads/media/peacox/public_deliverables/PEACOX_D3_4_Validating_Door-to-Door_Emission_and_Behaviour_Model_v1_0.pdf. [Accessed on: 31/01/2018].
Carroll, P., J., Caulfield, B., Ahern, A. (2017) Examining the potential for car-shedding in the Greater Dublin Area, Transportation Research Part A: Policy and Practice, Vol. 106, pp. 440-452.
Caulfield, B. (2014) Re-cycling a city – examining the growth of cycling in Dublin,
Transportation Research Part A: Policy and Practice, Vol. 61, pp. 216-226.
Central Statistics Office of Ireland (2017) Census 2016 Summary Results – part 2. Available at: www.cso.ie/en/csolatestnews/presspages/2017/census2016summaryresults-part2/. [Accessed on: 29/06/17].
Citilabs (2017) Cube: Transportation and Land Use Modelling. Available at:http://www.citilabs.com/software/cube/. [Accessed on: 07/12/2017].
Climate Change Advisory Council (2018) Annual Review 2018. Available at:
http://www.climatecouncil.ie/media/CCAC_AnnualReview2018.pdf. (Accessed on: 02/08/18).
Department of Communications, Climate Action and Environment (2017) National Mitigation Plan, July 2017. Available
at:https://www.dccae.gov.ie/documents/National%20Mitigation%20Plan%202017.pdf. [Accessed on: 16/02/2018].
Department of Public Expenditure and Reform (2018) National Development Plan 2018- 2027. Dublin: Department of Public Expenditure and Reform.
European Commission (2012) Europe 2020: Europe’s growth strategy. Brussels: European Commission.
Department of Public Expenditure and Reform (2018) Project Ireland 2040. Availableat:
http://www.gov.ie/en/project-ireland-2040. [Accessed on: 07/03/2018].
Department of Transport, Tourism and Sport (DTTAS) (2019) Climate Change – Low Emissions Bus Trial. Available at: http://www.dttas.ie/public-transport/english/climate-change. [Accessed on: 16/05/19].
Department of Transport, Tourism and Sport (DTTAS) (2016) Common Appraisal Framework for Transport Projects and Programmes. Available at:
http://www.dttas.ie/sites/default/files/publications/corporate/english/common-appraisal-framework-2016-complete-document/common-appraisal-framework.pdf. [Accessed on: 26/03/2018].
DTTAS (2015) Details of Procurements in Excess of €10m, whether new, in progress or completed in 2015. Available at:
http://www.dttas.ie/sites/default/files/content/corporate/english/general/procurement-over-%E2%82%AC10-million/national-transport-authority-procurement-information.pdf. [Accessed on: 18/06/2018].
Emisia (2018) The popular, straightforward and simple to use emissions calculator. Available at: http://emisia.com/products/copert. [Accessed on: 31/01/2018].
Enoch, M., and Potter, S. (2003) Encouraging the commercial sector to help employees to change their travel behaviour, Transport Policy, Vol. 10, pp. 51-58.
Eriksson, L., Nordlund, A., M., Garvill, J. (2010) Expected car use reduction in response to structural travel demand management measures, Transportation Research Part F, Vol. 13, pp. 329-342.
19
http://www.epa.ie/pubs/reports/air/airemissions/ghgprojections2017-2035/EPA_2018_GHG_Emissions_Projections_Summary_Report.pdf. (Accessed on: 02/08/18).
EPA (2016) Ireland’s Environment: An Assessment 2016. Wexford: Environmental Protection Agency of Ireland.
Eurostat (2016) Greenhouse gas emissions per capita. Available at:
https://ec.europa.eu/eurostat/web/products-datasets/-/t2020_rd300. [Accessed on: 24/10/18]. Fujii, S., and Kitamura, R. (2003) What does a one-month free bus ticket do to habitual drivers? An experimental analysis of habit and attitude change, Transportation, Vol. 30, pp. 81-95.
Gärling, T., and Axhausen, K., W. (2003) Introduction: Habitual travel choice,
Transportation, Vol. 30, pp. 1-11.
Guzman, L., A., Oviedo, D. (2018) Accessibility, affordability and equity: Assessing ‘pro-poor’ public transport subsidies in Bogotá, Transport Policy, Vol. 68, pp. 37-51.
Hunt J., D., McMillan J., D., P. (1997) Stated preference examination of attitudes toward carpooling to work in calgary. Transportation Research Record, No. 1598, pp. 9–17.
Kuppam A., Pendyala R., Gollakoti M. (1998) Stated response analysis of the effectiveness of parking pricing strategies for transportation control. Transportation Research Record, No. 1649, pp. 39–46.
Luas (2017) Luas Eco-Calculator. Available at: https://luas.ie/ga/549.html. [Accessed on: 14/12/2017].
Mackett, R., L. (2001) Policies to attract drivers out of their cars for short trips, Transport Policy, Vol.8, pp. 295-306.
Malodia, S., Singla, H. (2016) A study of carpooling behaviour using a stated preference web survey in selected cities of India, Transportation Planning and Technology, Vol. 39, pp. 538-550.
Marshall, S., and Banister, D. (2000) Travel reduction strategies: Intentions and outcomes. Transportation Research Part A, Vol. 34, pp. 321-338.
McNamara, D. (2011) Capping Transport Emissions: a Welfare Analysis of a Personal Carbon Trading Scheme, Doctoral Thesis. Dublin: Trinity College Dublin.
NTA (2018) Canal Cordon Report 2017 – Report on trends in mode share of vehicles and people crossing the Canal Cordon, Available at: https://www.nationaltransport.ie/wp-content/uploads/2018/05/Canal_Cordon_Report_2017.pdf. [Accessed on: 22/10/2018]. NTA (2018) Statement of Strategy 2018-2022, Available at:
https://www.nationaltransport.ie/wp-content/uploads/2018/03/NTA_Statement_of_Strategy_2018-2022_ENGLISH.pdf. [Accessed on: 26/03/2018].
NTA (2017) Modelling Services Framework – Regional Modelling System: Overarching Modelling Report. Dublin: National Transport Authority.
NTA (2017) Regional Modelling System – Public Transport Model Specification Report. Dublin: National Transport Authority.
NTA (2016) Transport Strategy for the Greater Dublin Area 2016 -2035. Dublin: National Transport Authority.
NTA (2013) GDA Cycle Network Plan. Dublin: National Transport Authority.
O’Fallon, C., Sullivan, C., and Hensher, D., A. (2004) Constraints affecting mode choices by morning car commuters, Transport Policy, Vol. 11, pp 17-29.
Ortúzar, J., Willumsen, L.G., 1994. Modelling Transport. Wiley, West Sussex.
Pooley, C., G., Horton, D., Scheldeman, G., Mullen, C., Jones, T., Tight, M., Jopson, A., Transport for Ireland (2017) Two thirds of passengers into Dublin city centre use sustainable transport modes, Available at: https://www.transportforireland.ie/two-thirds-of-passengers-into-dublin-city-centre-use-sustainable-transport-modes/. [Accessed on: 13/03/2018].