92
Deep Learning and Sociophonetics:
Automatic Coding of Rhoticity Using Neural Networks
Sarah Gupta
Dartmouth College
Anthony DiPadova
Dartmouth College
Abstract
Automated extraction methods are widely available for vowels (Rosenfelder et al.,2014), but automated methods for coding rhoticity have lagged far behind. R-fulness versus r-lessness (in words like park, store, etc.) is a classic and frequently cited variable (Labov,
1966), but it is still commonly coded by hu-man analysts rather than automated methods. Human-coding requires extensive resources and lacks replicability, making it difficult to compare large datasets across research groups (Yaeger-Dror et al., 2008; Heselwood et al.,
2008). Can reliable automated methods be developed to aid in coding rhoticity? In this study, we use Neural Networks/Deep Learn-ing, training our model on 208 Boston-area speakers.
1 Introduction
Despite advances in automation for phonetic alignment and extraction of vowel formants, there is still no reliable automated method for classify-ing r-droppclassify-ing, that is, whether a given word is pronounced with an /r/ in words likepark (pahk), start (staht), and so on. R-dropping, also known as non-rhotic speech, is an important sociolinguis-tic variable in modern dialect research. But unfor-tunately most researchers continue to depend on human judgments (Nagy and Irwin,2010;Becker,
2009;Nagy and Roberts, 2004), which is an in-consistent and time-consuming method that lacks replicability. Turning to the field of machine learn-ing, our deep learning approach investigates a new way to distinguish rhotic versus non-rhotic pro-nunciations in recorded data. This is the first study to use neural networks to classify rhotic versus non-rhotic speech.
Although human-coding requires extensive re-sources and lacks consistency and replicability (Yaeger-Dror et al.,2008;Heselwood et al.,2008),
making it difficult to compare large datasets across different research groups, it is the only method we have right now. How soon will computers be able to quickly and reliably code rhoticity up to this standard? In terms of other machine learn-ing approaches, McLarty, Jones, and Hall work on this challenge using Support Vector Machines (SVMs) (Mclarty et al.,2018). The present study uses Neural Networks/Deep Learning, one of the most effective and fastest-growing approaches in machine-learning. To our knowledge, this is the first attempt to use neural networks for automatic coding of any sociophonetic variable.
This new method was developed using audio recordings from over 200 New England speakers from Boston, Maine, and central New Hampshire (Stanford,forthcoming), and is here compared to other work on rhoticity (Heselwood et al., 2008;
Mclarty et al., 2018). In what ways can neural networks be effective tools in assisting the cod-ing of rhoticity? To what level can they perform compared to traditional coding methods and other approaches?
2 Background
The phoneme /r/ has been particularly difficult to pin down because it may be articulated in different ways, yet still produce the same acoustic signal. As most phoneticians have come to agree, F3 is one of the primary acoustic correlates of rhotic-ity (Espy-Wilson et al., 2000; Hagiwara, 1995;
Thomas,2011). The general consensus is that the F3 measurement for /r/ is lower than that of other non-rhotic vowels, but reliable standards for cod-ing rhoticity are lackcod-ing.
marry. British phonetician John Wells used the term “rhotic”, which has been subsequently con-sidered in the field as one of the most defining traits of varieties of English (Wells,1982).
Rhotic and non-rhotic dialects have been widely studied as they relate to sociolinguistic features of location, age, gender, and socioeconomic status. However, we are still reliant on human analysts to make judgements of rhotic vs. non-rhotic speech, which can require a lot of time and money. Despite advances in many areas of computational linguis-tics, there is still not an accurate way to determine rhoticity based on acoustic components alone; a human must judge for themselves whether or not an /r/ has been dropped. As expected, this is not highly replicable as different speakers may per-ceive things differently especially when it comes to dialects that are not so clear-cut (Yaeger-Dror et al.,2008). For this reason, an automated way to determine rhotic/non-rhotic tokens would be espe-cially helpful in these contexts.
3 Other work
3.1 Heselwood, Plug, and Tickle
Heselwood et al. (2008) extracted formant data from the spectrograms on the Bark scale – usu-ally, formant data F2/F3 is reported on the Hertz scale. The Bark scale more closely correlates to human perception of sounds, that is, on a logarith-mic scale rather than absolute. After conversion, F2 was labeled Z2 and F3 was labeled Z3, and a series of perceptual experiments were performed to ascertain rhoticity thresholds. Note that it was conducted for the purposes of perceptual research rather than coding applications.
3.2 McLarty, Jones, and Hall
Mclarty et al.(2018) trained a Support Vector Ma-chine (SVM) on pre-vocalic /r/ and vowels, and their approach did quite well in classifying prevo-calic /r/s. They then took this pre-trained model and applied it to classifying postvocalic /r/ tokens, which classified 84% as vowels, and 15% as /r/. As they describe, this is likely because all postvo-calic segments still contain vowel-like properties; furthermore, their training set excluded postvo-calic /r/ so the accuracy is expected to decrease.
However, their method did not perform as well in comparison to humans. On tokens where there was no ground truth, humans only agreed with the SVM classification about 55% of the time.
4 Methods
In this initial study, we used Boston-area field recordings of 208 speakers, 100 tokens per speaker (107 women/101 men, born 1915-1997). These on-the-street interviews ( 15-20 minutes each) are typical sociolinguistic recordings in terms of speech styles (word-list, sentences, read-ing passage, free speech) and occasional back-ground noise. We chose to omit free speech be-cause its token variability between speakers would present another challenging factor, leaving us with recordings where participants were reading (word-list, sentences, passage). Given word tran-scriptions, we used the Montreal Forced Aligner (McAuliffe et al.,2017) and modified Praat scripts (DiCanio,2014;Koops,2013) to align and extract vowel+(r) sequences, e.g., park, short. However, note that because non-rhotic dialects are less com-mon, and some of our recordings had background noise, it could be possible that alignments were not perfect for all of our tokens.
Two human analysts listened to recordings and judged each vowel+(r) token as r-ful or r-less. The human analysts agreed on 89.9% of the tokens, similar to human agreement elsewhere (Nagy and Irwin, 2010). Like other studies, we omitted to-kens when the human analysts disagreed ( 10%). So overall, 1700 tokens were discarded because of speaker disagreement, and 6500 rhotic tokens and 5300 non-rhotic tokens remained for analysis.
4.1 Preliminary Investigations
In early testing, we attempted classification into r-ful, r-less, and unknown, but this did not provide strong results so we simplified to a binary classi-fication. From the beginning of this project, we knew we wanted to use a machine learning ap-proach, so before using neural networks we tried some easier classifiers. However, we did not get encouraging results. For example, our Random Forest Classifier only gave about 54% accuracy. When we tried simpler neural networks, these gave much more promising results to we chose to pursue this method.
4.2 Data Extraction and Model Specifications
the length to extract 100 time-points per token, as shown in figure1. In the training, MFCCs were
Figure 1: Model architecture.
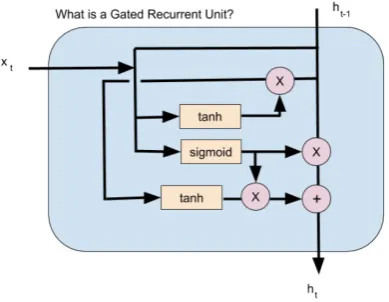
[image:3.595.313.515.394.560.2]more effective than traditional sociophonetic /r/ correlates F2 and F3 (Thomas,2011). These sam-ples were used in the model architecture as shown in figure 1, where there are 100 samples for each vowel + /r/ sequence. The Gated Recurrent Unit is shown in more detail in figure 2, where we can see the input from the previous timestep and layer, and how this is filtered through gates usingtanh andsigmoidactivation functions.
Figure 2: Gated Recurrent Unit (GRU) architecture.
Importantly, no work on coding rhoticity has made use of Recurrent Neural Networks, and we believe our methods are a promising step. We used Gated Recurrent Units (Cho et al., 2014;
Chung et al.,2014) to train our system to classify vowel+(r) tokens as r-ful or r-less. Following stan-dard methods in machine-learning, we split the data in order to train with 80% of the data and test with 20%.
We chose hyperparameters based on a grid search using 3-fold cross validation (only 3 due
to the small dataset). We saved the test set to val-idate results. The hidden layer size was 50 nodes, and dense layer size was 200 nodes. For regular-ization we used a kernel L2 regularregular-ization for the dense layer and we used both activation L2 and Recurrent L2 for the GRU layer. All of the alphas for this regularization are 0.01. The optimization method was RMSprop, and the learning rate was 0.001.
5 Results
[image:3.595.85.280.429.580.2]In figure 3, we see the Normalized Confusion Ma-trix, which summarizes our results by lining up true labels and predicted labels for our rhotic and non-rhotic tokens. We consider this binary classi-fication either rhotic (positive) or non-rhotic (neg-ative). In this way we can see the proportion of true positives (predicted to be rhotic and indeed truly rhotic), false positive (predicted to be rhotic but actually non-rhotic), true negative (predicted to be non-rhotic and actually non-rhotic), and false negative (predicted to be non-rhotic and actually rhotic). In deciding which model to use, we tried a
Figure 3: Normalized Confusion Matrix.
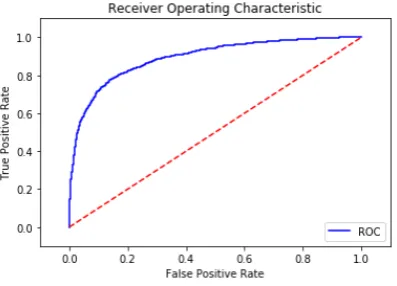
graph, is much closer to 1. Our system had 81.1%
Figure 4: Receiver Operating Characteristic.
accuracy with the human analysts in judging to-kens as r-less or r-ful, scoring 0.829 for F-measure.
Accuracy Precision Recall F1 AUC
GRU-MFCC 0.811 0.829 0.830 0.829 0.892
GRU-Bark 0.806 0.844 0.856 0.850 0.869
CNN-MFCC 0.746 0.796 0.815 0.805 0.808
Table 1: Metrics showing the performance of different models – our top performing model was using GRUs with MFCCs as input (as described previously).
We also used the Heselwood et al. approach (section 3.1) of classifying front or back vowels to see how accurately it would perform on the same test dataset. This classification gave an average speaker accuracy of 63.3% and an average token accuracy of 62.1% (Table 2), much lower than our best model’s overall accuracy (i.e. average across all tokens) of 81.1% (Table 1).
Average Speaker Accuracy 63.3%
Average Token Accuracy 62.1%
Table 2: Heselwood et al. approach on test dataset (us-ing Bark thresholds Z2 and Z3)
6 Discussion
The initial results of this study are promising. Our results are quite strong, as shown by the metrics in Table 1. When testing the Heselwood et al. proach (Table 2), it only predicted correctly ap-proximately 60% of the time; our model performs significantly better, at an accuracy of 81.1% (Table 1). It seems that we are also slightly better at pre-dicting rhotic tokens than non-rhotic (Figure 3),
which likely has to do with the fact that we have more rhotic tokens in total.
We aimed to reach human levels – considering that analyst agreement is 89.9% for our dataset (as mentioned above), our accuracy of 81.1% is quite good. However, these numbers are not strictly comparable as we discarded tokens that proved difficult for human analysts.
In future development of this method, we want to consider any sources of error on our part. For example, some audio and text files could be misaligned so we might consider hand-correcting these alignments. However, the nature of the neu-ral network could correct for this in that it learns to forget irrelevant or noisy data. By gathering more data, we would expect that our accuracy would im-prove and eventually reach a plateau where addi-tional speakers would not affect anything.
Additionally, a study that involves cross-corpus analysis could provide greater insight into how this model might be applicable on a larger scale, and how well our model actually performs. Fur-thermore, if we had 3 analysts rather than 2, we could have used a majority vote for classifying to-kens, and would not have to discard tokens where rhoticity was ambiguous.
A shortcoming of this study is that it only in-volves speech that is elicited through reading – ideally future studies would involve free speech in order to use more natural speech.
R-dropping is a crucial sociolinguistic variable for English dialect research in the US Northeast, Great Britain, Australia, New Zealand, Singapore, and other locations. Our neural network model takes a significant step toward automation of this key variable. In the future, we will continue op-timizing and improving our model. Other groups have studied automated methods for coding soci-olinguistic variables (Yuan and Liberman, 2011;
References
George Bailey. 2016.Automatic Detection of Sociolin-guistic Variation Using Forced Alignment. Univer-sity of Pennsylvania Working Papers in Linguistics:, 22(3).
Kara Becker. 2009. /r/ and the construction of place identity on New York City’s Lower East Side. Jour-nal of Sociolinguistics, 13(5):634 – 658.
Kyunghyun Cho, Bart Van Merrienboer, Caglar Gul-cehre, Dzmitry Bahdanau, Fethi Bougares, Holger Schwenk, and Yoshua Bengio. 2014. Learning Phrase Representations using RNN EncoderDecoder for Statistical Machine Translation. Proceedings of the 2014 Conference on Empirical Methods in Nat-ural Language Processing (EMNLP).
Junyoung Chung, Caglar Gulcehre, KyungHyun Cho, and Yoshua Bengio. 2014. Empirical evaluation of Gated Recurrent Neural Networks on sequence modeling. Neural Information Processing Systems 2014, Deep Learning and Representation Learning Workshop.
Christian DiCanio. 2014. Combine intervals.praat.
Carol Y. Espy-Wilson, Suzanne E. Boyce, Michel Jackson, Shrikanth Narayanan, and Abeer Alwan. 2000. Acoustic modeling of American English /r/. The Journal of the Acoustical Society of America, 108(1):343 – 356.
Robert Hagiwara. 1995. Acoustic Realizations of American /r/ as Produced by Women and Men.
Barry Heselwood, Leendert Plug, and Alison Tickle. 2008. Assessing rhoticity using auditory, acoustic and psychoacoustic methods. Proceedings of the 13th Methods in Dialectology., pages 331 – 340.
Chris Koops. 2013. Praat script for extracting vowel formants.
William Labov. 1966. The Social Stratification of En-glish in New York City.CAL, pages 380 – 403.
Michael McAuliffe, Michaela Socolof, Sarah Mihuc, Michael Wagner, and Morgan Sonderegger. 2017.
Montreal Forced Aligner: Trainable Text-Speech Alignment Using Kaldi. Proceedings of the 18th Conference of the International Speech Communi-cation Association.
Jason Mclarty, Taylor Jones, and Christopher Hall. 2018. Corpus-Based Sociophonetic Approaches to Postvocalic R-lessness in African American Lan-guage.American Speech, pages 1 – 18.
Naomi Nagy and Patricia Irwin. 2010. Boston (r): Neighbo(r)s nea(r) and fa(r). Language Variation and Change, 22(02):241 – 278.
Naomi Nagy and Julie Roberts. 2004. New England: Phonology, pages 270 – 281. De Gruyter Mouton.
Ingrid Rosenfelder, Josef Fruehwald, Keelan Evanini, Scott Seyfarth, Kyle Gorman, Hilary Prichard, and Jiahong Yuan. 2014. FAVE (Forced Alignment and Vowel Extraction).
James N Stanford. forthcoming. New England En-glish: Large-scale acoustic sociophonetics and di-alectology. Oxford University Press.
Erik Thomas. 2011. Sociophonetics: An introduction. Palgrave Macmillan.
J. C. Wells. 1982.Accents of English. Cambridge Uni-versity Press.
Malcah Yaeger-Dror, Tyler Kendall, Paul Foulkes, Dominic Watt, Jillian Eddie, Philip Harrison, and Colleen Kavenagh. 2008. NWAV 37.