ON-TALK AND OFF-TALK DETECTION: A DISCRETE WAVELET TRANSFORM ANALYSIS
OF ELECTROENCEPHALOGRAM
Fasih Haider
1, Hayakawa Akira
1, Saturnino Luz
2, Carl Vogel
3and Nick Campbell
11
Adapt Centre,
3School of Computer Science and Statistics, Trinity College Dublin, Ireland.
2
Usher Institute of Population Health Sciences & Informatics, University of Edinburgh, UK
ABSTRACT
Spoken interaction with a machine results in a behaviour that is not very common in face-to-face human communication:
Off-Talk, which is defined as speech utterances that are not directed to an immediate interlocutor, the machine, but to an-other person or even oneself. It is our contention that a sys-tem which is able to detect theOff-Talkutterances can interact with a human in a more efficient manner by acknowledging that the utterances are not directed to the system and hence, not replying toOff-Talkutterances. In this paper, we demon-strate the discrimination power of a wide range of Electroen-cephalogram (EEG) frequency bands using wavelet transform analysis and propose models forOn-TalkandOff-Talk detec-tion using audio and EEG signals, and their fusion. Our study shows that the EEG signal can identify the occurrence of Off-Talkutterances with promising accuracy and its fusion with audio features adds a slight improvement in these results.
Index Terms— multimodal interaction, dialogue sys-tem, brain-computer interface (BCI), electroencephalogram (EEG), on-off talk (speech) detection, multi-sensor fusion
1. INTRODUCTION
It has been observed that when people interact with computer systems, not only do they talk to the computer system but also, they tend to talk to themselves and to other people if present [1, 2, 3]. Oppermann et al [1] coined the term “Off-Talk” to denote speech that is not addressed to the computer system, as opposed to utterances that are directed to it, and therefore need to be understood by the system as “On-Talk”. Batliner et al [2] open their paper with an example from Shakespeare’s
Hamlet, where Hamlet seems to change his speaking style when addressing his interlocutor to utterances that are spo-ken, but not directed towards his interlocutor. It shows that this is not a new phenomena, but part of human nature that Shakespeare expressed with his characters [2]. The definition
This research is supported by “ADAPT 13/RC/2106” project (http://www.adaptcentre.ie/) in the SCL (Speech Communication Lab) and DLab (Design and Innovation Lab) at Trinity College Dublin, the University of Dublin, Ireland.
ofOff-Talk, as provided by Oppermann et al [1, p. 1] encom-passes every utterance that is not directed to the system, such as: (i) soliloquy/thinking aloud, (ii) swearing, (iii) reading from displayed text aloud, (iv) conversation with other per-son(s) present, (v) telephone conversation (e.g., with cellular phone) and (vi) extrinsic speech (e.g., video player, TV set, etc.). The objective of this paper is to model On-Talk and
Off-Talkin terms of EEG and audio features.
Previous studies by Oppermann et al [1] report that the loudness difference between On-Talk and Off-Talk can be used as a significant indicator ofOff-Talk and Hayakawa et al [3] also suggest that the prosodic features can help the On-TalkandOff-Talkdetection. One of the contributions of the present study is the demonstration of discrimination power of EEG frequency bands forOn-TalkandOff-Talkdetection.
30 Hz and temporal muscles between 40 Hz – 80 Hz. Poste-rior head muscle movements have a higher peak frequency close to 100 Hz, but this depends on many factors (e.g., sex, force and direction of contraction, etc.) [10]. Muscle activity may introduce artefacts in the EEG signal in a frequency range (≈20 Hz – 300 Hz) where the most artefacts are at the lower end [11]. However, the use of physiological signals (including the EEG signal) for speech related task in noisy and competing speech environment is well recognised. For removing the talk related muscle artefacts from EEG, heavy low pass signal filtering (frequencies above 10 Hz – 12 Hz should be filtered) can be used [12].
It is claimed that the right hemisphere of the brain is largely responsible for the speech prosodic characteristics [13, 14, 15] and Heart Rate (HR) and Skin Conductance (SC) also help in predicting the cognitive states [16], emotions [17], andOn-Talk and Off-Talk [3]. From the literature as stated above, we conclude three things: (i) First, the prosodic characteristics are different forOn-TalkandOff-Talk, (ii) Sec-ond, the right hemisphere of the brain largely determines the speech prosodic characteristics, and (iii) Third, the EEG sig-nal is full of artefacts while someone is speaking, but the artefacts’ range is between 15 Hz – 300 Hz, and there are still some frequencies<15 Hz which are not sensitive to muscle artefacts and contain the neural activity. Moreover, the skull EEG electrodes are unable to record the frequencies above 40 Hz according to clinical standards. We note that, while contrary to a common misconception the human skull does not filter out higher frequencies [18], neural activity at such frequencies is harder to detect due attenuation caused by the skull’s resistivity and the distance between the small genera-tor and EEG electrode [19]. That is why this study assumes that the frequencies above 40 Hz contain only muscle arte-facts, providing an opportunity to demonstrate the effect of muscle artefacts in the EEG signal forOn-TalkandOff-Talk
detection. Therefore, we analysed the full frequency band (0 Hz – 512 Hz) using Discrete Wavelet Transform (DWT) analysis to explore both the neural activity and muscle arte-facts forOn-TalkandOff-Talkdetection.
2. DATA SET
The data from the ILMT-s2s corpus1 was used for this paper due to the availability of finely time-stamped audio and phys-iological signals (EEG, heart rate and skin conductance) and also to use the results of Hayakawa et al [3] as a reference to determine the degree of any improvement.
The ILMT-s2s corpus: The corpus consists of 15 dia-logues of English speakers communicating with Portuguese speakers to perform the HCRC Edinburgh Map Task [20], a task where the subject is to guide the interlocutor along a predefined route on the map of one of the subjects. The
sub-1ISLRN: 100-610-774-625-0.
jects are situated in different rooms and communicate in their mother tongue to their interlocutor using a Speech-to-Speech Machine Translation (S2S-MT) system that Hayakawa et al [21] call the ILMT-s2s System. The corpus consists of
≈9.5 hours of audio, video and biological signal recordings of interlingual system mediated communication of 15 subject pairs (15 English and 15 Portuguese speakers).
The ILMT-s2s System: The S2S-MT system uses a ‘Push-to-Talk’ button to activate transactions, with each sub-ject’s voice being used only as an input and not transmitted to the interlocutor. The subject’s utterance is automatically con-verted into text (ASR), machine translated and then the trans-lated text is sent to the interlocutor’s computer to be output using Text-to-Speech (TTS), speech synthesis. Aside from the synthesised speech output, the ASR result is displayed on the subject’s computer and the TTS text is displayed on the interlocutor’s computer.
Audio and Video Recordings: Each dialogue recording consists of two audio and five video channels of data, but for this study, the audio of the whole dialogue that was captured by the 2 main video cameras was used.
Biosignal Recording:The corpus contains recordings of Heart Rate (HR) using the Blood-Volume Pulse (BVP) sensor, Skin Conductance (SC) and Electroencephalography (EGG) collected using a Mind Media B.V., Nexus-4 from one subject of the dialogue pair. The BVP sensor placed on the index fin-ger, with the SC sensor put on the middle and ring finger. The EEG sensors are placed in the F4, C4, P4 (right hemisphere of the brain that is responsible for the control of speech prosody [13, 14, 15]) with a ground channel placed at A1 (as depicted in Figure 1) of the 10 – 20 location system [22]. The sampling frequencies for the SC, HR and EEG are 32 kHz, 32 kHz and 1,024 kHz respectively.
Fp1
F7 F3
Fz Cz Pz F4
C4 C3 T8 A2 A1 T7
P7 P3
O1 O2 P4
P8 F8
Fp2
EEG sensors A: F4 - C4 EEG sensors B: C4 - P4 EEG Ground channel sensor: A1
Fig. 1: 10 – 20 system layout map
Annotation ofOn-TalkandOff-Talk: Since the ILMT-s2s System uses a ‘Push-to-Talk’ activation system, subject utterances that activated the S2S-MT system are considered as
3. EEG SIGNAL DECOMPOSITION
The EEG signal (S) is decomposed into 11 components us-ing the Discrete Wavelet Transform (DWT) usus-ing MATLAB,2 whereS =d1 +d2 +d3 +. . .+d10 +a10as depicted in Figure 2. The DWT helps us in evaluating the discrimina-tion power of each component (d1, d2etc) for theOn-Talk–
Off-Talkprediction.
4. FEATURE EXTRACTION
The following features are used for the classification task.
Audio features: We use openSMILE [23] to extract the acoustic features that have been widely used for emotion and spoken expression recognition [24]. The acoustic feature set contains the MFCC, voice quality, fundamental frequency (F0), F0 envelope, LSP and intensity features along with their first and second order derivatives. However, many statistical functions are also applied to the features which resulted in-total of 988 features for every speech segment. The motivation behind using this feature set is to model the differences in spoken expressions for On-Talk andOff-Talk
detection.
Physiological features:For each annotated label we have extracted the Shannon Entropy, mean, std, mode, min, max, median, energy, power, minimum ratio and maximum ratio along with their first and second order derivatives. As a result, we have 66 features for each component (e.g.,d1, d2); 33 for sensor A, and 33 for Sensor B (Figure 1) and in total, 726 EEG features for each annotated label.
5. CLASSIFICATION METHODS
We investigated the automatic detection of ‘On-Talk and
Off-Talk utterances’ using four machine learning methods, namely Linear Discrimination Analysis (LDA), Nearest Neighbour (KNN with K=15), Decision Trees (DT) and Random Forest (RF). These classifiers are employed in MAT-LAB using the statistics and machine learning toolbox but the RF classifier is employed in python using the scikit-learn library.3 LDA works by assuming that the feature sets of the classes to be discerned are drawn from different Gaussian distributions and adopting a pseudo-linear discriminant anal-ysis (i.e., using the pseudo-inverse of the covariance matrix [25]). KNN and DT are non-parametric methods.
6. RESULTS AND DISCUSSION
We conducted an experiment using different EEG frequency bands and acoustic features. We assessed the results using the
A-weightedF-score statistic (with theβ parameter set to 1).
2http://uk.mathworks.com/products/matlab/ – last verified
10/2017
3http://scikit-learn.org/stable/ – last verified 10/2017
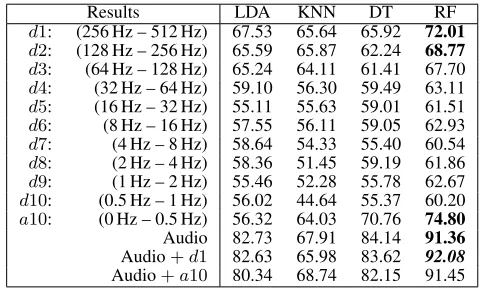
[image:3.612.316.556.175.320.2]In this setting, theA-weightedF-score is equivalent to the averaged harmonic mean of both classes which results in a baseline of 50% for the classification task. The classification results of the 1,127On-Talkand 554Off-Talkutterances are reported in Table 1.
Table 1: 10-fold cross validation results (A-weighted F -score %) forOn-Talk – Off-Talkdetection. (Baseline is 50%)
Results LDA KNN DT RF
d1: (256 Hz – 512 Hz) 67.53 65.64 65.92 72.01
d2: (128 Hz – 256 Hz) 65.59 65.87 62.24 68.77
d3: (64 Hz – 128 Hz) 65.24 64.11 61.41 67.70
d4: (32 Hz – 64 Hz) 59.10 56.30 59.49 63.11
d5: (16 Hz – 32 Hz) 55.11 55.63 59.01 61.51
d6: (8 Hz – 16 Hz) 57.55 56.11 59.05 62.93
d7: (4 Hz – 8 Hz) 58.64 54.33 55.40 60.54
d8: (2 Hz – 4 Hz) 58.36 51.45 59.19 61.86
d9: (1 Hz – 2 Hz) 55.46 52.28 55.78 62.67
d10: (0.5 Hz – 1 Hz) 56.02 44.64 55.37 60.20
a10: (0 Hz – 0.5 Hz) 56.32 64.03 70.76 74.80
Audio 82.73 67.91 84.14 91.36
Audio+d1 82.63 65.98 83.62 92.08
Audio+a10 80.34 68.74 82.15 91.45
Of the four classification methods, the results indicate that the Random Forest (RF) classifier provides the best re-sults in all tested settings. The highest frequency band (d1) achieved an A-weighted F-score of 72.19%, and the sec-ond highest frequency band (d2) provides an A-weighted
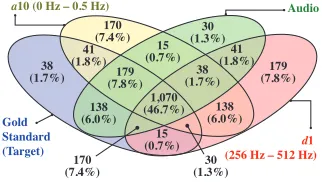
F-score of 68.77%. The reason why results are better using high EEG frequency bands is probably that these frequencies are reflecting speech related muscle artefacts in the recorded EEG signal, as explained in section 1. The EEG frequen-cies (> 15Hz and< 40Hz) contains muscle artefacts and neural activities, and able to detect theOn-TalkandOff-Talk. The lowest frequency band a10 produced the best results (74.80%) for the classification task which may be due to the fact that the right hemisphere of human brain is responsi-ble for speech prosody and that prosodic information may be encoded in lower bands of the EEG signal because the lower bands<15Hz do not contain the muscle artefacts, as explained in section 1. The audio features set provides the best classification results (91.36%), and the fusion of audio and EEG features (d1) improves the performance slightly (92.08%). We draw a Venn digram to explore the mutual information of the top three results which are obtained using
d1,a10and the Audio signal as depicted in Figure 3, and the confusion matrix of this figure is listed in Table 2.
Table 2: Confusion Matrix of the top three best results, show-ing classification of instances
a10 d1 Audio
Off-T. On-T. Off-T. On-T. Off-T. On-T.
Off-Talk 365 189 308 246 457 97
On-Talk 103 1,024 150 977 27 1,100
anno-d1 -50 5
d2 -5 0 5
d3 -50 5
d4 -5 0 5
d5 -50 5
d6 -550
d7-100 10
d8 -5 0 5
d9 -50 5
d10-200 20
100 200 300 400 500 600 700 800 900 1000 a10890
900 910
x[n]
EEG (
V
)
n
(a) EEG epoch during off talk
-10 0 10
-100 10
-100 10
-100 10
-50 5
-100 10
-5 0 5
-100
10
-100 10
-100 10
100 200 300 400 500 600 700 800 900 1000 1060
1080 1100
x[n]
n
EEG (
V
)
d1
d2
d3
d4
d5
d6
d7
d8
d9
d10
a10
(b) EEG epoch during on talk
Fig. 2: A wavelet decomposition of the EEG signal (S) into 11 components (d1, d2, . . . , a10) whereS=d1 +d2 +. . .+a10
d1 (256 Hz – 512 Hz) Gold
Standard (Target)
170
(7.4%) (1.3%)30
38 (1.7%)
179 (7.8%) 41
(1.8%)
41 (1.8%) 15
(0.7%)
15 (0.7%)
30 (1.3%) 170
(7.4%)
38 (1.7%) 179
(7.8%)
138 (6.0%) 138
(6.0%) 1,070 (46.7%)
a10 (0 Hz – 0.5 Hz) Audio
Fig. 3: Mutual Information: Venn diagram of the results
tated labels, the ‘yellow circle’ represents the predicted labels by the features ofa10 frequency band using the RF classi-fier, the ‘green circle’ represents the predicted labels by the acoustic features using the RF classifier, and finally the ‘red circle’ represents the predicted labels by the features ofa10
frequency band using the RF classifier. From the Venn di-agrams overlap, it is observed that there are 38 instances (8
On-Talkand 30Off-Talk) which have not been recognised by any of the feature sets. However there are 1,070 instances (875On-Talkand 195Off-Talk) which have been detected by all three feature sets. The EEG features provide less accurate results than audio features but are able to capture some infor-mation (41 (yellow circle: a10), 30 (overlap of yellow: a10
and red circles:d1) and 15 (red circle: d1) instances) which is not captured by the audio features as depicted in Figure 3.
We have also conducted a mid-p-value McNemar test to compare the results ofa10, d1 and Audio features with a null hypothesis which is thata10,d1 and Audio features have equal accuracy for predicting the target (On-Talk –
Off-Talkdetection). The test rejects the null hypothesis for ‘Audio and a10’ (pAudio−a10 = 1.67e−36), and ‘Audio and
d1’ (pAudio−d1= 9.44e−52) but fails to reject the null
hypoth-esis for ‘a10andd1’ (pa10−d1= 0.08). High-frequency bands (>40 Hz e.g.,d1) provide good results, and due to the muscle activity they capture, we can confirm that theOn-Talk and
Off-Talkutterances have a different muscle activity pattern.
In addition, we also obtain good results from the{a10(0 Hz – 0.5 Hz)}band which has robustness against muscle activities, which indicates that On-Talk and Off-Talk utterances also have different neural activity patterns.
In a previous study, Hayakawa et al [3] explored the EEG Gamma band along with SC, HR and acoustic features for the detection of On-Talk and Off-Talk and reported an
A-weightedF-scores of 57.19% when using only the EEG Gamma band. Our results of the wavelet analysis of the EEG signals significantly improves the performance for On-Talk
andOff-Talk detection up to 74.80%. The acoustic features provide the best results for On-Talk and Off-Talk detection in this study and in the results from Hayakawa et al [3]. However, the results from Hayakawa et al [3] do not provide promising results using physiological signals alone and used more acoustic features (6,371 acoustic features) than those used in the method (988 acoustic features) reported in this pa-per. In the previous study Hayakawa et al [3] only present an idea of detectingOn-TalkandOff-Talkusing different modal-ities (e.g., EEG gamma band, audio) instead of demonstrating and evaluating the results in detail, which this study covers.
7. CONCLUSION
The lowest frequency band{a10(0 Hz – 0.5 Hz)}of the EEG signal provides more accurate result than other frequency bands, and audio features provide the best results. The high frequencies reflect muscle artefacts, and the results indicate that high frequency (>40 Hz) bands of the EEG signal con-tribute significantly towards the detection of On-Talk and
Off-Talkutterances. Hence, the muscle artefacts in the EEG signal have a positive influence towards the detection of On-Talk and Off-Talk. A possible direction of future work is to explore muscle movements during On-Talk andOff-Talk
[image:4.612.73.544.77.234.2] [image:4.612.96.257.275.366.2]8. REFERENCES
[1] Daniela Oppermann, Florian Schiel, Silke Steininger, and Nicole Beringer, “Off-Talk – A Problem for
Human-Machine-Interaction?,” inProceedings of EUROSPEECH 2001
Scandi-navia: the 7th European Conference on Speech Communica-tion and Technologyand the 2nd INTERSPEECH Event, Aal-borg, Denmark, 2001, pp. 2197–2200, ISCA.
[2] Anton Batliner, Christian Hacker, and Elmar N¨oth, “To talk or
not to talk with a computer: On-Talk vs. Off-Talk,” inHow
People Talk to Computers, Robots, and Other Artificial Com-munication Partners, Hansewissenschaftskolleg, Delmenhorst, Germany, 2006, pp. 79–100, SFB/TR 8 Spatial Cognition.
[3] Akira Hayakawa, Fasih Haider, Saturnino Luz, Loredana Cer-rato, and Nick Campbell, “Talking to a system and oneself: A study from a Speech-to-Speech, Machine Translation
medi-ated Map Task,” inProceedings of Speech Prosody 2016 (SP8),
Boston, Massachusetts, USA, 2016, pp. 776–780, ISCA.
[4] Hasan Ocak, “Automatic detection of epileptic seizures in EEG using discrete wavelet transform and approximate entropy,”
Expert Systems with Applications, vol. 36, no. 2, pp. 2027– 2036, 2009.
[5] Hojjat Adeli, Samanwoy Ghosh-Dastidar, and Nahid Dadmehr, “A Wavelet-Chaos Methodology for Analysis of EEGs and
EEG Subbands to Detect Seizure and Epilepsy,” Biomedical
Engineering, IEEE Transactions on, vol. 54, no. 2, pp. 205– 211, 2007.
[6] Panagiotis C Petrantonakis and Leontios J Hadjileontiadis, “Emotion Recognition From EEG Using Higher Order
Cross-ings,”Information Technology in Biomedicine, IEEE
Transac-tions on, vol. 14, no. 2, pp. 186–197, 2010.
[7] Anne Porbadnigk, Marek Wester, and Tanja Schultz Jan-p Cal-liess, “EEG-based Speech Recognition – Impact of Temporal
Effects,” inBIOSIGNALS 2009 - Proceedings of the
Interna-tional Conference on Bio-inspired Systems and Signal
Process-ing, Porto, Portugal, 2009, pp. 376—381, INSTICC Press.
[8] WJ Ray and HW Cole, “EEG Alpha Activity Reflects
At-tentional Demands, and Beta Activity Reflects Emotional and
Cognitive Processes,” Science, vol. 228, no. 4700, pp. 750–
752, 1985.
[9] Robert D O’Donnell, Jan Berkhout, and W Ross Adey, “Contamination of scalp EEG spectrum during contraction of
cranio-facial muscles,” Electroencephalography and clinical
neurophysiology, vol. 37, no. 2, pp. 145–151, 1974.
[10] Shrawan Kumar, Yogesh Narayan, and Tyler Amell, “Power spectra of sternocleidomastoids, splenius capitis, and upper
trapezius in oblique exertions,” The Spine Journal, vol. 3, no.
5, pp. 339–350, 2003.
[11] Eleanor Criswell,Cram’s Introduction to Surface
Electromyo-graphy, Jones & Bartlett Publishers, Sudbury, Massachusetts, USA, 2010.
[12] De Maarten Vos, Stephanie Ri`es, Katrien Vanderperren, Bart Vanrumste, Francois-Xavier Alario, Van Sabine Huffel, and Boris Burle, “Removal of muscle artifacts from eeg
record-ings of spoken language production,” Neuroinformatics, vol.
8, no. 2, pp. 135–150, 2010.
[13] Barbara E Shapiro and Martha Danly, “The role of the right hemisphere in the control of speech prosody in propositional
and affective contexts,”Brain and language, vol. 25, no. 1, pp.
19–36, 1985.
[14] Sandra Weintraub, M-Marsel Mesulam, and Laura Kramer, “Disturbances in Prosody: A Right-Hemisphere Contribution
to Language,”Archives of Neurology, vol. 38, no. 12, pp. 742–
744, 1981.
[15] Elliott D Ross and Marek-Marsel Mesulam, “Dominant Lan-guage Functions of the Right Hemisphere? Prosody and
Emo-tional Gesturing,” Archives of Neurology, vol. 36, no. 3, pp.
144–148, 1979.
[16] Akira Hayakawa, Fasih Haider, Loredana Cerrato, Nick
Camp-bell, and Saturnino Luz, “Detection of Cognitive States
and Their Correlation to Speech Recognition Performance in
Speech-to-Speech Machine Translation Systems,” in
Pro-ceedings of INTERSPEECH’15, Dresden, Germany, 2015, pp. 2539–2543, ISCA.
[17] Moritz Matejka, Philipp Kazzer, Maria Seehausen, Malek Ba-jbouj, Gisela Klann-Delius, Gisela, Winfried Menninghaus, Arthur Jacobs, Hauke Heekeren, and Kristin Prehn, “Talk-ing about Emotion: Prosody and Skin Conductance Indicate
Emotion Regulation,”Frontiers in Psychology, vol. 4, pp. 260,
2013.
[18] Jean Gotman, “High frequency oscillations: The new EEG
frontier?,”Epilepsia, vol. 51, no. 0 1, pp. 63–65, 2010.
[19] T. F. Oostendorp, J. Delbeke, and D. F. Stegeman, “The con-ductivity of the human skull: results of in vivo and in vitro
measurements,” IEEE transactions on bio-medical
engineer-ing, vol. 47, no. 11, pp. 1487–1492, 2000.
[20] Anne H. Anderson, Miles Bader, Ellen Gurman Bard, Eliz-abeth Boyle, Gwyneth Doherty, Simon Garrod, Stephen Is-ard, Jacqueline Kowtko, Jan McAllister, Jim Miller, Catherine Sotillo, Henry S. Thompson, and Regina Weinert, “The HCRC
Map Task Corpus,” Language and Speech, vol. 34, no. 4, pp.
351–366, 1991.
[21] Akira Hayakawa, Saturnino Luz, Loredana Cerrato, and Nick Campbell, “The ILMT-s2s Corpus — A Multimodal
Interlin-gual Map Task Corpus,” inProceedings of the Tenth
Inter-national Conference on Language Resources and Evaluation (LREC 2016). 2016, pp. 605–612, European Language Re-sources Association (ELRA).
[22] Herbert H Jasper, “The ten-twenty electrode system of the
In-ternational Federation,” Electroencephalography and clinical
neurophysiology, vol. 10, pp. 371–375, 1958.
[23] Florian Eyben, Felix Weninger, Florian Gross, and Bj¨orn Schuller, “Recent Developments in openSMILE, the Munich
Open-Source Multimedia Feature Extractor,” inProceedings
of the 21st ACM International Conference on Multimedia, New York, NY, USA, 2013, MM ’13, pp. 835–838, ACM.
[24] Mengyi Liu, Ruiping Wang, Shaoxin Li, Shiguang Shan, Zhiwu Huang, and Xilin Chen, “Combining Multiple Kernel Methods on Riemannian Manifold for Emotion Recognition in
the Wild,” inProceedings of the 16th International Conference
on Multimodal Interaction, New York, NY, USA, 2014, ICMI ’14, pp. 494–501, ACM.
[25] Sarunas Raudys and Robert P. W. Duin, “Expected classifi-cation error of the Fisher linear classifier with pseudo-inverse
covariance matrix,” Pattern Recognition Letters, vol. 19, no.