Original Article
A primary study on T cell TCR β chain CDR3 spectral
sequence detection in MSM HIV infected patients
Zhifeng Li1, Wenge Tang1, Yulin Wang1, Yi Zeng2, Hongjun Zhang3, Wenjie Leng2, Liang Chen3, Qin Li3 1Chongqing Center Disease Control and Prevention, No 8 Changjiang 2 Road Yuzhong District, Chongqing, China; 2Chongqing Yuzhong District Center Disease Control and Prevention, No 254 Qixinggang Heping Road Yuzhong
District, Chongqing, China; 3Chongqing Yongcuan District Center Disease Control and Prevention, No 471 Huilong
Road Yongcuan District, Chongqing, China
Received January 26, 2016; Accepted May 5, 2016; Epub June 15, 2016; Published June 30, 2016
Abstract: The spectratyping of TRBV CDR3 have been applied in infectious diseases, autoimmune diseases and cancer. In this study, we used fluorescence quantitative PCR melting curve to analysis TCR CDR3 spectrum in periph-eral blood samples of 41 healthy males and 33 sex with men (MSM) HIV infected patients. We aimed to evaluate the change in TCR β chain CDR3 and molecular features of HIV specific TCR TRBV family gene in the peripheral blood of HIV patients. Our results showed that MSM HIV infected patients had higher TRBV3, TABV7, TRBV9, TRBV20 and TRBV24 mono (oligo) expression rates compared with healthy male population. The difference was statistically significant by one-way ANOVA analysis (p<0.05). MSM HIV infected patients had higher TRBV subfamily miss rates (4.25%) than the healthy male control group (0.52%, chi-square test, χ2=16.73, p<0.05). We concluded that it is the first time in China to use the fluorescence quantitative PCR melting curve analysis to investigate the changes of TCR β chain CDR3 in HIV infected patients. Our results demonstrated that there was single (oligo) hyperplasia and dele-tion of the TCR BV family in MSM HIV infected patients, and there is statistically different TRBV distribudele-tion between MSM HIV infected patients and healthy population.
Keywords: HIV infection, TCR, CDR3, spectrum drift, fluorescence quantitative PCR melting curve analysis
Introduction
TCR CDR3 spectral patterns can well reflect the response and tolerance of T cells in infection, autoimmunity, and cancers. In recent years, the relationship between various viral infec-tions and T cell response has been further clari-fied. Now specific TCR β chain CDR3 sequences have been found in HBV, HCV, EBV and other viral infectious diseases. Some results have been used in immune response mechanisms of the body to viruses, and to find out virus-specif-ic T cell epitopes. Although it is known that abnormal changes occur in TCR CDR3 region in different periods of HIV-1 infection, the charac-teristics of TCR change at a specific period and in a particular course needs further study. Besides, there is no domestic report on the characteristics and application of TCR β chain CDR3 molecules of this group of T cells. The technique of “fluorescence quantitative PC- R melting curve analysis to monitor TCR CDR3
spectral drift in HIV-infected patients” has been established in our laboratory [1], we investigat-ed the changes of TCR β chain CDR3 in the peripheral blood samples of 41 healthy males and 33 MSM HIV infected patients in Chongqing, to identify HIV-specific TCR TRBV families. In addition, we selected part of single/oligo-clonal proliferative T cells for CDR3 gene sequencing, to primarily investigate the changes in TCR β chain CDR3 spectrum. These findings suggest-ed that TCR CDR3 spectral patterns is a useful method for studying T-cell immune response mechanism, disease process and personalized treatment in HIV infected patients.
Materials and methods
Main reagents and instruments
Mix (TOYOBO). Fluorescence PCR instrument (Hangzhou Bioer FQ48), gel imaging system (ChemiDocXRS), high-speed freezing centrifuge (Sigma 3K15), PAC300 electrophoresis appa-ratus (Bio-Rad), DG-3C electrophoresis tank (Beijing Ding Guo) and so on.
Primer design and synthesis
Primer design, sequence and synthesis are seen in literature [1]. 26 TCR BV gene family upstream primers, 1 TCR BC downstream labeled primer, and 1 control TRBC upstream primer were synthesized; the control GAPDH upstream and downstream primers (P1: cgac-cactttgtcaagctca, P2: aggggtctacatggcaact) were synthesized by Shanghai Invitrogen Bio- technology Co., Ltd.
Study subjects
Subjects were males aged from 18-40 years old. They were all from various districts and counties of Chongqing, native Chongqing Han people, and had no blood relationships. On inquiry, those with a family genetic history, autoimmune diseases, viral hepatitis and other recent infections were ruled out. Among them, the HIV infected patients were HIV/AIDS MSM people confirmed as HIV-1 antibody positive by Western Blot (WB) in Chongqing Municipal Center for Disease Control and Prevention AIDS Confirmation Center Laboratory, and receiving CD4+T lymphocyte monitoring in Chongqing Mu- nicipal Center for Disease Control and Preven- tion from 2012-2014, including past infection and newly discovered infection. A total of 33 cases were included, aged 18-40 years old, 32 years old on average. The 41 cases in the con-trol group were healthy males from health examination, aged 18-38 years old, and 29 years old on average. Before blood sample col-lection, we got consent from all the subjects and investigated and gathered their basic information.
Lymphocyte separation, total RNA extraction and cDNA synthesis
Lymphocytes separation, total RNA extraction and cDNA synthesis (with OligdT as primers, reaction system 20 μl) were completed
accord-ing to kit instructions. The cDNA synthesized was stored at -20°C for further use.
FQ-PCR amplification of the cDNA in TRBV fam-ily CDR3 segments
Reaction volume 20 ul. Reaction conditions: 94°C 3 min, 1 cycle; 94°C 30 sec, 55°C 30 sec, 72°C 50 sec, 45 cycles; 72°C 10 min 1 cycle. Melting curve analysis: 75°C~95°C, read fluo-rescence 0.2°C/s, 100 cycle. With GAPDH expression of red blood cells as the relative amount standard, calculate the relative expres-sion of each TRBV family.
Criteria of TCR melting curve method CDR3 spectrum distribution and expression fre-quency
According to literature [2], in this study, on the peak gram of TCR melting curve CDR3 spec-trum distribution and expression frequency, the standard of mono peak, oligo peak and no peak were as follows: “mono peak” (monoclonal): the emergence of a significant single peak, and its relatively “derivative (-dF/dT)” is greater than 85 or more; “oligo peak”: in non-standard Gau- ssian distribution family, there was a notable abnormal peak, the relative “derivative (-dF/ dT)” is greater than 85; “no peaks” (deletion): there is no standard Gaussian, and no obvious peak, the relative “derivative (-dF/dT)” is less than 30.
Oligoclonal and abnormal distribution expres-sion TRBV family selection and sequencing
According to criteria, count the “mono peak” (monoclonal), “oligo peaks” (polyclonal) and “no peak” (expression loss) of each family from TRBV1 to TRBV24. Data were statistically ana-lyzed to find out the difference of TRBV family abnormal distribution and expression in MSM HIV infected patients. At the same time, the TRBV families with statistical difference were sequenced.
Relative expression amount analysis of each TRBV family
expres-sion amount of each TRBV family. Analyze the
[image:3.612.99.523.73.618.2]expression situation of each TRBV family in MSM HIV infected patients and healthy people.
Statistical methods
Statistical analysis was performed by one- way ANOVA analysis of variance with Tukey’s
multiple comparison tests and non-parametric
[image:4.612.100.522.73.621.2]chi-square test by using the Statistical Package for the Social Sciences version 12.0 (SPSS). Two group differences were analyzed by
Student’s t-test. The p value (two-tailed) of less than 0.05 was considered statistically sig- nificant.
Results
FQ-PCR amplification of TRBV family CDR3 segment cDNA
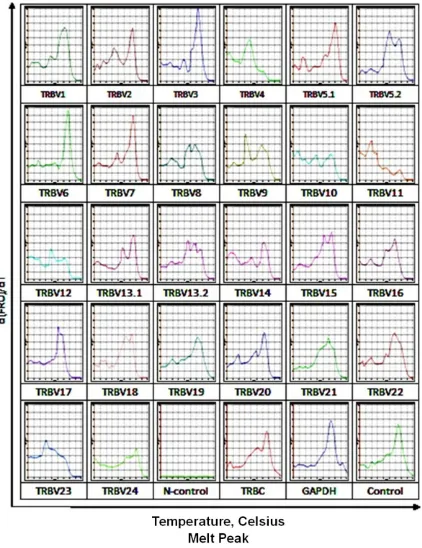
In the PBMC of most normal humans, the CDR3 spectral patterns of the 24 TCR β chains were multiple peaks. There was no mono peak, oligo peak or non-peak (eg. normal person-1, N-1). MSM HIV infected patients had oligo peak, par-tial peak and non-peak phenomena (eg. HIV infected patient-1, P1). The TRAC and GAPDH of a single product for control had mono peak pat-tern. The negative control had no melting curve peak (Figures 1, 2).
TRBV distribution and statistical analysis of MSM HIV infected patients and healthy popu-lation
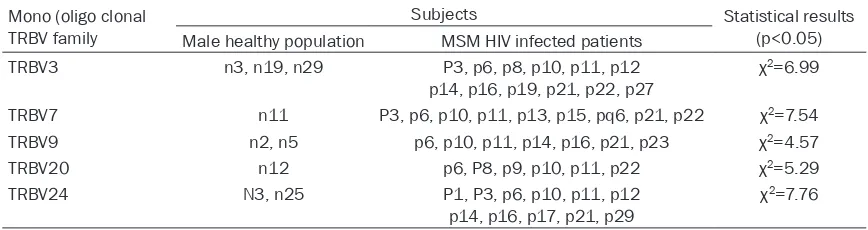
In this study we investigated the expression of each TRBV family in 41 healthy Chongqing Han males and 33 MSM HIV infected patients. Among them, TRBV3, TABV7, TRBV9, TRBV20 and TRBV24 with monoclonal or oligoclonal expression had statistically different distribu-tion in MSM HIV infected patients and healthy population (Table 1). The difference was statis-tically significant by chi-square analysis (p< 0.05).
Relative expression amount and statistical analysis of each TRBV family in MSM HIV in-fected patients and healthy population
The GAPDH expression level of healthy human red blood cells was used as the relative amount standard. Fluorescence signals were collected to calculate the relative expression amount of
each TRBV family in the subjects (results not shown). The relative expression amounts of the TRBV families who had statistically different abnormal expression in healthy population and MSM HIV infected patients in this study were statistically analyzed. Results showed that the relative expression amounts of each TRBV fam-ily with abnormal expression had no statistical-ly significant difference (Student’s t-test, P> 0.05).
Sequencing of monoclonal TRBV families in MSN HIV infected patients
TRBV3, TABV7, TRBV9, TRBV20 and TRBV24, which had higher abnormal expression rates in MSM HIV infected patients and statistically dif-ferent distribution compared to healthy popula-tion, were sent to a sequencing company for sequencing. TRBV3 and TRBV24 were success-fully sequenced (Sequence structure and func-tion analysis published in another paper). The sequencing results of TRBV7, TRBV9 and TRBV20 indicate that this product is not a sin-gle product, and cannot be sequenced. Discussions
The immune function of the body depends on the TCR antigen recognition function. For differ-ent antigens, the body can produce antigen specific TCR. According to the classical theory, when a gene is under positive selection, it is indicated that the population is in a new envi-ronment and the selection criteria has changed, needing new gene functions. When a gene is subjected to negative selection, the gene main-tain its original function and tend to be stable [3]. Currently CDR3 spectrum drift detection in infectious diseases, especially viral diseases, has become a hot topic. Home and abroad, there are many reports on TCR Vβ CDR3 change and infectious diseases. Human cytomegalovi-Table 1. TRBV with monoclonal or oligoclonal expression had statistically different distribution Mono (oligo clonal
TRBV family
Subjects Statistical results
(p<0.05) Male healthy population MSM HIV infected patients
TRBV3 n3, n19, n29 P3, p6, p8, p10, p11, p12
p14, p16, p19, p21, p22, p27 χ 2=6.99
TRBV7 n11 P3, p6, p10, p11, p13, p15, pq6, p21, p22 χ2=7.54
TRBV9 n2, n5 p6, p10, p11, p14, p16, p21, p23 χ2=4.57
TRBV20 n12 p6, P8, p9, p10, p11, p22 χ2=5.29
TRBV24 N3, n25 P1, P3, p6, p10, p11, p12
p14, p16, p17, p21, p29 χ
[image:5.612.89.523.85.200.2]rus infection (HCMV) Vβ specificity was 6.1, 6.2, 8, 13, etc. [4]; hepatitis B virus infection V β specificity was 12, 24, etc. [5]. Epstein-Barr virus infection (EBV) Vβ specificity was 2, 4, 16 etc. [6]; measles virus infection Vβ specificity was 5, 8 etc.; herpes simplex virus infection Vβ specificity was 2, 6, 7, 8, etc. [7, 8]. HIV virus infection Vβ specificity was 2, 3, 7, 9, etc. [9, 10]. However there is no report on HIV infection Vβ specificity in China yet.
At present studies have shown that HIV is closely related to T cell response and individual MHC type, but there have been no perfect HIV research animal model, systemic research methods and assessment tools. The TCR αβ T cell CDR3 length immune spectrum analysis technique we establish is a relatively reliable and simple way to analyze specific T cells. It is able to find single/oligoclonal proliferation T cells in a sample, provide composition informa-tion of T cell response library (partial peak and expression frequency change in different fami-lies), and dynamically monitor TCR change. To investigate the relationship between peripheral blood clonal proliferative T cell and HIV and its application, and to avoid information deviation from individual testing, we used Chongqing Han healthy males as the control, and test the PBMC of Chongqing Han MSM HIV infected patients for complete TCR BV CDR3 spectrum analysis. Results showed that in MSM HIV infected patients, the TCR BV families had mono (oligo) proliferation and absence phe-nomena, increased non-normal distribution, and decreased diversity. In MSM HIV infected patients, the mono (oligo) expression frequency of TRBV3, TABV7, TRBV9, TRBV20 and TRBV24 was higher than that in healthy male popula-tion. The difference was statistically significant by one-way ANOVA analysis (p<0.05). The RT-PCR products of the TRBV subfamilies above were sequenced, and results found out that some mono (oligo) hyperplasia expression TRBV products are mixtures of the same size (or a difference of about 3 bp leading to differ-ent sequence) instead of a single product. This phenomenon has also been reported abroad [6]. The investigation also found that MSM HIV infected patients had higher TRBV subfamily miss rate (4.25%) than the control group of healthy males (0.52%). There is a significant dif-ference between the two (χ2=16.73, p<0.05). We used GAPDH expression amount of healthy
human red blood cells as the relative amount standard, and collected fluorescence signals to calculate the relative expression amount of each TRBV family. However, results showed that the expression amount of each TRBV sub-family had no statistical difference between the healthy population and MSM HIV infected patients. Meanwhile, the relative expression amount of TRBV3, TABV7, TRBV9, TRBV20 and TRBV24 which had abnormal expression and statistical difference was not statistically differ-ent between the two monitoring groups. The possible reason is that the calculation of rela-tive expression was based on the relarela-tive quan-tification of fluorescent signals. All the fluores-cent signals that can be detected in the reac-tion tube were calculated, including the fluores-cence signals of a variety of amplified products. The mono/oligo clonal expression amount (fluo-rescent signal) was not reflected.
used in advantages of the individual patient, and some individuals also had a variety of TCR AV and TCR BV families of mono/oligoclonal expression at the same time (such as the HIV infected patients numbered p6 and p8). This may be associated with different HLA pheno-types of the individual and diversity of HIV antigens.
When the same virus infects different popula-tion, there is different family predomination uti-lization (TRBV, TRBJ and TRBD). This suggests T cell bias, and is closely related to the diversity of HLA and virus CTL epitopes. The change and predominant expression of TCR Vβ family are different in HIV infected patients. This may be associated with different HLA in different eth-nicity and regions, as well as the diversity of virus CTL epitopes. It may also due to that the single antigen epitope can induce clonal prolif-eration of T lymphocytes of different TCR CDR3 [14]. Further researches are required to deter-mine whether TCR B-chain-specific shift in HIV and other viral infections is due to predominant expression after virus infection. Our study sug-gested that the technique of the fluorescence quantitative PCR melting curve analysis have potential as a diagnosis and therapeutic approach to monitor TCR β chain and CDR3 subfamily growth for HIV infected patients in clinical application.
Disclosure of conflict of interest
None.
Abbreviations
PCR, polymerase chain reaction; TCR, T cell receptor; CDR3, third complementarity region; TRBV, T-cell receptor beta-chain variable.
Address correspondence to: Dr. Zhifeng Li, Chong- qing Center Disease Control and Prevention, No 8 Changjiang 2 Road Yuzhong District, Chongqing, China. Tel: 8623-68803652; E-mail: qczfl@163.com
References
[1] Manfras BJ, Rudert WA, Trucco M and Boehm BO. Analysis of the alpha/beta T-cell receptor repertoire by competitive and quantitative family-specific PCR with exogenous standards and high resolution fluorescence based CDR3 size imaging. J Immunol Methods 1997; 210: 235-249.
[2] Yang XY, Xu D, Du J, Kamino H, Rakeman J and Ratech H. Rapid detection of clonal T-cell re-ceptor-beta gene rearrangements in T-Cell lym-phomas using the LightCycler-polymerase chain reaction with DNA melting curve analy-sis. J Mol Diagn 2005; 7: 81-88.
[3] Prince VE and Pickett FB. Splitting pairs: the diverging fates of duplicated genes. Nat Rev Genet 2002; 3: 827-837.
[4] Peggs K, Verfuerth S, Pizzey A, Ainsworth J, Moss P and Mackinnon S. Characterization of human cytomegalovirus peptide-specific CD8(+) T-cell repertoire diversity following in vitro restimulation by antigen-pulsed dendritic cells. Blood 2002; 99: 213-223.
[5] Maru Y, Yokosuka O, Imazeki F, Saisho H and Omata M. Analysis of T cell receptor variable regions and complementarity determining re-gion 3 of infiltrating T lymphocytes in the liver of patients with chronic type B hepatitis. Intervirology 2003; 46: 277-288.
[6] Lim A, Trautmann L, Peyrat MA, Couedel C, Davodeau F, Romagne F, Kourilsky P and Bonneville M. Frequent contribution of T cell clonotypes with public TCR features to the chronic response against a dominant EBV-derived epitope: application to direct detection of their molecular imprint on the human pe-ripheral T cell repertoire. J Immunol 2000; 165: 2001-2011.
[7] Barcy S, Huang ML, Corey L and Koelle DM. Longitudinal analysis of herpes simplex virus-specific CD4+ cell clonotypes in infected tis-sues and blood. J Infect Dis 2005; 191: 2012-2021.
[8] Trentin L, Zambello R, Facco M, Sancetta R, Cerutti A, Milani A, Tassinari C, Crivellaro C, Cipriani A, Agostini C and Semenzato G. Skewing of the T-cell receptor repertoire in the lung of patients with HIV-1 infection. AIDS 1996; 10: 729-737.
[9] Boldt-Houle DM, Rinaldo CR Jr and Ehrlich GD. Random depletion of T cells that bear specific T cell receptor V beta sequences in AIDS pa-tients. J Leukoc Biol 1993; 54: 486-491. [10] Kou ZC, Puhr JS, Wu SS, Goodenow MM and
Sleasman JW. Combination antiretroviral ther-apy results in a rapid increase in T cell receptor variable region beta repertoire diversity within CD45RA CD8 T cells in human immunodefi-ciency virus-infected children. J Infect Dis 2003; 187: 385-397.
[14] Ishikawa T, Kono D, Chung J, Fowler P, Theofilopoulos A, Kakumu S and Chisari FV. Polyclonality and multispecificity of the CTL re-sponse to a single viral epitope. J Immunol 1998; 161: 5842-5850.
[12] Raaphorst FM, Schelonka RL, Rusnak J, Infante AJ and Teale JM. TCRBV CDR3 diversity of CD4+ and CD8+ T-lymphocytes in HIV-infected individuals. Hum Immunol 2002; 63: 51-60.