Original Article
Application of real-time elastography in evaluation of
hashimoto thyroiditis progression
Jianhong Wang1, Yiying Wang2, Fengxia Yu3, Shibao Fang3, Xuejun Liu4
1Organ Transplantation Center, 3Department of Ultrasound, 4Department of Radiology, The Affiliated Hospital
of Qingdao University, Qingdao 266003, Shandong, China; 2Department of Ultrasound, The Central Hospital of
Qingdao, Qingdao 266042, Shandong, China
Received November 27, 2015; Accepted February 15, 2016; Epub March 15, 2016; Published March 30, 2016
Abstract: This study aimed to assessment of Hashimoto thyroiditis (HT) progression by real-time elastography (RTE). RTE showed that eight out of 12 parameters had a significant difference between healthy controls and HT patients (all P<0.05). HT in hyperthyroidism, euthyroidism, or hypothyroidism group had a significantly increase in the ratio of the blue area (% Area) and elastic index (EI) compared with those of the control group (all P<0.05). Besides, the % Area and the EI positively correlated with the thyroid function of HT patients (r=0.851, P<0.05 for % Area and r=0.865, P<0.05 for elastic index). The cut-off point of the diagnostic accuracy of EI in determining the stage of hyperthyroidism, hypothyroidism was 1.37, 1.62, respectively, and the area under ROC (AUC) was 0.859 with a sensitivity of 80.8% and specificity of 81.0%, 0.871 with a sensitivity of 82.0% and specificity of 83.0%, respectively.
Keywords: Hashimoto thyroiditis, chronic lymphocytic thyroiditis, real-time elastography
Introduction
Hashimoto thyroiditis (HT) is one of the most common autoimmune diseases characterized as high titers of circulating antibodies to thyroid peroxidase and thyroglobulin [1]. The typical microscopic changes of Hashimoto thyroiditis include lymphoplasmacytic infiltration and fibrosis [1]. The gland undergoes progressive loss of thyroid follicular cells, which gradually progresses to the stage of hypothyroidism [2]. Growing evidence has suggested that unrecog-nized hypothyroidism is deleterious, and early diagnosis of HT could be advantageous in pre-dicting thyroid failure due to massive thyroid tissue damage [3].
Under traditional sonography, the thyroid gland of HT patients usually shows diffusely enlarged gland with inhomogeneous echogenicity and a general decrease in echogenicity [4, 5]. Such examination is not capable in picking up the subtle signs of the disease [4, 5]. Therefore, fine-needle aspiration and cytology examina -tion currently is recommended as the gold standard in determining the progression of HT.
Materials and methods
Patients
A total of HT 118 patients (12 males and 106 females with an average age of 39.5±11.5 years old) were recruited as HT group in the cur-rent study. Patients received diagnosis and treatment from October 2012 to July 2013 in the Affiliated Hospital of Qingdao University. These patients were diagnosed as HT based on their clinical symptoms, laboratory data and sonographic image. Fifty healthy controls including 5 males and 45 females with an aver-age aver-age of 36.7±10.5 years old were also enrolled. These controls had no reported thy-roid diseases when they were recruited in the current study. According to the thyroid function tests, these 118 HT patients were further divid-ed into three groups: (1) hyperthyroidism group (n=29), (2) euthyroidism group (n=38) and (3) hypothyroidism group (n=51).
The research protocol was approved by the eth-ics committee of the Affiliated Hospital of Qingdao University. Written informed consent was obtained from each patient.
Real-time elastography (RTE)
RTE was performed using Hivision Preirus sys-tem (Hitachi Medical Corporation 4-14-1, Soto-kanda, Chiyoda-ku, Tokyo, 101-0021, Japan) with a linear probe (EUP-L52; central frequency 5.5 MHz). The US pattern of the thyroid paren-chyma was recorded for each scan. All scans were performed by an operator with more than 5 years of experience in thyroid imaging. After the examination in B-mode, the mode was switched to elastography. The probe was placed on the neck and scanned vertically from the thyroid to observe a longitudinal section of the right thyroid lobe. An identical area where the thyroid tissue was free of large blood vessels was set as the region of interest (ROI) for all subjects. The colors in the ROI include red (soft tissue), blue (hard tissue) and green (intermedi-ate, normal tissue). The device automatically captured the internal compressions transmit-ted to the thyroid parenchyma by the carotid pulsation. Numerical strain values for the pixels were converted into a color image within the rectangle ranging from 0 (shown as red) at the minimal degree of stiffness to 255 (shown as blue) at the maximal degree of stiffness, and a histogram was then generated based on the
The model applying to the quantitative analysis of diffuse disease was chosen as a method of image measurement and analysis. Nine image features were extracted from each RTE scan-ning, including the mean of relative strain value (MEAN), standard deviation of the relative strain value (SD), ratio of the blue area in the analyzed region (% Area), complexity of the blue area (COMP), kurtosis of the strain his-togram (KURT), skewness of the strain histo-gram (SKEW), entropy (ENT), inverse difference moment (IDM) and angular second moment (ASM). These above parameters reflect the tis -sue stiffness using RTE. Multiple regression analysis was then performed with these nine image features to quantify the elastic index (LF Index), according to the following formula: elas-tic index (LF Index) = -0.00897 × MEAN - 0.00502 × SD + 0.0232 × % AREA + 0.0253 × COMP + 0.775 × SKEW - 0.281 × KURT + 2.08 × ENT + 3.04 × IDM + 40.0 × ASM - 5.54 as reported before.
Blood test
Blood biochemistry was performed at the enrollment including thyroid stimulating hor-mone (TSH), free triodothyronine (FT3), free thy-roxine (FT4), antithyroid peroxidase (anti-TPO), antithyroglobulin (anti-Tg). The present study was performed in accordance with the ethical guidelines of the Declaration of Helsinki and was approved by the institutional ethics board of the Affiliated Hospital of Qingdao University. Statistical analysis
All results were shown as mean ± SD. Spearman’s test was used to analyze the cor-relation between elasticity parameters from RTE and different thyroid functional parame-ters. Statistical significance was defined as P<0.05. The diagnostic performance of the elasticity index was evaluated by receiver oper-ating characteristic curves (ROC). The ROC curve represents sensitivity versus 1 minus the specificity for all possible cut off values. The areas under the ROC curve (AUCs) and 95% CIs of AUC were calculated by SPSS (16.0 version).
Results
Clinical characteristics of HT patients and con-trols in this study
of them are males and the remaining 106 are females. Symptoms of patients with HT were vague and non-specific. Detailed clinical char
[image:3.629.99.534.93.161.2]-ticity (r=0.851, P=0.001). Further, except the 4 out of the remaining 11 elasticity parameters including COMP, IDM, ASM and CORR, HT
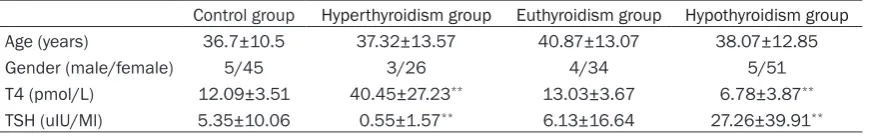
Table 1. Clinical characteristics of HT patients and controls in this study
Control group Hyperthyroidism group Euthyroidism group Hypothyroidism group
Age (years) 36.7±10.5 37.32±13.57 40.87±13.07 38.07±12.85
Gender (male/female) 5/45 3/26 4/34 5/51
T4 (pmol/L) 12.09±3.51 40.45±27.23** 13.03±3.67 6.78±3.87** TSH (uIU/Ml) 5.35±10.06 0.55±1.57** 6.13±16.64 27.26±39.91**
**P<0.01 vs. control group.
Table 2. Twelve parameters used to evaluate the thyroid tissue stiff-ness and elasticity from RTE
Control group Hyperthyroidism group Euthyroidism group Hypothyroid-ism group AREA% 3.23±1.07 7.23±3.92* 11.87±2.53* 18.78±4.12* MEAN 134.56±6.63 122.20±5.50* 116.11±5.98* 110.29±7.68* SD 38.02±3.63 41.68±5.93* 45.48±3.84* 50.37±5.41* COMP 23.73±8.31 20.72±3.63 23.61±4.22 25.25±4.29 KUET 2.91±0.27 2.62±0.19* 2.61±0.18* 2.54±0.25* SKEW 0.09±0.16 0.11±0.16* 0.21±0.19* 0.35±0.19* CONT 38.72±0.06 43.95±10.19* 50.27±10.93* 63.94±13.66* ENT 3.46±0.06 3.51±0.08* 3.55±0.6* 3.59±0.07* IDM 0.19±0.01 0.19±0.02 0.19±0.02 0.19±0.02 ASM 0.00±0.00 0.00±0.00 0.00±0.00 0.00±0.00
CORR 0.98 0.98 0.98 0.98
Elastic index 0.64±0.19 1.11±0.34* 1.48±0.25* 1.89±0.26*
*P<0.05 vs. control group.
acteristics of HT patients and controls are shown in
Table 1.
RTE analysis of thyroid elasticity in four groups
Twelve parameters reflect -ing the thyroid tissue stiff-ness from B-mode images were analyzed and summa-rized in Table 2, with a rep-resentative image from one HT patients shown in Figure 1. The uniform green from B-mode images indicated a normal level of elasticity, while blue area suggested a gradually in- crease in elasticity. % Area was defined as the per -centage of blue area in the analyzed thyroid tissue from a B-mode image. RTE showed that the blue area in the analyzed region (% AREA) were 3.23± 1.07%, 7.23±3.92%, 11.87 ±2.53% and 18.78±4.12% in control, hyperthyroidism
group, euthyroidism group
and hypothyroidism group.
The % Area in the latter three groups (HT groups) were significantly higher than that of the control group (all P<0.05) (Table 2). Besides, there was a significant correlation be-tween the thyroid dysfunc-tion (hypothyroidism) and % Area of decreased elas-Figure 1. Eleven parameters and tissue elasticity distribution represented as
[image:3.629.98.397.437.641.2]patients had a significantly different levels of elasticity compared with those of healthy trols (all P<0.05 in all three HT groups vs. con-trols for the 7 parameters shown in Table 2). The decreased elasticity of thyroid tissue was associated with a gradual deterioration of thy-roid function (Table 2).
In addition, elasticity index calculated based on the 12 elasticity parameters were 0.64±0.19, 1.11±0.34, 1.48±0.25 and 1.89±0.26 in con-trol, hyperthyroidism, euthyroidism and hypo-thyroidism group (Table 2). Further, the elastic-ity also showed a significant correlation between elasticity indexes and clinical progres-sion of thyroid function (r=0.865, P=0.001). Accuracy evaluation of RTE in the assessment of thyroid function of HT patients
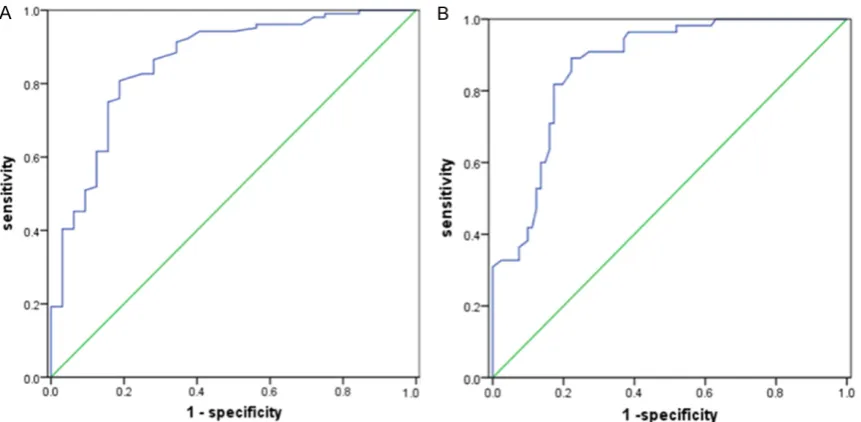
The cut-off point of elasticity index in accurately assess the phase of hyperthyroidism in HT patients was 1.37 and the area under ROC (AUC) was 0.859 with a sensitivity of 80.8% and a specificity of 81.0% (Figure 2A). The cut-off point of elasticity index in accurately assess the phase of hypothyroidism was 1.62 and the AUC was 0.871 with a sensitivity of 82.0% and a specificity of 83.0% (Figure 2B).
Discussion
HT is an autoimmune thyroid disease that can induce goiter and/or thyroid dysfunction. HT
roid in both children and adult patients [2, 10]. HT patients usually have diffuse goiter with hard consistency at palpation. As HT progress-es, thyroid tissue of HT patients has diffusely decreased echogenicity, coupled with a varying extent of fibrosis on ultrasound [11]. Fine-needle aspiration and cytology examination are currently recommended as the golden stan-dard to determine the clinical progression of Hashimoto thyroiditis. Thus, an invasive meth-od has been needed for the HT severity evalua-tion and disease progression.
RTE combines the advantages of high frequen-cy ultrasound have been used in evaluating the stiffness and elasticity of tissues other than thyroid [12]. Recently, elastography has been mainly applied in the differential diagnostics of thyroid nodular disease rather than HT which is characterized as a disease with diffused lesion [13-15]. So far, little has been known about the value of sonoelastographic image in the assess-ment of diffuse thyroid diseases.
[image:4.629.101.532.79.290.2]with 11 different parameters [9]. Further, they reported that there was a significant correla -tion between the elasticity index and the histo-logical fibrosis degree with high accuracy.
In our study, we applied this new quantitative technology to the evaluation of clinical progres-sion of HT, another disease with diffused leprogres-sion. We found a significantly increased area with less elasticity of thyroid tissue in HT patients which further correlated with the thyroid func-tion. As the disease progresses, thyroid tissue has an increased lymphoplasmacytic infiltra -tion and stromal fibrosis, which ultimately leads to the increased stiffness of thyroid and then thyroid failure. In the study carried out by Ruchala et al. [17], they applied this new quan-titative technology sonoelastography in acute thyroiditis, sub-acute thyroiditis, and chronic autoimmune thyroiditis, and further proposed such technology as a useful way in differentiat-ing various types of thyroiditis.
There were some limitations in this study. First, the number of patients recruited in this study was relatively small. A larger scale study was needed. Secondly, this study demonstrated a general difference of thyroid function of HT patients using elastographic images. Hence, a further detailed description of RTE images and its correlation with drug treatment would be an interesting topic to be studied.
Conclusion
Data from current study showed that RTE with a new quantitative methodology for diffused pathological lesion of thyroid is a useful way to evaluate thyroid elasticity. Elastic indexes from RTE also associated with thyroid function. Therefore, RTE could be a useful method in dif-ferentiating thyroid functional stage and moni-toring thyroid function in HT patients.
Acknowledgements
This study was funded by the Foundation for Outstanding Young Scientist in Shandong Province Grant BS2013YY053 and the Qingdao Research Foundation for Basic Research of China Grant KJ2D-13-38-JCH.
Disclosure of conflict of interest
None.
Address correspondence to: Dr. Xuejun Liu, De- partment of Radiology, The Affiliated Hospital of Qingdao University, 16 Jiangsulu Road, Shinan District, Qingdao 266003, Shandong, China. Tel: +86-18661802536; E-mail: [email protected]
References
[1] Zeppa P, Cozzolino I, Peluso AL, Troncone G, Lucariello A, Picardi M, Carella C, Pane F, Vetrani A, Palombini L. Cytologic, flow cytome-try, and molecular assessment of lymphoid in-filtrate in fine-needle cytology samples of Hashimoto thyroiditis. Cancer 2009; 13: 174-84.
[2] Surks MI, Ortiz E, Daniels GH, Sawin CT, Col NF, Cobin RH, Franklyn JA, Hershman JM, Burman KD, Denke MA, Gorman C, Cooper RS, Weissman NJ. Subclinical thyroid disease: sci-entific review and guidelines for diagnosis and management. JAMA 2004; 291: 228-38. [3] Vaidya B, Anthony S, Bilous M, Shields B, Drury
J, Hutchison S, Bilous R. Detection of thyroid dysfunction in early pregnancy: Universal screening or targeted high-risk case finding. Clin Endocrinol Metab 2007; 92: 203-7. [4] Simeone JF, Daniels GH, Mueller PR.
High-resolusion real-time sonography of the thyroid. Radiology 1982; 145: 431-35.
[5] Solbiati L, Volterrani L, Rizzatto G. The thyroid gland with low uptake lesions: evaluation by ultrasound. Radiology 1985; 155: 187-91. [6] Giuseppetti GM, Martegani A, Di Cioccio B,
Baldassarre S. Elastosonography in the diag-nosis of the nodular breast lesions: prelimi-nary report. Radiol Med 2005; 110: 69-76. [7] Konig K, Scheipers U, Pesavento A, Lorenz A,
Ermert H, Senge T. Initial experiences with real time elastography guided biopsies of the pros-tate. J Urol 2005; 174: 115-7.
[8] Kanamoto M, Mitsuo S, Toru I. Real time elas-tography for noninvasive diagnosis of liver fi-brosis. J Hepatobiliary Pancreat Surg 2009; 16: 463-7.
[9] Wang J, Guo, L, Shi X, Pan W, Bai Y, Ai H. Real-time elastography with a novel quantitative technology for assessment of liver fibrosis in chronic hepatitis B. Eur J Radiol 2012; 81: 31-6.
[10] Radetti G, Gottardi E, Bona G, Corrias A, Salardi S, Loche S; Study Group for Thyroid Diseases of the Italian Society for Pediatric Endocrinology and Diabetes (SIEDP/ISPED). The natural his-tory of euthyroid Hashimoto’s thyroiditis in chil-dren. J Pediatr 2006; 149: 827-32.
time of acute exacerbation. Endocr J 2009; 56: 65-72.
[12] Lyshchik A, Higashi T, Asato R, Tanaka S, Ito J, Mai JJ, Pellot-Barakat C, Insana MF, Brill AB, Saga T, Hiraoka M and Togashi K. Thyroid gland tumor diagnosis at US elastography. Radiology 2005; 237: 202-11.
[13] Dighe M, Luo S, Cuevas C, Kim Y. Efficacy of thyroid ultrasound elastography in differential diagnosis of small thyroid nodules. Eur J Radiol 2013; 2: 274-80.
[14] Vorländer C, Wolff J, Saalabian S, Lienenlüke RH, Wahl RA. Real-time ultrasound elastogra-phy-a noninvasive diagnostic procedure for evaluating dominant thyroid nodules. Lan- genbecks Arch Surg 2010; 395: 865-71.
[15] Hong Y, Liu X, Li Z, Zhang X, Chen M, Luo Z. Real-time ultrasound elastography in the dif-ferential diagnosis of benign and malignant thyroid nodules. J Ultrasound Med 2009; 28: 861-67.
[16] Friedrich-Rust M, Ong MF, Herrmann E, Dries V, Samaras P, Zeuzem S, Sarrazin C. Real-time elastography for noninvasive assessment of liver fibrosis in chronic viral hepatitis. Am J Roentgenol 2007; 188: 758-64.