ORIGINAL RESEARCH
FUNCTIONAL
Anatomic MR Imaging and Functional Diffusion Tensor Imaging
of Peripheral Nerve Tumors and Tumorlike Conditions
A. Chhabra, R.S. Thakkar, G. Andreisek, M. Chalian, A.J. Belzberg, J. Blakeley, A. Hoke, G.K. Thawait, J. Eng, and J.A. Carrino
ABSTRACT
BACKGROUND AND PURPOSE: A number of benign and malignant peripheral nerve tumor and tumorlike conditions produce similar imaging features on conventional anatomic MR imaging. Functional MR imaging using DTI can increment the diagnostic performance in differentiation of these lesions. Our aim was to evaluate the role of 3T anatomic MR imaging and DTI in the characterization of peripheral nerve tumor and tumorlike conditions.
MATERIALS AND METHODS: Twenty-nine patients (13 men, 16 women; mean age, 41⫾18 years; range, 11– 83 years) with a nerve tumor or tumorlike condition (25 benign, 5 malignant) underwent 3T MR imaging by using anatomic (n⫽29), functional diffusion, DWI (n⫽21), and DTI (n⫽24) techniques. Images were evaluated for image quality (3-point scale), ADC of the lesion, tractography, and fractional anisotropy of nerves with interobserver reliability in ADC and FA measurements.
RESULTS: No significant differences were observed in age (benign, 40⫾18 versus malignant, 45⫾19 years) and sex (benign, male/female⫽ 12:12 versus malignant, male/female⫽3:2) (P⬎.05). All anatomic (29/29, 100%) MR imaging studies received “good” quality; 20/21 (95%) DWI and 21/24 (79%) DTI studies received “good” quality. ADC of benign lesions (1.848⫾0.40⫻10⫺3mm2/s) differed from that of malignant
lesions (0.900⫾0.25⫻10⫺3mm2/s,P⬍.001) with excellent interobserver reliability (ICC⫽0.988 [95% CI, 0.976 – 0.994]). There were no
FA or ADC differences between men and women (P⬎.05). FA of involved nerves was lower than that in contralateral healthy nerves (P⬍
.001) with excellent interobserver reliability (ICC⫽0.970 [95% CI, 0.946 – 0.991]). ADC on DTI and DWI was not statistically different (P⬎
.05), with excellent intermethod reliability (ICC⫽0.943 [95% CI, 0.836 – 0.980]). Tractography differences were observed in benign and malignant lesions.
CONCLUSIONS: 3T MR imaging and DTI are valuable methods for anatomic and functional evaluation of peripheral nerve lesions with excellent interobserver reliability. While tractography and low FA provide insight into neural integrity, low diffusivity values indicate malignancy in neural masses.
ABBREVIATIONS:BPNST⫽benign peripheral nerve sheath tumor; CI⫽confidence interval; CMT⫽Charcot-Marie-Tooth disease; FA⫽fractional anisotropy; ICC⫽intraclass correlation coefficient; MPNST⫽malignant peripheral nerve sheath tumor
F
ocal or diffuse enlargement of the peripheral nerves can be caused by tumors, such as benign and malignant peripheral nerve sheath tumors, perineurioma, lipoma, ganglion cyst, fibrolipomatous hamartoma and lymphoma, or hypertrophic neuropathy, such as Charcot-Marie-Tooth disease.1,2Electrodiagnostic studies andclin-ical features can confirm neuropathy; however, high-resolution MR
imaging of peripheral nerves (also referred to as MR neurography) is often needed to localize and characterize the causative mass.3-6MR
imaging can be accomplished by using conventional (anatomic) techniques and diffusion-based (functional) techniques. 2D and 3D anatomic techniques are popular because they are not technically as challenging to perform as diffusion imaging.3-8Lipoma, ganglion
cyst, and fibrolipomatous hamartoma produce fairly diagnostic im-aging features with these techniques. However, other lesions such as BPNST, MPNST, lymphoma, perineurioma, and hypertrophic neu-ropathy frequently show similar features with nonspecific T2 hyper-intensity of nerves. Thus, differentiation of benign and malignant lesions can be difficult, even when suggested MR imaging features for malignancy, such as larger size, necrosis, hemorrhage, heterogeneous enhancement, and invasive margins, are present. Therefore, biopsy is often needed for definitive diagnosis.1,2,8-10
Received June 22, 2012; accepted after revision July 19.
From the Russell H. Morgan Department of Radiology and Radiological Science (A.C., R.S.T., M.C., G.K.T., J.E., J.A.C.), and Departments of Neurosurgery (A.J.B.) and Neurology (J.B., A.H.), Johns Hopkins Hospital, Baltimore, Maryland; and Diagnostic and Interventional Radiology (G.A.), Zurich University Hospital, Zurich, Switzerland. Please address correspondence to Avneesh Chhabra, MD, Russell H. Morgan De-partment of Radiology and Radiological Science, Johns Hopkins Hospital, 601 N Caroline St, Baltimore, MD 21287; e-mail: achhabr6@jhmi.edu
Diffusion-based MR neurography using DWI and DTI has the potential to overcome the limitations of anatomic MR imaging due to its ability to interrogate tissue microstructure.4,5,11 The
unique fibrillar structure of the nerve results in anisotropy in the proton movement across its long axis, which can be mapped to create tracts and calculate DTI parameters, such as fractional an-isotropy and apparent diffusion coefficient. In this original article, the authors evaluated both techniques with emphasis on diffusion imaging in the characterization of various peripheral nerve tu-mors and tumorlike conditions.
MATERIALS AND METHODS
Study SubjectsAfter institutional review board approval was granted, the records of our biweekly MR neurography conference (from October 2010 to April 2012) were reviewed, and 29 patients (13 men, 16 women; mean age, 41⫾18 years; age range, 11– 83 years) with a nerve tumor or tumorlike condition (25 benign, 5 malignant) were in-cluded in those for whom the final diagnosis was established. The cases either had surgical proof (7 schwannomas, 2 neurofibromas, 1 degenerated schwannoma, 1 perineurioma, 3 MPNSTs, 1 lym-phoma) and biopsy (6 schwannomas) or were diagnosed on the basis of clinical features, imaging characteristics, and stability up to 18-month follow-up,7or had genetic testing (1
Charcot-Marie-Tooth disease type 1A). Two patients had undergone prior sub-total excision surgery and had a residual schwannoma. Two pa-tients had underlying neurofibromatosis type 1. The lesions were distributed as follows: brachial plexus (n ⫽ 15), lumbosacral plexus (n⫽5), and peripheral nerves (n⫽10: three femoral, 1 sciatic, 1 radial, 2 elbow sensory, 1 axillary, 2 thoracic spinal). All patients presented with a variable combination of nonspecific re-gional symptoms of pain, weakness, and/or palpable mass. Mass lesions with pathognomonic appearances on anatomic MR imag-ing, such as internal fibrofatty proliferation (fibrolipomatous hamartoma), uniform fat (lipoma), and cystic lesion (ganglion cyst), were excluded.
MR Imaging
All imaging was performed on 3T MR imaging scanners (Magne-tom Verio or Trio; Siemens, Erlangen, Germany) by using multi-channel coil high-resolution 2D (T2 spectral-attenuated inver-sion recovery [SPAIR]: TR/TE/turbo factor [TF], 4500/80/17 ms; flip angle, 150°; section thickness, 4 mm; averages, 2; base resolu-tion, 704; in-plane resoluresolu-tion, 0.5 mm) and 3D (shortinversion recovery [STIR] and sampling perfection with application opti-mized contrasts by using different flip angle evolution [SPACE]: TR/TE/TF, 1500/103/61 ms; TI, 220 ms; section thickness, 1.0 mm; averages, 1.4; base resolution, 320; in-plane resolution, 1.0 mm) imaging. All patients had similar anatomic imaging (29/29, 100%), while 21/29 (72%) had DWI (b values 50, 400, and 800 s/mm2), and 24/29 (83%) had DTI (0, 800, 1000 s/mm2; 14/24
with 12 directions and 10/24 with 20 directions of interrogation).
Image Analysis
Two radiologists (A.C. with 14 years and R.S.T. with 4 years of radiology experience) interpreted all MR imaging studies. They
were blinded to the final diagnosis and used a dedicated worksta-tion (Leonardo; Siemens).
First, all images were assessed for motion, ghosting artifacts, and incomplete inclusion of the lesion. On the basis of a combi-nation of these findings, the quality of anatomic, DWI, and DTI scans was rated by using a 3-point scale as good (1), fair (2), and poor (3).
Second, the anatomic images were used for lesion localization and characterization and then were assessed in tandem with DWI and DTI to perform functional evaluation.
Third, the ADC of the lesion, particularly of the solid-appear-ing portion, was measured separately by both observers on DWI and DTI by manual placement of at least a 6- to 8-mm circular region of interest. The lowest ADC was recorded to encompass the greatest degree of restriction (cellularity).
Fourth, tensor calculation of the raw DTI and tractography was performed by using Neuro 3D syngo software (Siemens) by placing multiple seed points along the nerve. There is currently no standardization with regard to DTI evaluation, and the angle and FA thresholds were thus arbitrarily chosen, depending on the obliquity of the nerve and pathology.4,5,11We chose an FA
thresh-old (minimum value) of 0.2, an angle threshthresh-old (maximum turn-ing angle) of 45°, and a step length of 0.9 mm for all tractogra-phies. Fiber tracts were calculated by using the fourth-order Runge-Kutta algorithm. The postprocessing procedure took ap-proximately 20 minutes with a mean of 25⫾10 minutes. The manual placing of seed points avoided contamination from spu-rious tracts from adjacent muscles or slow-flowing veins.
Fifth, all fiber tract images were evaluated by both readers in consensus to decide if the reconstructed fiber tracts showed a normal appearance (similar thickness to the contralateral nerve or adjacent normal nerves with no disruption/deviation), near-nor-mal appearance (mininear-nor-mal variation in thickness with⬍25% dis-ruption of transverse fiber attenuation), partial discontinuity (moderate variation in thickness with 25%–75% disruption of transverse fiber attenuation), or near-complete/complete disrup-tion (severe variadisrup-tion in thickness with⬎75% disruption of trans-verse fiber attenuation).
Last, FA of the nerves was assessed separately by each observer independently by placing a user-defined 3- to 4-mm circular re-gion of interest on the axial parameter maps of the nerve proximal to mass lesion, and this was compared with the contralateral nerve. Three measurements were obtained, and the lowest FA was recorded to assess the maximal loss of anisotropy (potential ax-onal degeneration/demyelination).
Statistical Analysis
All data were stored on a spreadsheet (Excel 2010; Microsoft, Se-attle, Washington). Analysis was performed by using the Statisti-cal Package for the Social Sciences software (Version 18.0; SPSS, Chicago, Illinois). A nonparametric Wilcoxon rank-sum test was used for side-to-side and also between-group comparisons of the quantitative variables. A2or Fisher exact test was used for the
cor-relation coefficient (95% CI). Scores were interpreted on the basis of the values suggested by Shrout and Fleiss12with a score of
0 – 0.4 indicating poor reliability, 0.4 – 0.75 indicating moderate reliability, and⬎0.75 indicating excellent reliability.
RESULTS
Demographics, Image Quality, and Anatomic Appearance
There were no significant differences in terms of age (benign, 40⫾18 versus malignant, 45⫾19 years) and sex (benign, male/ female ⫽ 12:12 versus malignant, male/female ⫽ 3:2) (P⬎.05). All anatomic (29/29, 100%) MR imaging received a “good” quality, while 20/21 (95%) DWI and 19/24 (79%) DTI studies received a “good” quality. Three of 24 (13%) DTI studies received “fair” quality due to suboptimal SNR. Two of 24 (8%) DTI studies received a “poor” quality rating because no meaning-ful tracts could be generated due to incomplete lesion inclusion and ghosting artifacts. One of 21 (4%) DWI studies received fair quality. All masses were apparent on both anatomic imaging and DTI as hyperintense lesions. The lesions showed variable shapes (4 rounded, 15 oval, and 11 elongated) and heterogeneity (18/30, 60%). The lesions measured 5.94⫾6.45 mm (range, 0.8 –34.7 mm). None of the malignant lesions showed satellite lesions, local invasion, or distant metastases.
ADC and FA
Detailed results are shown in the Table. The ADC of benign le-sions (1.848⫾0.40⫻10⫺3mm2/s) differed from that of
malig-nant lesions (0.900⫾0.25⫻10⫺3mm2/s;P⬍.001) with
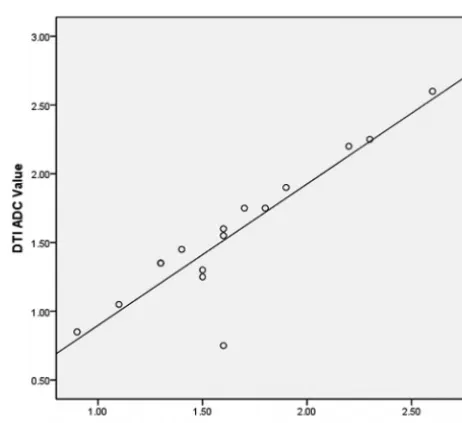
excel-lent interobserver reliability (ICC ⫽ 0.988 [95% CI, 0.976 – 0.994]). There were no ADC or FA differences between men and women (P⬎.05). The FA of involved nerves was lower than that of contralateral nerves (P ⬍.001) with excellent interobserver reliability (ICC⫽0.970 [95% CI, 0.946 – 0.991]). ADC measured on DTI and DWI techniques in the same patients (n⫽16) was not statistically different (P⬎.05), with a very good Pearson correla-tion (r⫽0.90,P⬍.001) and excellent intermethod reliability (ICC⫽0.943 [95% CI, 0.836 – 0.980]) (Fig 1). However, DWI ADC was not statistically different (P⬎.05; benign, 1.745⫾0.44
versus malignant, 1.267⫾0.35). Additionally, among the benign lesions, ADC (1.627⫾0.600) in 12-direction DTI was not statis-tically different from 20-direction DTI (1.520⫾0.390,P⬎.05).
Fiber Tractography
On tractography, no lesion had a normal appearance of the tract. Complete disruption was observed in 4 lesions: 1 degenerated schwannoma, 1 plexiform neurofibroma, and 2 MPNSTs. Partial disruption was seen in 8 lesions: 1 MPNST, 2 schwannomas, 3 BPNSTs, and 2 residual schwannomas (Figs 2 and 3). Near-nor-mal tracts in the background of nerve swelling were seen in 8 lesions: 1 lymphoma, 1 perineurioma, 2 (bilateral) nerves of CMT, 2 schwannomas, and 2 BPNSTs, (Figs 4 and 5). Due to oblique course of the nerves, the Neuro 3D syngo software did not reproduce color coding similar to the traditional red, green, blue colors used in brain tractography. Five of 25 (20%) lesions could not be traced due to suboptimal SNR/ghosting artifacts, and no meaningful tracts could be generated from those lesions.
Patient demographics and results
Patient Information Data
Demographics and imaging No.⫽29, male/female⫽13:16, mean age⫽41⫾18 yr, range⫽11–83 yr;a
characteristics left/right⫽9:21 lesions
DTI ADC⫽24 patients, DWI ADC⫽21 patients
No. of directions in DTI: 14 patients with 12, 10 patients with 20 directions, respectively Benign and malignant lesions Benign⫽25, malignant⫽5
No difference in terms of age (benign⫽40⫾18 versus malignant⫽45⫾19 yr), sex (benign, male/female⫽12:13 versus malignant, male/female⫽3:2) (P⬎.05), FA and ADC values (P⬎0.05);a
DTI ADC different (P⫽.001), benign⫽1.848⫾0.40 versus malignant⫽0.900⫾0.25⫻10⫺3mm2/s;a
DWI ADC not different (P⬎.05), benign⫽1.745⫾0.44 vs malignant⫽1.267⫾0.35⫻10⫺3mm2/s;a
Interobserver reliability ADC: ICC⫽0.988 (95% CI, 0.976–0.994), excellenta
Abnormal and contralateral normal FA significantly different (P⬍.001), abnormal⫽0.221⫾0.09, normal⫽0.344⫾0.12;a
nerves Interobserver reliability FA: ICC⫽0.970 (95% CI, 0.946–0.991), excellenta
DTI ADC among benign lesions between different (12 and 20) directions
Not statistically different (P⬎.05) DTI ADC on 12 directions: 1.627⫾0.600 DTI ADC on 20 directions: 1.520⫾0.390 DTI ADC and DWI ADC Not statistically different (P⬎.05)
ICC⫽0.943 (95% CI, 0.836–0.980), excellent intermethod reliability Very good Pearson correlation (r⫽0.90,P⬍.001)
a years.
[image:3.594.301.532.270.481.2]FIG 3. A, BPNST. 3D STIR SPACE maximum-intensity-projection image in a 34-year-old man presenting with a painless palpable mass in the right supraclavicular region. The mass remained stable during a 12-month period. The mass (large arrow) involves the distal right C7 nerve root (small arrow) and the upper trunk of the brachial plexus.B, Corresponding DTI shows swelling of the right C7 nerve root (small arrow) with partial disruption of the tracts (large arrow). The ADC is 1.7⫻10⫺3mm2/s.
FIG 4. A, Lymphoma. 3D STIR SPACE maximum-intensity-projection image in 65-year-old man presenting with progressively increasing weak-ness of the right arm during a few months. There was enlargement and abnormal hyperintense signal of multiple right brachial plexus nerve roots and trunks. The C6 nerve was the most abnormal (arrow).B, Corresponding DTI shows near-normal tracts. The ADC is 0.7⫻10⫺3mm2/s
.
FIG 5. A, CMT 1A disease. 3D STIR SPACE maximum-intensity-projection image in a 28-year-old woman presenting with pain in the lower midline thoracic region for many months. A diffuse symmetrically enlarged brachial plexus was seen bilaterally (arrows).B, Corresponding DTI shows near-normal tracts (arrows), given the limitation of suboptimal SNR near the spine and peripheral areas. The ADC was 2.0 and 1.9⫻10⫺3mm2/s
on right and left sides, respectively.
[image:4.594.132.451.48.157.2] [image:4.594.134.453.208.341.2] [image:4.594.132.453.398.510.2] [image:4.594.137.451.558.688.2]DISCUSSION
The peripheral nerves may be affected by a variety of nerve tumors and tumorlike conditions.1,2,8-10Anatomic 2D and 3D MR
imag-ing consistently produced high-quality images and nicely de-picted mass lesions along the long axis of the nerves and demon-strated associated nerve abnormalities.3-5 High-resolution 3D
STIR SPACE images use variable flip angles, are relatively insen-sitive to magnetization transfer–related cross-talk among sec-tions, and provide the best fat suppression for plexus evaluation.4
The images generated could then be matched to DTI for anatomic correlation and measurement of diffusion parameters. However, as seen in this study, the differentiation into benign or malignant nerve tumors was not possible due to similar appearances on an-atomic imaging. Fluorine 18 FDG-PET has been found to be use-ful in this domain, though the standard uptake values among benign and malignant lesions overlap and the patient will have to undergo another examination apart from MR imaging for presur-gical planning.13-15
DTI also produced good-quality images in most cases, despite prior surgery in the regional area in 2 cases. As opposed to stan-dard diffusion imaging, DTI not only provides quantitative infor-mation about the degree and direction of water diffusion within the nerves but can also be used for tractography to visualize the orientation of axons/nerve tracts and to assess their integrity.16,17
We found ADC on DTI to be more useful than DWI in differen-tiating benign from malignant lesions; this result may be partly related to a larger number of directions in diffusion encoding and higher b-values used in our DTI technique (1000 s/mm2versus
800 s/mm2). However, 12- versus -20 directions of interrogation
did not make much difference in ADC evaluation. The findings of increasing ADC suggesting benignity of lesions are similar to those seen with other tumors, such as in the breast and pros-tate.18,19Due to excellent interobserver reliability, apart from this
valuable information, the ADC can also be potentially followed as a biomarker to detect tumor response/necrosis if the lesions are being followed longitudinally or after adjuvant medical treat-ment. Such scenarios are likely as new medical therapies (imatinib and other chemotherapies) are being developed and tested for schwannomatosis, MPNST, and lymphoma.
Due to cell membrane and myelin sheath barriers produced by tightly packed and coherently aligned axons, proton diffusion across the fibrillar structure of the nerve is slower than that along the long axis of the nerve, leading to higher radial anisotropy in normal nerves.16,17,20The peripheral nerve ADC and FA vary
de-pending on the magnet, coil, and technique; the nerve in question; age; and underlying comorbidities. Although the normal FA of peripheral nerves ranges between 0.3 and 0.7, the side-to-side variations are minimal; the (healthy) contralateral nerve can serve as internal reference.21-25The FA of the involved nerves was
sig-nificantly lower than that of the contralateral nerves, likely reflect-ing associated axonal degeneration and myelin loss, similar to the results of Morisaki et al,22Lehmann et al,23and Khalil et al.24
Asymmetric T2 signal abnormality is a useful sign of segmental brachial plexus abnormality26; however, magic angle artifacts are
also a known cause of this finding. DTI offers a quantitative tool with excellent interobserver reliability to document such an ab-normality by showing lowering of FA, thereby confirming
neu-ropathy. This was seen in the case of CMT, where bilateral low FA values were observed.
The fiber orientation information yielded by DTI provides a new contrast mechanism that can be used to resolve images of anatomic substructures. The predominant paths of proton move-ment determined by the principal eigenvector in each voxel can be mapped to create an anisotropy image using multiple directions of interrogation.27The larger the number of directions used, the
more robust the data can be. However, SNR may, accordingly, drop, and the acquisition time might be prolonged. Authors use 12–20 directions, depending on the software available on different 3T MR imaging scanners. DTI can be degraded by motion, sus-ceptibility, and ghosting artifacts.27,28In the authors’ experience,
using tighter echo spacing (⬍0.07 ms), parallel imaging, higher bandwidth, imaging in the axial plane, and good fat suppression (water-selective technique) mitigates many of these artifacts and increases SNR. The improvement in SNR at 3T helps in the cre-ation of highly resolved DTI parametric maps with enhanced de-piction of tracts and better coregistration with the expected anat-omy on MR neurography images.18,28
In this study, tractography was possible in most lesions and was able to assess the microstructure of the nerves and associated lesions. Most benign lesions showed partial tract disruption or near-normal appearance with the exception of a degenerated schwannoma and a plexiform neurofibroma, which revealed complete tract disruption. We did not observe an isolated course deviation as a sign of BPNST as reported in a feasibility study by Vargas et al.5This is likely explained by the fact that DTI is a
functional technique and not direct anatomic imaging; therefore, areas of axonal degeneration and/or myelin loss will result in local loss of fiber attenuation, while anatomic fascicular architecture may still be present. Partial and complete disruption of tracts was noted in MPNSTs, which was also confirmed surgically. The near-normal appearance of the tracts was also seen in lymphoma, CMT, and perineurioma; which are explainable on the basis of the permeative nature of lymphoma, predominant demyelination in CMT type 1A, and perineurial cell proliferation around thinly myelinated axons.29-31
Although we included the lesions with good reference stan-dards, our limitations include lack of healthy controls. However, we used normal contralateral nerves as a control and noted sig-nificant side-to-side differences in FA. Despite the rarity of the nerve tumors and tumorlike conditions, we tried to encompass most of the lesions that one may encounter in routine practice and used a uniform technique on high-field imaging. In the future, larger prospective or multicenter trials by using DTI can further validate these findings.
CONCLUSIONS
ACKNOWLEDGMENTS
The authors acknowledge Aaron Flammang, Siemens Medical Systems, for technical help, and Vibhor Wadhwa, medical stu-dent, for assistance in the data collection.
Disclosures: Avneesh Chhabra—UNRELATED:Consultancy: Siemens,Comments: CAD system development,Grants/Grants Pending: Siemens Medical Solutions,* Integra Life Sciences,* GE-AUR,*Travel/Accommodations/Meeting Expenses Unre-lated to Activities Listed: Siemens, Integra, GE-AUR. Allan J. Belzberg—UNRELATED: Grants/Grants Pending: Children’s Tumor Foundation.* Jaishri Blakeley— UNRELAT-ED:Grants/Grants Pending: Department of Defense grants pertinent to NF1, NF2, and schwannomatosis are currently under review, Travel/Accommodations/Meet-ing Expenses Unrelated to Activities Listed: travel to a meeting with Sanofi regarding a trial for glioblastoma. John A. Carrino—UNRELATED:Board Membership: GE Healthcare, Consultancy: Quality Medical Metrics, Medtronic, Vital Imaging, Grants/Grants Pending: Siemens,* Carestream,* Toshiba;*Payment for Lectures (including service on Speakers Bureaus): Siemens,Stock/Stock Options: Merge Healthcare. *Money paid to the institution.
REFERENCES
1. Ogose A, Hotta T, Morita T, et al.Tumors of peripheral nerves: correlation of symptoms, clinical signs, imaging features, and his-tologic diagnosis.Skeletal Radiol1999;28:183– 88
2. Chhabra A, Thawait GK, Andreisek G.Peripheral nerve and tumor-like conditions.In: Chhabra A, Andreisek G, eds.Magnetic Resonance Neurography.New Delhi, India: Jaypee Brothers Medical Publishers; 2012:113–32
3. Mallouhi A, Marik W, Prayer D, et al.3T MR tomography of the brachial plexus: structural and microstructural evaluation.Eur J Radiol2012;81:2231– 45
4. Viallon M, Vargas MI, Jlassi H, et al.High-resolution and functional magnetic resonance imaging of the brachial plexus using an isotro-pic 3D T2 STIR (short term inversion recovery) SPACE sequence and diffusion tensor imaging.Eur Radiol2008;18:1018 –23 5. Vargas MI, Viallon M, Nguyen D, et al.Diffusion tensor imaging
(DTI) and tractography of the brachial plexus: feasibility and initial experience in neoplastic conditions. Neuroradiology 2010;52: 237– 45
6. Chhabra A, Lee PP, Bizzell C, et al.3 Tesla MR neurography: tech-nique, interpretation, and pitfalls.Skeletal Radiol2011;40:1249 – 60 7. Subhawong TK, Wang KC, Thawait SK, et al.High resolution imag-ing of tunnels by magnetic resonance neurography.Skeletal Radiol
2012;41:15–31
8. Thawait SK, Chaudhry V, Thawait GK, et al.High-resolution MR neurography of diffuse peripheral nerve lesions.AJNR Am J Neuro-radiol2011;32:1365–72
9. Chhabra A, Soldatos T, Durand DJ, et al.The role of magnetic reso-nance imaging in the diagnostic evaluation of malignant peripheral nerve sheath tumors.Indian J Cancer2011;48:328 –34
10. Wasa J, Nishida Y, Tsukushi S, et al.MRI features in the differentia-tion of malignant peripheral nerve sheath tumors and neurofibro-mas.AJR Am J Roentgenol194:1568 –74
11. Khalil C, Budzik JF, Kermarrec E, et al.Tractography of peripheral nerves and skeletal muscles.Eur J Radiol2010;76:391–97
12. Shrout PE, Fleiss JL.Intraclass correlations: uses in assessing rater reliability.Psychol Bull1979;86:420 –28
13. Shahid KR, Amrami KK, Esther RJ, et al.False-negative fluorine-18 fluorodeoxyglucose positron emission tomography of a malignant peripheral nerve sheath tumor arising from a plexiform neurofi-broma in the setting of neurofineurofi-bromatosis type 1.J Surg Orthop Adv
2011;20:132–35
14. Ohno T, Ogata K, Kogure N, et al.Gastric schwannomas show an obviously increased fluorodeoxyglucose uptake in positron emis-sion tomography: report of two cases.Surg Today2011;41:1133–37 15. Bertagna F, Bosio G, Biasiotto G, et al.Malignant transformation to schwannoma in a patient affected by type 1 neurofibromatosis as demonstrated by F-18-FDG-PET/CT.Nucl Med Rev Cent East Eur
2010;13:15–17
16. Tagliafico A, Calabrese M, Puntoni M, et al.Brachial plexus MR imaging: accuracy and reproducibility of DTI-derived measure-ments and fibre tractography at 3.0-T.Eur Radiol2011;21:1764 –71 17. Meek MF, Stenekes MW, Hoogduin HM, et al.In vivo three-dimen-sional reconstruction of human median nerves by diffusion tensor imaging.Exp Neurol2006;198:479 – 82
18. Baltzer PA, Scha¨fer A, Dietzel M, et al.Diffusion tensor magnetic resonance imaging of the breast: a pilot study.Eur Radiol2011;21: 1–10
19. Oto A, Yang C, Kayhan A, et al.Diffusion-weighted and dynamic contrast-enhanced MRI of prostate cancer: correlation of quantita-tive MR parameters with Gleason score and tumor angiogenesis.
AJR Am J Roentgenol2011;197:1382–90
20. Chhabra A, Andreisek G, Soldatos T, et al.MR neurography: past, present, and future.AJR Am J Roentgenol2011;197:583–91 21. Andreisek G, White LM, Kassner A, et al.Diffusion tensor imaging
and fiber tractography of the median nerve at 1.5T: optimization of b value.Skeletal Radiol2009;38:51–59
22. Morisaki S, Kawai Y, Umeda M, et al.In vivo assessment of periph-eral nerve regeneration by diffusion tensor imaging.J Magn Reson Imaging2011;33:535– 42
23. Lehmann HC, Zhang J, Mori S, et al.Diffusion tensor imaging to assess axonal regeneration in peripheral nerves.Exp Neurol2010; 223:238 – 44
24. Khalil C, Hancart C, Le Thuc V, et al.Diffusion tensor imaging and tractography of the median nerve in carpal tunnel syndrome-pre-liminary results.Eur Radiol2008;18:2283–91
25. Sheikh KA.Non-invasive imaging of nerve regeneration.Exp Neurol
2010;223:72–76
26. Filler AG, Maravilla KR, Tsuruda JS.MR neurography and muscle MR imaging for image diagnosis of disorders affecting the periph-eral nerves and musculature.Neurol Clin2004;22:643– 82, vi-vii 27. Mori S, van Zijl PC.Fiber tracking: principles and strategies—a
technical review.NMR Biomed2002;15:468 – 80
28. Okada T, Miki Y, Fushimi Y, et al. Diffusion-tensor fiber tractography: intraindividual comparison of 3.0-T and 1.5-T MR imaging.Radiology2006;238:668 –78
29. Skre H.Genetic and clinical aspects of Charcot-Marie-Tooth’s dis-ease.Clin Genet1974;6:98 –118
30. Reilly MM, Murphy SM, Laura´ M.Charcot-Marie-Tooth disease.J Peripher Nerv Syst2011;16:1–14