University of Warwick institutional repository:http://go.warwick.ac.uk/wrap
A Thesis Submitted for the Degree of PhD at the University of Warwick
http://go.warwick.ac.uk/wrap/71970
This thesis is made available online and is protected by original copyright. Please scroll down to view the document itself.
MICROSTRUCTURAL EFFECTS IN RELATION TO
THE LEACHING OF GLASSES
by
Ronald Maddison B.Sc.
Thesis for the Degree of Doctor of Philosophy of the University of Warwick.
BEST COpy
AVAILABLE
DECLARATION
The work reported in this thesis is the author's own, except where it is specifically stated as otherwise. This work
was carried out in the Physics Department of the University of Warwick during the period October 1975 to September 1978.
Ronald Maddison
ACKNOWLEDGEMENTS
The author wishes to express his appreciation to Professor P.W. McMillan for his guidance throughout this programme of work, and to Professor A.J. Forty who, as Chairman of the Department of Physics at the University of Warwick, made the research facilities
available. He wishes also to thank the Procurement Executive of the Ministry of Defence for the financial support of the programme and their representatives,
Dr. N.S. Corney and Mr. I.McC. Taylor, who made valuable contributions as external advisers.
The author would also like to express his
gratitude to all the members of the Glass Ceramics research group, in particular to Mr. S.M. Tran and
Dr.
D.
Armitage for many interesting discussions on the work. He also wishes to thank Mr. J. Lau and Ms. L. Heathfor their help. Finally, he wishes to thank his wife, for typing the manuscript, but primarily for her
ABSTRACT
A study of the acid leaching of a series of glasses has been made. This was undertaken to provide information concerning the production of microporous glass membranes with reverse osmosis desalination potential.
The chemical compositions of the glasses investigated were
developed from a commercial glass composition known as 'E-glass'. This glass~phase separates into mutually interconnecting acid soluble and acid insoluble phases, during cooling from the molten state. Treating the glass with mineral acid solutions removes the soluble phase, yielding a porous glass skeleton. The amount of Si02 in the original composition
was varied, and it was found possible to produce microporous glass skeletcns from glasses having a range of Si02 contents. These glasses also phase separated into mutually interconnecting phases during cooling.
The parent glasses were studied by viscosity and electrical conductivity measurements. The results of those investigations were consistent with the rapid phase separation of the glasses.
The leaching rates of the glasses were studied by weight loss measurements and those measurements indicated that the leaching rate was
controlled by the durability of the acid soluble phase.
The leached glasses were characterised by some electron microscopy, but primarily by inert gas adsorption measurements. The porous glasses
contained pores of about 2 nm radius although there was also evidence of the presence of even finer pores.
The reverse osmosis performance of several of the glasses was investigated using single hollow fibre membranes and salt rejections of up to
50%
were recorded.CONTENTS CHAPTER 1
1. Introduction 1.1 Preamble
1.2 The development of an interconnected microstructure in glass
1.2.1
The thermodynamics ofliquid-liquid immiscibility
1.2.2
Mechanisms of decompositionSpinodal decomposition
Spinodal decomposition during isothermal holding
Spinodal decomposition during continuous cooling
Intersecting growth theory A comparison .of the two mechanisms
1.3 The leaching of glass to produce a porous skeleton
1.4 Desalination
1.4.1 The heat of solution
1.4.2 A nearly ideal desalination
1.5
process
Real desalination processeS An estimate of the energy
requirements of real desalination processes
Thermal distillation Freeze separation Reverse osmosis
Porous glass for reverse osmosis desalination: a review
Objectives of investigation The research programme Plan of the thesis 1.4.3 1.4.4
1.6
1.7
1.B
CHAPTER 22.
The production of the parent glass and experimental details of the measurements on these glasses.2.1 Introduction
2.2 The selection of the glass compositions 2.3 Glass preparation
2.3.1 Glass fibre production
2.4
2.3.2 Hollow fibre production
The measurement of critical opalescence 2.4.1 Introduction
2.4.2 Apparatus and procedure D.c. resistivity
2.5.1 Introduction
2.5.2 Apparatus and proc~dure Viscosity measurements
2.6.1 Introduction
2.6.2 Apparatus and procedure
The cooling rate of thick glass fibres 2.7.1 Introduction
2.7.2 Apparatus and procedure 2.5
2.6
2.7
CHAPTER 3
3. Experimental details of the parent glass and the characterisation of the porous products
3.1 Introduction
3.2 The leaching of the glass
3.3 Weight loss measurements and estimates of the porous volume
3.4 Electron microscopy 3.4.1 Introduction
3.4.2 Sample preparation
3.4.3 Analysis of the micrographs Lineal analysis
3.5 Gas adsorption
3.5.1 Introduction 3.5.2 Apparatus 3.5.3 Procedure 3.5.4 Data analysis
Surface area measurements Average pore size
Pore size distribution
Numeric~l solution of the pore size distribution
CHAPTER 4
4.
The results of the measurements on the parent glassIntroduction
4.1 Results of the critical opaleseen~e
4.2
measurements
Results of the d.e. resistivity measurements
Results of the viscosity measurements Results of the cooling rate
measurements
Discussion of the results
CHAPTER
5
5. The results of the leaching measurements and of the characterisation cif the porous glass 5.1 Introduction
5.2 The effect of leachant temperature 5.3 The effect of leachant concentration 5.4 The effect of thermal history
5.5 The effect of fibre composition 5.6 The effect of leaching the porous
glass in alkaline solutions 5.7 Summary of the leaching results
CHAPTER
66. Reverse osmosis measurements with porous glass membranes
6.1 Introduction
6.2 A hyperfiltration model of desalination with porous glass
6.3 Experimental details
6.3.1 Reverse osmosis test apparatus 6.3.2 Operating conditions
6.3.3 Analysis of the product 6.3.4 Porous glass membranes 6.4 Results of the reverse osmosis
measurements
Discussion of the r.o. measurements 6.5
CHAPTER 7
7. Discussion of the results, conclusions and proposals for future work
7.1 Introduction
7.2 Physical properties of the parent glasses 7.3 The leaching of the glasses
7.4 The porous glass skeletons 7.5 Conclusions
7.6 Proposals for future work
APPENDICES
Appendix 1: Published paper: The cooling rate of 115 glass fibres
Appendix 2: Computer program: For the analysis of gas
adsorption data.
(S.M.
Tran andR.
Maddison) 118Appendix
3:
Pore size distributions of the glassmembranes used in the reverse osmosis measurements 121
LIST OF FIGURES
CHAPTER 1
page Figure 1.1 Schematic phase diagrams showing two
liquid immiscibility. In a) the stable region has a sub-liquidus extension and in b) the immiscible
region is entirely sub-liquidus 2
Figure 1.2 Schematic representation of the
compositional dependence of the free energy of an ideal binary solution (Gi). The two contributions \:.0 this, Go(the free energy of a mechanical mixture) and -T Srn ( the free entropy of mixing) are also
shown 3
Figure 1.3 A schematic representation of the free energy of an immiscible solution at three temperatures is shown in
(a).
The phase diagram correspondingto the free energy curves are shown
4
Figure
1.4
Schematic diagram showing the entropy of mixing. The solid line corresponds to regular mixing, and the broken line to that calculated usingequation 1.6(after Charles(1969» 5
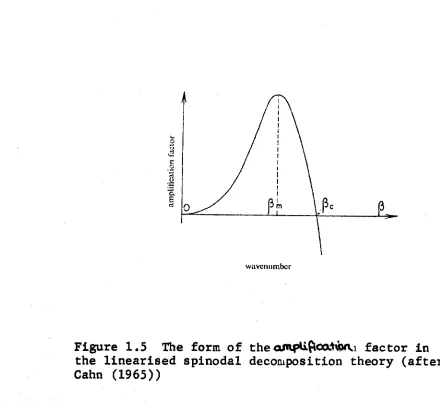
Figure 1.5 The form of theo..C1\4>~c.o.not\.. fac tor in the linearised spinodal decomposition Lheory (after
Cahn (1965» 8
Figure 1.6 The relationship between the maximum amplified wave number and undercooling into the
spinodal region (after Cahn(1968» 9
Figure 1.7 The relationship between the maximum amplified wave.number and the linear cooling rate
(after Husten, Cahn and Hilliard (1966» 10
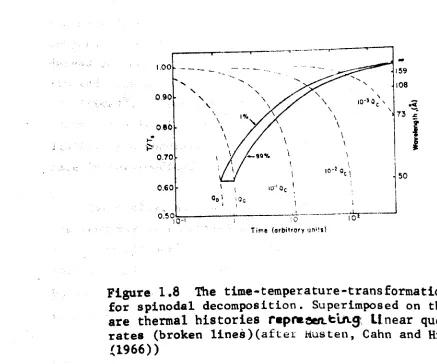
Figure 1.8 The time-temperature-transformation. for spinodal decomposition. Superimposed on this are thermal histories repres~~ linear quench rates (broken lines)(after Husten, Cahn and Hilliard
(1966» 10
Figure 1.9 The temperature dependence of the
Figure
1.10
The structure predictedby
spinodal decomposition (a) and by intersecting growth (b)(after Cahn (1965) and Haller (1965»). 12
Figure 1.11 Concentration profiles as a function of time for spinodal decomposition (a) and for
nucleation and growth (b) 12
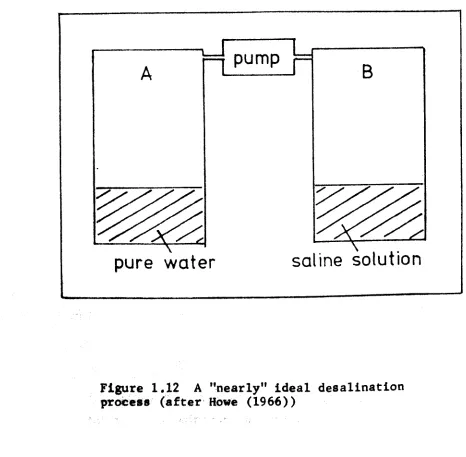
Figure 1.12 A "nearly" ideal desalination
process (after Howe (1966»)
15
Figure
1.13
The salt rejection of porous glass membranes as a function of the median pore size. A compilation of the data of Ballou et al (1971), McMillan and Matthews (1976) and Littman andGutter (1968) 21
CHAPTER 2
Figure 2.1 Schematic diagram of the apparatus used to determine the critical temperature of the
glass by observing opalescence 31
Figure 2.2 cell
Schematic diagram of the conductivity
34
Figure 2.3 The electrical circuit used to measure
the resistivity of the molten glass 34
Figure 2.4 Schematic diagram of the fibre elongation apparatus used to measure the
viscosity of glass 38
Figure 2.5 Schematic diagram of the apparatus
used to determine the cooling rate of glass fibres
41
t:iq~ ~Jo . S~em.Qt:iC. cL:o-qram .0 ~Jtu.
J-~~ettiEasurc.nq ~uit ...5ec:lJo d~l'\'l..U'le Hta. c.oo''''q
r:
ateof
41CH APT£It"'
3
9'
asS" .(\ores
Figure 3.1 Schematic diagram of the gas adsorption
/desorption apparatus 51
Figure 3.2 The five common adsorption isotherms classified following Brunauer et al (1940). Relative
~res8ure8 of 0.05 and 0.35 are indicated 55
Figure 3.3 Adsoption and desorption isotherms
for one of the porous glasses evaluated (E-54) 58
Figure 3.4 Schematic diagram of ads~tion in a porous material. The pore on the L.H.S. is filled (as Rl< R ), the central pore is empty (as R2~ R ), £he pore on the R.H.S. is of the criti~al radius (R)) Rc)
Figure 3.5 The thickness of the adsorbed gas as a function of relative pressure.(after
Cranston and Inkley (1959)
60
60
Figure 3.6 The desorption isotherm of a
porous material having pores of one radius only 61
Figure 3.7 An 'ink bottle' pore. Such pores represent one other possible cause of hysteresis
in the adsorption/desorption isotherms 61
Figure 3.8 Halsey's and Hauser's equations describing the thickness of the adsorbed layer as a function of relative pressure. The
experimentally derived curve of Cranston and
Inkley is also shown 62
CHAPTER 4
Figure 4.1 The resistivity as a function of temperature for glass E-65 (a). The deviations
from the two line fit to the data (b) 66
Figure 4.2 The resistivity as a function of temperature for glass E-60 (a). The deviations
from the two line fit to the data (b) 66
Figure 4.3 The resistivity as a function of. temperature for glass E-54 (a). The deviations
from the two line fit to the data (b) 66
Figure 4.4 The resistivity as a function of temperature for glass E-45 (a). The deviations
from the two line data fit (b) 66
Figure 4.5 The resistivity as a function of temperature for glass E-40 (a). The deviations
from the two line fit to the data (b) 66
Figure 4.6 The resistivity as a function of temperature for glass E-30(a). The deviations
Figure 4.7 The deviations [roil:the single line
fit to the resistivity data of gl~~s E-60 66
Figure 4.8 The viscosity data 67
Figure 4.9 Viscosity as Cl funct.ion of tpmperature
and composition. 68
Figure 4.10 The isothermal viscosity drift of
glass E-70 69
Figure 4.11 The isothermal viscosity drift of
g1ass E - 70 • Three s a mpl.es ,SIIbjH' ted tCl t h ('
measuring stress at different periods during
heat: treatment 69
Figure 4.12 The function of ~ime ve loc ity 1ms .
o
.18mm dia .(c) .temperature of r he fibre as a
after leaving the glass, drawing 0.09mm dia.(a). O.12mm dia.(b).
o
.20mm dia .(d) . 70Figure 4.13 The temperature of the fibre as a function of time after_leaving the glass melt, drawing velocity 1.5ms • O.09mrn dia.(a).
o
.20mm dia. (b) • 70Figure 4.14 The time to cool from 8~)oC to 4000C
as a function of fibre diameter 70
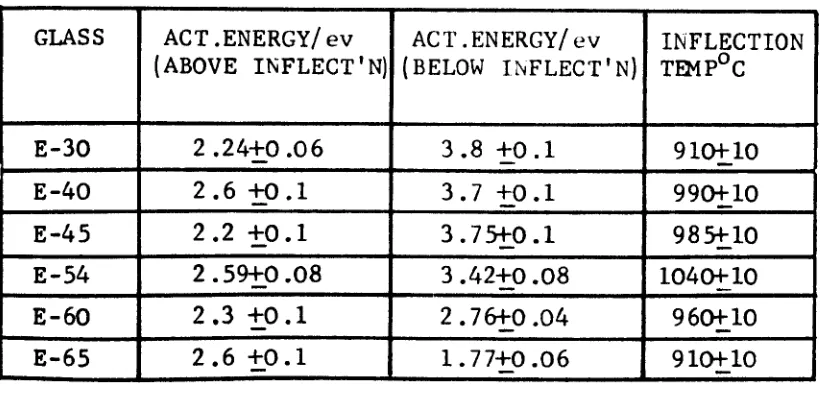
Figure 4.15 The critical temperatures as determined by opalescence and viscosity drift measurements. Also shown are the inflection temperatures found
in the electrical. behaviour of each glass 71
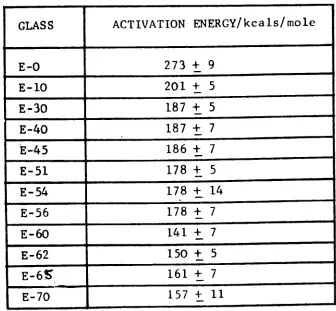
Figure 4.16 The activation energies of conduction above and below the inflection temperature as a
function of the wt.% Si02 72
Figure 4.17 The activation energies of conductivity below the transition temperature and those of
viscous flow 73
CHAPTER 5
Figure 5.1 Weight !oSfas a function of time in the leaching solution. 0.3mrn dia. E-S4 glass
fibres; 30v/v% HC! solutions 76
Figure 5.2 Weight loss as a function of tim~ in the leaching solution. O.3mm din. £-0 glass fibres
30v/v% HCl solutions 76
Figure 5.3 Weight loss as a function of time in the leaching solutign. O.3rr~ dia. E-S4 glass fibres
HCI solutions at 90 C 76
Figure 5.4 Weight loss cIS cl funct ion of time in the leaching soluti811. O.3ml:1dia . E-O glass fibres
HCl solutions at 90 C 76
Figure 5.5 Pore volume as a function of time in
the leaching solution. 0.3mm dia. E-54 glass fibres
in HCl solutions at 90°C 77
Figure 5.6 Surface area as a function of time in the leaching solution. 0.3mm dia. E-S4 glass fibres
in HCI solutions at 900C 77
Figure
5.i
Weight loss as a function of (fibre-diameter). E-54 glass fibres after4
hours in30v/v% HCl solutions at 90°C
77
Figure 5.8 Pore volume as a function of fibre diameter. E-S4 glags fully leach~d in 30v/v%
HCl solutions at 90 C
77
Figure 5.9 Specific surface ar~a as a function of fibre diameter. E-S4 glass, fully leached in
30v/v% HCl solutions at 90°C 78
Figure 5.10 Mean pore size as a function of fibre diameter. E-S4 gla~s, fully leached in 30v/v%
HCl solutions at 90 C 78
Figure 5.11 Three pore size distributions . E-54 glassofibres fully leached in 30v/v% HCl solutions
at 90 C 78
Figure 5.12 The most common pore size as a function function of fibre diameter. E-S4 glaas, fully
leached in 3Ov/v% HCl solutions at 900C 78
Figure 5.13 Transmission electron micrographs of E-s4 glass fibres fully leached in 30v/v%
o
HCl solutions at 90 C; a) O.lmm diameter,
b) O.66mm diameter, c) 0.34mm diameter 79
Figure 5.14 Void volume of E-54 glass fibres fully leached in 30v/v% HCl solutions at 90°C
Figure 5.15 Average distance between phases of E-S4 glass fibres fu~ly leached in 30v/v% He!
solutions at 90 C, as a function of fibre diameter 79
Figure 5.16 Extended pore size distributions of E-54 glass fibrgs fully leached in 30v/v% HCI
solutions at 90 C 80
Figure 5.17 Weight loss of O.3mm diameter glass fibres after 4 and 8 hours in leaching solutions of 30v/v% HCl at 90°C as a function of the Si02
content of the glass 81
Figure 5.18 We.ight loss of E-60, E-56. 5 and E-O glass fibres as a function of time in the leaching
solutions of 30v/v% HCI at 900C 81
Figure 5.19 Mean pore size as a functionof fibre diameter for
E-s6.s
glass ~ibres fully leached in30v/v% HCl solutions at 90 C 81
Figure 5.20 Mean pore size as a function of fibre diameter for
E-60
glass fibres fully leached in30v/v% HCl solutions at 90°C 81
Figure 5.21 Two pore size distributions for E-56.5 glass fibres fully leached in 30v/v% HCI solutions
at 90°C 81
Figure 5.22 Two pore size distributions for E-60 glass fibres fully leached in 30v/v% HCI solutions
at 90°C 81
Figure 5.23 Transmission electron micrographs of E-56.5 glass ftbres, fully leached in 30v/v% HCI solutions at 90°C; a) 0.19mm diameter, b) 0.41
diameter, c) 0.70mm diameter 82
Figure 5.24 Transmission electron micrographs of E-45 glass fibr8s, fully leached in 30v/v% HCl solutions at 90 C; a) O.3lmm diameter, b) 0.34mrn
diameter, c) O.66mm diameter, d) 0.81mm diameter 82
Figure 5.25 The average distance between phases as a function of fibre diameter for
E-S6.S
glass figres fully leached in 30v/v% HCI solutions at90
e
82Figure 5.26 The average distance between phases as a function of fibre diameter for E-4S glass fibres fully leached in 30v/v% HCI solutions at
900
e
82Figure 5.27 The surface area of fully leached
o
.3mm diameter E- 54 glass fibres as a furiction oftime in In NaOH solutions at 20°C 83
Figure 5.28 Extended pore size distributions of fully leached O.3mm diameter E-54 glass fibres before and after treatment for 2 hours
in In NaOH solution at 20°C 83
CHAPTER 6
Figure 6.1 Schematic diagram, illustrating, the importance of bound water in explaining the
salt rejection of porous glass membranes 87
Figure 6.2 Schematic diagram of the reverse
osmosis test rig 88
Figure 6.3 Sectional diagram of the reverse
osmosis cell 90
tigure 6.4 Schematic diagram illustrating the
mounting and sealing of the porous glass membranes 90
Figure 6.5 Salt rejection vs. flux rate for
membranes produced from parent glass E-s6.s 94
Figure 6.6 Pore size distributions for membranes
nos. 1 and 4 95
Figure 6.7 Salt rejection vs. median pore size
for membranes produced from parent glass E-56.s 95
Figure 6.8 Salt rejection v~ median pore size (taken from figure 6.7 and published data
referenced for figure 1.3) 95
CHAPTER 7
Figure 7.1 The cooling of lOpm and sOOpm
diameter fibres 98
Figure 7.2 The meta. stability region of the
'E-glass system' 100
Figure 7.3 The volume fraction of the silica
skeletons 100
Figure 7.4 The temperature at which the glasses
had a viscosity of 1013 poise 101
Figure 7.5 The activation energies of viscous
Figure 7.6 The weigh t loss ,15 a funerion 0 f time
for three 0.3mm diameter fibres of different
compositions.(30v/v% HCl solutions at 900e) 102
Figure 7.7 Quench rate at 9000
e
as a function offibre diameter 103
Figure 7.8 Pore size as a
fun.c.t:l.DC\.
of quench rate at 9000e
for E-S4 glass fibres (30v/v% HCt solutionat 90oe) 103
LIST OF TABLES
CHAPTER 1
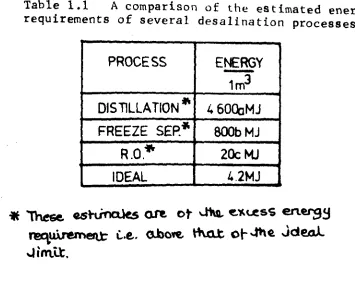
Table 1.1 A comparison of the estimated energy
requirements of several desalination processes 19
CHAPTER 2 Table 2.1 E-glass Table 2.2 Table 2.3 Table 2.4
The composition limits of commercial
The composition of leached E-g1ass
27
27
28
The glass compositions
The melting schedules 29
Table 2.5 The melting schedules of the glasses prepared from water saturated chemicals
CHAPTER 4
TablS 4.1 1000 C
29
The resistivities of the glasses at
66
Table 4.2 The standard deviations ef the
conductivity data fit to a straight line, and to two straight lines
Table 4.3
Table 4.4 flow
66
The activation energies of conduction 67
The activation energies of viscous
68
Table
4.5
The estimated viscosity of the glassesat the electrical inflection temperature 72
CHAPTER 6 Table 6.1 membranes Table 6.2 membranes Table 6.3 membranes
The r.o. performance of E-56.5 based
94
The r.o performance of E-58 based
94
The r.o. performance of
E-60
basedCHAPTER 1
Introduction
1.1
PreambleGlasses are often regarded as homogeneous materials
in which the local atomic arrangements are randomly
repeated t~roughout their bulk. In many glasses it is
possible however, to induce a separation into two or
more glassy phases differing in chemical composition.
In certain glasses, this separation can result in the
formation of mutually interconnecting phases of widely
differing chemical durabilities. TI1ese glasses can
be treated in acid solutions to remove one of the
phases, and porous glass skeletons can be produced from
them.
As the kinetics of phase separation are controlled
by the same transport properties that limit crystallisation,
the scale of the phase separation in glass is
characteristically small. The glass skeletons produced
from glasses can, therefore, contain very fine pores of the
order of a few nanometers in diameter. One possible
application of this micro porous glass is as a
semi-permeable membrane for use in reverse osmosis
desalination and it was an objective of this investigation
to develop and characterise a porous glass suitable
for that purpose.
-1.2 The development of an interconnected microstructure
in glass
'~ glass is an inorganic product of fusion which has
cooled to a rigid condition without crystallisation"
(A.S.T.M. (1945» . Below the liquidus temperature, glass
is metastable with respect to some crystalline phase and
so can becons~ered as an extension of the liquid state. As
a consequence of this, the simple models of the stable
immiscibility of a liquid can be extended into the
metastable-glass forming region. If the two phase region is below
the liquidus then the whole process may be metastable, but
is
still subject to the same analysis. These two cases areillustrated in figure 1.1.
1.2.1 The thermodynamics of liquid-liquid immiscibility
The free energy of an ideal binary solution (Gi) is
given by
Gi
=
Go - T ~Sm 1.1where ~Sm is the entropy of mixing, T is absolute temperature
and Go is the free energy of a mechanical mixture' defined
as
1.2
Where Xa and Xb are the fractions of components a and b.
Ga and Gb are the free energies of pure components a and b.
The entropy of mixing for an ideal solution is given by
-r---
__
._._
stable
two
ill
L...
:::J
...
a
L...
<l>
Cl.
E
ill
~
I
\
(3 ..
L
fl1Ietas tabl~\
!two
liquids
I
A
B
composition
a
'.
_._
...._.
__
._._._-_
./'
I'(+l//
f3+L
~
-~
...
-.---L---l(3
/ \
/
\
/metas table \
two liquids \
\
o. +
f3
L-.---_. ...
----UA
B
composition
b
1.3
where R is the gas constant.
The composition dependence of Go, T6Sm and Gi are
shown in figure 1.2,and as Gi is 'concave down
I,
a single phase solution is thermodynamically stahle.Generally, the free energies of the components in the
solution are not those of the pure components and for real
solutions this departuremn be included as an extra term
in equation l.l.The free energy of a real binary solution
(Gr) is then
Gr
=
Go-T 6Sm+
6Gx1.4
At sufficiently low temperatures, the entropy contribution
( ~Sx) to ~Gx is negligible compared with the enthalpy
contribution (boHx) as L\Gx=~Hx-T i1Sx. It can easily be
shown that the enthalpy of a binary liquid can be approximated
by
where \b represents the energy of the interaction between the
unlike components (a qpd b), Eaa that between a and a
components and ;'b that of the b components. Z is the
,
average co-ordination number.
If the interaction between dissimilar components is less
than the average of the like component interactions, then
Ga
...---_._._
.._._--_._--._---Gb
....
....
...
..' .,'
....
Go
....",
,,'
B
Figure 1.2 Schematic representation of the
compositional dependence of the free energy of an ideal binary solution (Ci). The two contributionsbo this, Go{the free energy of a mechanical mixture} and -T Sm ( the free entropy of mixing) are also shown
,0"
..._---
- T L1Srn
A
'---,----,---_-.1
in figure 1.2. However, if 2E b">a. Eaa+E11)) ,6Hx is positive and Gr can show inflections in its compositional dependence.
Such a case is illustrated in figure 1.3 which shows
the free energy at three temperatures: T1, above the two
phase region, T2 at the critical temperatur~ and T3 well
into the two phase region. In figure 1.3 the phase diagram
pre~icted by this mixing model is shown. Three regions
are apparent, the spinodal region in which the single phase
composition is unstable, the metastable region and the
single phase region.
In certain liquids, regular type mixing is closely
approximated, but in glass this is not so. Charles
(1969)
has pointed out that the calculation of the entropy of
mixing of a glass is entirely dependent on the structural
model adopted and has proposed that in a binary silicate
the entropy is primarily due to the exchange of bridging
and non-bridging oxygen ions. The concept of bridging and
non-bridging oxygen ions is a consequence of the random
network of glass. Oxygen ions which are shared by two
silicon ions a~e·considered to be bridging and those bonded
only to one, non-bridging. In pure amorphous silica it is
generally believed that all oxygen ions are shared, but
the addition of metal oxide introduces extra oxygens,
and&ome
oxygens then become only singly bonded. Stevels
(1954),
and others, have shown the significance of the ratio of
A
composition
a
unstobl
T.
metastable
Q)
/,I
T1
L- /
:J
lW;;,
-+-'
e
T~
(l)
Q_
t'1o liqui~s
E
,1//
/
/1
(lJ
+J
L_-B
A
B
cornposition
b
Figure 1.3 A schematic representation of the free energy of an immiscible solution at three temperatures is shown in (a). The phase diagram corresponding
polymer model of glass from it.
For 1 mole of binary solution containing Xm and XS
molar fractions of metal oxide and silica, the number of
non-bridging pairs is Xm. Thej-C'O.d-iOn of bridgi.ng oxygens
is 2-3Xm (=2Xs-Xm). As these are exchanged over 2(1-Xm)
sites, the entropy of mixing is
Sm
=
-R [xm In Xm+
2-3Xm In 2-3Xm ]1.62(1-Xm)' 2(1-Xm) 2(1-Xm)' 2(1-Xm)
Figure 1.4 compares the form of entropy of mixing
calculated from equation 1.4 with that calculated from
equation 1.6 (after Charles (1969». For a ternary glass
there exists the possibility of separation into three
phases (by analogy with the Gibbs phase rule) and there is
experimental evidence of this (e.g. Vogel (1966.) and
Porai-Koshits and Averjanov (1968». For rnulticomponent
glasses even more phases are possible.
1.2.2 Mechanisms of decomposition
There are two proposed mechanisms by which an
interconnected microstructure in glass may develo~
Isolated droplets may grow to touch each other, provided
that the volume fraction of both phases is similar' 1.e • the homogeneous composition is near the centre of the
i
~Sm
I
r---~---~----_.----~,---,.- _'" ...
"
/'
"-/
,
I \
I
I
/
I
/
\ ---~----.-\--.-..--.,..
/"-
\ "-~""""_',\ \
\
\
_____ --'-__ ----L ,-L._\ ..L.. __ --..lII
o
.2
.6
.8
1.0
molar frae tion metal
ox ide
.4
decomposition may operate and this produces a strongly
interconnecting microstructure directly.
The theory of spinodal decomposition is well advanced
as the process can be modelled mathematically but the intersecting
growth process involves three distinct stages and cannot'
easily be modelled. These two mechanisms of decomposition
are discussed below and a comparision of the predicted
morphologies made.
Spinodal decomposition
If the local Helmholtz free energy (f(r»* is dependent
only on composition and its spatial derivatives, then it
can be expressed as a Maclaurin series about the free energy
of the uniform composition (f(c» i.e.
, 2 2 4 2 2
f (r)
=
f (c)+
KI VC+
Kz (
'Vc )+
K3 'V c+
K4 ( Vc)+..
I • 7 Cahn and Hilliard (1958) proposed that a good approximationcould be made by retaining only the first three terms in
equation 1.7.This is known as the diffuse interface expansion.
*
NoteFollowing Cahn and co-workers, the Helmholtz free energy is used in the discussion of spinodal decomposition. As far 3S the work presented here is concerned,the difference
between it and the more familiar Gibbs energy is negligible.
-The free energy of the inhomogeneolls solution is then
F:::S
[(f(c)+
Kl V~+
K2('V
c)2)].dv 1.8The free energy of the uniform solution can be expanded as
a Taylor series about the av e r ag e c orupo sit ion (c ) i.e.
. 0
2
62
3 3f(c) ::: (c-c ) d f
+
1 (c-e) f + 1 (c -c ) ~ f+
1.9o --- 0 ---- -
0---~C 2
6e
2 6de
3Neglecting terms higher than second order :lnd noting that
S
(c -co)dv ... 0, the change in free l'lwrgy due to compositional fluctuations is'A F ... (' (1.. ( 2 ,,2 2 2 2
~
J ~
c-co) 0 f/6c +K1VC+
K')( Vc) ).dv For some '01f /Oc
1• DF can be negative,1.10
So compositional fluctuations lower t.lu- free energy and 2 . 2
are stable. The loci of the
6
flOc
=
0 points on the phasediagram is known as the spinodal and tllis clcfines the limit of the unstable region. This is shown ill figure 1.3b.
Infinitesimal compositional fluctuations of the form
C .. Acos
f3
x lower the free energy if(3""
f3c
where(& -
(-tf/'Oc
2.1/21\/2 1.11and
1.12
To determine the kinetics of the transformation it is
necessary to solve th,e~..~lffusiort'equation inside the spinodal
region. TO,d" this a mobility (M) is defined as
Jb - -Ja - M V ( fa - }lb) 1.13
where Jb and J a are the fluxes of c omponorrt s a and b ;
P
a and Pb 'are.. the chemical potentials of a and b. The variational deriv4t,ive ,of . equation 1.8 isbf/bc
=
u
-\1. ...~F/6
c
a I a I D a - 2K V ~Cl + 1.14
-where the subscript a refers to component a and the
subscript b to component b. ~ has replaced the original two coefficients K1 and ~ (using equation 1.~2). Neglecting all terms higher than shown in equation 1.14, sUDstituting into equation 1.13 and taking the divergence
\1J
= dc/~t
a =
V
(M 'V(of/
de
, a 1.15i.e. 'oc/~t =
M(;}f/oc
2) V~ - 2MI)V;+ ...
1.16 For the early stages, the higher terms in equation1.16
are not important as they are not linear in C. This simplifies the solutions of equation1.16,
which are nowwhere
(c-co
>'
=I;
exp (~t). (A~cos (p.r}+B{3sin(f3.r»
rS
R,o
=
_M~2(tf/oc
2 )-2MI\41.17
1.18
Rp
has the form shown in figure 1.5 and is an amplification factor. As R~ appears as an exponent and has a fairlysharp maximum, all Fourier components in equation
1.17
other than those for which R~ is a maximum (Rm) can be neglected. From the differential of equation1.18
1.19
4
- 2M~pm
- M(
d2f/dc2)(1/8~)
1.20
1.21 wh.ref5m is the wav.~bW of maximum amplification. equation 1.16 simplifies to
(c-co) = eXP(Imt).wAj3cosys.r}+ ¥sin<p.r» 1.22
After some finite time the composition will be represented
-wavenumber
Figure 1.5
The form of the
a.mpli~<Xl.'Wn...lfactor in
by a superposition of sine waves of fixed wavelength, but random in orientation and phase. Cahn (1967) has shown by numerical simulation that in an isotropic solid this leads to a strongly interconnected two phase structure.
Spinodal decomposition during isothermal holding
From equation119
~m
=
21""1'/;dm = 4n(K..Vm/()}F/~c2»)~ 1.23 where the molar volume (Vm) has been included so thatb2F/~C2 is the second derivative of the molar free energy
1.24
here ATs is the undercooling (below the spinodal boundary) and S is the molar entropy.
Equation1.24 is shown in figure1.6 (after Cahn (1968».
A time constant that is representative of the process can be det"ived from equationl20, and Cahn has shown that as the maximum growth occurs at undercoolings of about 10% the minimum time required for the process is approximately
1.25
where
Tm
is the maximum growth temperature.Cahn and Charles (1965) have simplified equation125 by approximating b2S/~C2 as 4R and M= VrnD/RT. For \ of 10 nm and T of 2,000K
t (min] ~ (10-14/D) 1.26
where D is the limiting diffusion coefficient(n\S-')
'"go 40 .
~
•
i
30A t 20
Composition 1/2
Cntlcal tempefoture 1000°1'\ WO'lel.nQ'h ).In...nlts of rh ..
int.ractlon d;.tanc. oj!
10 .
°O!---:IOI:---::2l,-0__"3~O ___j4L-O_J~0L-_J60-·7t-~-~-···-i&,-AT (C')
Undercoo""; beloW' spinodal
Figure 1.6
The relationship between the maximum
amplified wave number and undercooling into the
spinodal region (after Cahn(1968».~
~~~
d\bl"onCA.
t")
-.wUl d~d ondh& ~ Spe.c.LeS o.n.cl the l:.~ot
~d~, ~ukJo
a.
~to..pproJC; m.cuion
-10 2
-1
\
range e.g. D
=
10 ms, ~ell above the glass transition andD
=
10 -20m~S-1 well below it. The minimum '=\.M&.tna..y~be.anything from a few hundred seconds to microseconds.
Once the spinodal structure has developed it will start to lower its interfacial energy by coarsening and will
start to lose connectivity. These later stages have been considered by Cahn (1966).
Spinodal decomposition during continuous cooling
In some glasses there is considerable decomposition during the cooling to and from the isothermal treatment temperature. It has been suggested that this may explain the disagreement between the theory and the experimental evidence concerning the phase separation of some glass
compositions. It is important, therefore, to establish the kinetics of the process during continuous cooling.
This has been considered by Husten, Cahn and Hilliard (1966) who found that the resultant structure should be qualitatively similar to the isotherm.l case, but since Xm is temperature dependent (equation 1.23) a range of wavelengths undergoes maximum amplification. Initially
the average wavelength of the transformation increases as
1/6 power of the quench, but eventually this weak dependence is 'lost. Figu're 1.
1.
shows the results of Husten, Cahn andHil1iar~ and"m figure
L8
linear quench rates are superimposed ,~, the isothermal T-T-T diagram (after Husten, Cahn and Hilliard (1966» to show the relationship between the two extreme cases of isothermal and continuous cooling.Intersecting growth theory
-E
C!t 007
o
6~--~--~ --~
-2 0 2 4 6
log (-dT/,Jl)
[image:36.565.42.479.404.768.2]8 10
Figure 1.7
The relationship between the maximum
amplified wave.number and the linear cooling rate
(after Husten, Cahn and Hilliard (1966»
_-__,---r---....- ...-..·---T-·--~---.,
1.00
._
...
,
...090
,
,
\
\
oeo \
~ \
~'."
0.700.60
001 Qc
I \ 0.590_1
" loa
-159
\
\ 10.2Q \
I
.I,,-,- _.__ __
~_O'
L
l_J'O
10 10
Time (arbitrary units)
Figure 1.8
The time-temperature-transformation.
for spinodal decomposition.
Superimposed on this
are thermal histories
repr-een..t:lrt.g
linear quench
rates (broken lines)
(after'tiusten, Cahn and Hilliard
compositional changes initially increase the free energy so spontaneous decomposition cannot take place. However,
once nuclei have formed they can grow to lower the net energy. The rate of formation of nuclei (I) will be proportional to the probability of the formation of the nuclei i.e.
r
=
Kexp - <l\Gc-tAGd ) 1.27 kTwhere K is a proportionality constant,6Gc is the energy required to form a critical nucleus, and~Gd is the energy associated with the limiting process i.e. the diffusion to the interface or the viscous flow through the interface.
Figure 1.9 shows the temperature dependence of r;
this first increases with undercoo1ing (due to the decrease in Gc) but then decreases as transport becomes more difficult.
The growth rate/temperature relationship is subject to the same driving force and limitations, and so has a similar temperature dependence. The kinetics
depend on the controlling mechanism. limited, the precipitated phase grows to (time)~; if interface controlled, grows linearly with time. Generally,
of the growth stage
rf the growth is diffusion at a rate proportional the precipitated phase the process will be limited by a combination of these two factors and the growth rate is intermediate.
Eventually, according to the intersecting growth theory the randomly sited nuclei grow to touch one another and so
form a continuous phase microstructure. Haller (1965) has shown that a highly .interconnecting microstructure could develop,
1
4w---
critical
temperature
nucleation rate
~
Haller showed that even for a 30-70% (which corresponds to the spinodal limit for a symmetrical metastability boundary) less than 5% of the droplets are isolated.
Haller's simple statistical model cannot be directly applied to the classical nucleation and growth model, since there is no mechanism by which diffusional growth alone can lead to interparticle contact. Goldstein (1968) has observed that because of the depleted zone around each particle
the two interfaces will only grow parallel to one another. Haller and Macedo (1968) have proposed several mechanisms
to overcome this difficulty including the introduction of a diffuse interface rather than the classical sharp interface. This modification has also rec~tved support from Hopper and Uhlmann (1970).
A comparison of the two mechanisms
The morphologies developed by the two models are
compared in figure 1.10. Figure 1.10a is after Cahn (1965) showing the structure predicted by spinodal decomposition and figure LlOb shows the morphology produced by the intersecting
growth model after Haller (1965). The similarities between the two have led Tomozowa (1978) to suggest that it is not possible to differentiate between the two by a morphological analysis alone.
One unambiguous difference between the two is that during classical nucleation and growth the composition of
the second phase is constant, but during spinodal decomposition the compositions of both phases change continuously. This is illustrated in figure 1.11. (after Cahn (1968». This
o.
b.
Figure 1.10 The structure predicted by spinodal decomposition (a) and by intersecting growth (b)
(after Cahn~1965) and Haller (1965».
EARLY LATER
•
Ca
--.---,----_...:"'--... .
Co~ - ...-:;:-.-+----X---=----+--f
CQ-~---~---.-Cl .9
j
i
8
C~ _ - __
..---r--,---..,~..,
- t
t-FINAL
leaching rate.
1.3 The leaching of glass to produce a porous skeleton
When an alkali silicate glass is exposed to water, protons are exchanged for the monovalent ions which then form alkali hydroxides e.g.
1.29
The hydroxyl ion produced by this reaction can then attack the silicon-oxygen network e.g.
(- Si - 0 - Si -) + (
OH-) ~ (-
Si -01
+(=
Si - 0 -) 1.30 If the glass is in contact with acid instead of water, the alkali reaction product is neutralised and unless the acid actually attacks the Si - 0 - Si linkages ( as with H'F and H3P(3) this network is left intact. Further, ifth,' .slasl is .eparated into Lnterconnec ting phases, one of~llica ancJ'the other of an alkali-borate or a
~.~~l.rly .oluble glass,then that phase can be removed leavinl a skeleton of silica.
, ,~!~eJ' aqd Hood (1940) found a range of
alkali-,
...'~'.,., ._.,_
borosilicates that could be leached free of virtually all non-l!l~s~te!,~pp,'it\lents after suitable heat treatment. ,:.J;I'le. POJ:'oqf;'M.~p1';l.J: produced is known as Vycor and its
,-::, ..".
fP.to~~t~on\~nd:p'_'operti~s .have been reviewed extensively
i.\t,Wp~ft
,(196~.J."
The composition of the parent glass "j,.I~crlt~c.~ for ..sf!veral reasons. Firstly, the glass mustl:f,.e
iq;
tb~,cent;e of the immiscibility region so that the ~woph_" ••
may be continuous. Second ly , it was found that stresse. are built up in the leached glass (due to hydration) during to the leaching stage. Glasses bavlnlcompolitions near an empirically determined line-on the ternary phases diagram (Wolf (196lb» are not as subject to this effect. This effect can also be reduced by incl~ding ammonium chloride in the leaching solution
(Eguchi, Tasaka and Tarumi (1969» although the reason for this is unclear.
The leaching rate of alkali-borosi1icates has been studied by Charles (1964), Shimbo (1972) and Eguchi, Tasaka and Tarumi (1969), who concluded that it was determined by the size of the microstructure. However, Takamori and Tomozawa (1978) reported that it was the composition of the chemically less durable phases, which controlled the rate.
As well as alkali borosilicates; alkaline earth-alkali boro silicates containing zirconia can be leached in acid to produce an integral porous skeleton (Nordberg (1950». E-glass, a multicomponent alkali free glass can be
leached to yield a porous skeleton (Nordberg and Hood (1950 »). and barium-borosilicate glass is also known to retain
integrity during ·leaching (Kusnetsov (1974».
1.4 Desalination
Sodium chloride dissolves in water releasing an amount of ~ known as the heat of solution. This,
therefore, represents the minimum energy requirement to reverse the process i.e. to desalinate the solution. This is demonstrated in the following section and
then ~he requirements of real de~~linatlon processes are estimated.
1.4.1 The heat of solution
The dissolution of an ionic crystal can be modelled in two steps, first the ions are removed from the crystal surface into a vacuum, and then they are plunged
-into the solvent. The energy required to remove a pair of ions is given by the Born theory
2
(Ae / a )(1 - 1/n ) 1.31
where A is the Madelung constant, a is the interionic
spacing, e is the elemental charge and n is the Born exponent.
The energy released on submerging the pair into the solvent of dielectric constant E is
2
- (e / 2€. )(1/r 1
+
1/r2 ) 1.32 where rl and r2
are the ionic radii.The net change in energy is then
E -(e2/a)(A(l-1/n) - (l-l/~
»
1.33 for rl ~ r2 '::! a/2.For water
e
is of the order of 80 and n '::! 9 for NaCl soE is negative and the process 'is spontaneous.
Thermodynamically, the energy released can be described as
RT In a
o
where R is the gas constant, T is the absolute temperature and
80 is the .activity of the solution relative to that of pure
1.34
water.
1.4.2 A nearly ideal desalination process
Rather than finding the minimum energy for desalination by- just using the tabulated data for heat of soIYrt1.e'C\.
(e.g. Handbook of Chemistry and Physics (1975», it can
be calculated in the cont ext of a desalination process. Howe (1966) has illustrated this limit by devising the nearly
ideal desalting process shown schematically in figure
1.12.
B
pump
A
[image:44.564.43.509.139.596.2]sal ine solution
pure water
Figure 1.12
A "nearly" ideal desalination
and the other (B) a saline solution.
Without the pump, the
lower vapour pressure in
Bwould induce water to condense
into the saline solution.
To reverse the process the pump has to
overcome this pressure difference.
As the process is purely
mechanical
the energy required is simply
w
=::s
Pdv1.35
If the process is performed reversibly and the salt
concentration of chamber B does not change, then
W
=
Pa Va In(Pa/Pb)
1.36
where Pa is the vapour pressure of pure water
Pb
is the vapour pressure of the saline solution
and Va is the specific volume of the pure water vapour
At
20
0e
and for I molar salt solution
an.d
Pa.=
Va
=
Pb
=
2.34 KPa
} Obtained from steam tables
2 -1 ...
57.8m
Kg(Mayhew and Rogers (1972»
2.27 KPa
Obtained from International
critical tables of numerical
data (1928)
This siye. W as 4.2 MJm-3 which is in approximate
agreement with the minimum calculated from heat of solution
data.
1.4.3
Real desalination processes
Commercial desalination processes have been the
subject of many reviews
(e.g.
Diamant (1974),
U.K.E.A.
(1967) and Howe (1966) and may be divided into two
eategories
- atherma1 and isothermal.
Athermal
techniques include the most common process, that
pressure of NaC1 to effect the separation. Other athermal processes include freeze separation, hydrate separation and liquid-liquid separation.
Isothermal techniques are primarily e1ectrod~dljSis,ion exchange and reverse osmosis. In ion exchange the two ionic species are replaced by acid and basic radicals, and these are allowed to react to form more water. In e1ectrod~aJ~Sis,
an electric field is used to deplete the solution of ions by forcing them through cation and anion permeable membranes. In reverse osmosis, mechanical work is used to force the solvent through a semi-permeable membrane.
I
1.3.4 An estimate of the energy requirements 'of real desalination processes
Real desalination processes use more than the minimum energy to effect the separation. To indicate the potential advantage of isothermal techniques, the practical energy iequireme!Ots of three representCll:ive processes will be estimated in this section. To simplify this estimate, it is assumed tflat';all the stages in the process are equally efficient,
o.nclJha.t: ~
Jde.al
(ttversible.) "",orl<.
re.q\.\.Akd ~~fot'rt'\
~
apCU'O.t.on<
~ne.9"'f1t'bla..
CXln\pa.red. ~
Jho..t
0,..
1t\aLhetf.i.clenus ot-Jt\A
pro~es
.
.Thermal distillation
",
"
~at.the solution Vaporise Condense Cool toto its boiling ~
1m3
4-1m3
+-
input.
pointtemperature
H -
- Lv
+
LvwheraCJ and C~ are the specific heats of the saline solution and water,
6.
rJ!1
and6.
TW are the temperature differen·ces-between the input/output temperature and the boiling points of the saline solution and water respectively. Lv is the latent heat of vaporisation. For 1molar NaCl solution at
o i i s CWp
20 C and approx mat ng Cp
=
H - -4.2 x 10⁶ ~ 84 -2,000 x 106
+
2,000+
106+
4.2 x 106x80 so for an efficiency of (I-a), the total energy cost is-3
4.6a GJm •
Freeze separation
Cool the solution Crystallise Melt Heat to input to its freezing
~
1m3
~ 1m3
~ temperature.point
H -
+
Lf- Lf
where
6T
s and 6Tw are now the temperature differenceebetween the input temperature and the two freezing points. Lf is the latent heat of freezing.For 1 molar solution at 200C and approximating C~ as
cJ
H
-4
.2xl06 x 23+
330 x 106 330 x 106 - 4.2 x 106 x 20If
at each step the efficiency is ( l-b), the energy-3
cost is .8b GJm •
levers.
osmosisPreSsure solution Force through Expand water to oper~ting
r?-
membrane to 1abtDapherei pressure
where p is operating pressure,
«
is osmotic pressure andv is volume compressivity.
For a 1 molar salt solutionll-20 bars. For an operating pressure of 100 bars.
W
=
-
100 x 105 x 1 - 20 x 105 x 1+
80 x 105 x 1With an efficiency of (l-c) the energy requirement is .02c GJm-3• In tab1e1j the energy requirements of these three processes are compared with the ideal limit. It is clear, from tab1e1j that reverse osmosis and other isothermal processes have a potential energy advantage over atherma1 techniques providing that the efficiency parameters a,b and c do not differ by more than an order of magnitude.
1.5 Porous glass for reverse osmosis desalination:
A
reveiwIn this section the scale of the membrane microstructure required for desalting applications is established by
reviewing published data on reverse osmosis desalination using porous glass. The performance of the membranes is characterised by two phenomenological parameters. The flux rate defined as the product in cubic meters from one square meter of external surface area in one hour which has the
-1
units mhr and the rejection coefficient defined by
rejection
%
3 Cf - Cp x 100Cf
where Cf is the feed concentration in weight
%
NaC1 andC~
is the product concentration also in weight %NaC1.Nordberg and Hood (1938) first suggested that porous glass may act as a semipermeable membrane and later Kraus et al (1966) reported measurable salt rejections from porous Vycor membranes. The preparation and performance
-Table 1.1 A comparison of the estimated energy requirements of several desalination processes
PROCESS
ENERGY
-
1m3DIS T1LLATION .,
460ChMJFREEZE SEP.~
SOObMJ
R.O.""
20cMJ
IDEAL
4.2MJit
These.
eshi'nc::Ue.s
are.
ot ~
~~t.eSC;en.erg~
~tU.n!mertt"
i..e..
oj)()~ti\.o..t
Or
Jt\ ~
JdeDl..
[image:49.565.138.493.80.365.2]of membranes produced from Vycor and Vycor-like glass
compositions has been discussed by Phillips et al (1974), McMillan and Matthews (1976), Elmer (1978) and reviewed
by Schnabel and Vaulont (1978). Schnabel and Vaulont in describing the engineering aspects of reverse osmosis
desalination, emphasised the importance of having turbulent flow at the solution/membrane interface to reduce concentration polarisation. Most investigators have used a recirculating feed solution to achieve this, but Elmer used an essentially static system which was stirred at some distance from the membrane. Probably, because of this he could not" correlate
the rejection of the membrane with its pore size and instead considered that the rejection mechanism was due to a secondary precipitate in the pores of the glass. With the exception of Elmer, all workers have found that as the pore size is decreased, the salt rejection tends to increase.
Phillips et al found that the salt rejection of porous Vycor membranes could be improved by partially collapsing the
pC)l:esby thermal. tre.atments near the sintering temperature.
'.l1ler
.ch1evec1.rejection coefficients of up to 88% (usinga
3.~
wt% Na Cl) with a product flux of .2 ~-l for membranes with 2nm radius pores. McMillan and Matthews tried tominimise the pore size by including
A1
203
in the parent glassto slow the phase.separation reaction. They found that this
was
more controllable and reported rejections of the order-1
of 60% at a flux of .002m.hr for membranes with pores of 2.6nm radius.
The performance of porous Vycor membranes supplied by the Corning Glass Company has been investigated by Be1fort
(1972), Ballou and Wyderal (1972) and Littman and Guter (1968). All used a glass known as Corning Code 7930 which has a
nominal pore radius of 2 nm. The rejections reported are
-all of the order of 60% (using a 0.1 weight % NaC1 feed) but Ballou and Wydevan found evidence that the rejection
increased dramatically if the pore size was reduced below 2nm radius. They reported a rejection of 92% for membrane having a pore size distribution peaked at 1.9nm.
Membranes based on glasses of the Vycor composition
but containing nucleating agents to modify the microstructure have been prepared at the Stanford Institute (Littman and co-workers (1968-71). Amongst these membranes, one
produced from.a parent glass containing zirconia has been evaluated as an osmosis desalting membrane by
Belfort (1972) and Littman, Kleist and Croopnick (1971). With this membrane (designated AG-39)sa1t rejections of over
70%
have been reported.Schnabel and Vaulont (1978) have made desalination measurements using a porous Vycor membrane which has been modified by organic treatments. Rejections as high as ;'.97%have been reported by them with.O.S weight 7o.NSCl
-1
;f~ed solutions at product fluxes of 0 .001 m~t' • In
figure: l:,.ll the data of Ballou et al (1971), McMillan and Matth~si (~976), Kraus et al (1966) and Littman and Guter
'.
(1968) are .shown , It is clear from this figure that salt t.jection improves rapidly if the pore size of the
•
glas8 can be reduced below 2nm.
1.6 Obl.ctives of investigation
t
The aims of this programme were:
i to investigate the interconnected microstructure and its relationship with thermal history
-100
90
80
70
60
§
50
.-40
30
20.
10
e
Ballou et
at
(1971)
•
McMillan et
at
(1976)
•
Kraus et al (1966)
•
Littman et et
(1968f
o ~~_.--~--~--~~--~
2.2 2.4 2.6 2.8
median pore
radius/.
[image:52.565.41.539.23.742.2]nm.
Figure 1.13
The salt rejection of porous glass
membranes
a.
a
function of the median pore size.
A compilation of the data of Ballou et al (1971),
McMillan
and Matthews
(1976) and Littman and
iii. to develop- and characterise a microporous glass membrane for reverse osmosis desalting applications.
1.7 The research programme
As practical 'isothermal' treatments to induce phase separation in glass involve athermal cooling and/or
beating stages, there is always Some ambiguity in relating the resulting microstructure witb the treatment. For that reason it was decided to restrict this investigation to glasses which have rec~~Ved no isothermal treatments
i.e. which were continuously cooled from the molten state.
The experimental investigation was divided into three parts:
8. the production of phase separated glass and an
investigation of its microstructure by two composition dependent properties: electrical conductivity and viscosity. These measurements were correlated with the thermal history of the glass by the measurement of its cooling rate. b. the leaching of the parent glass, including a
study of the important parameters in the leaching process i.e. acid concentration,leachant temperature and time in the solution. The porous product was characterised by transmission electron microscopy and gas adsorption measurements.
c. the preparation o~ hollow fibre membranes and an evaluation of their reverse osmosis desalting properties.
1.7 Plan of Thesis
/
investigated is described together with a description of the glass preparation. The experimental techniques used
to study the microstructure are also described.
The leaching of the glass is fully described in Chapter 3, together with the experimental details of the techniques used to characterise the porous product. As the gas adsorption measurements are central to the argument presented, the
theory is t.r&QJ:ed.. ~
de.txU.L.
Chapter
4
contains the results of the analysis of the parent glass and a brief discussion of the implications of the results.The results of the investigation of the porous glass are presented in Chapter 5 and the optimum leaching
conditions for the production of an integral porous skeleton are discussed.
All work concerning reverse osmosis desalination is contained in Chapter 6. The experimental arrangement used
is
described. the characterisation of the porous membranes and th. J"e$u.ltsof tb.emeasurements are presented togetherwith
a
4i8<:u$&100 of the operational performance init ••• of membrarue pore size.
ie.!; {lnChapter7 the. results of all the investigations
."'"'ii4*fwntoaether~nd further conclusions are made.
B_.ful,da.t~otls] for future work are also included in this
se<;tloq.
-CHAPTER 2
The production of the parent glasses and experimental details of the measurements on these glasses
2.1 Introduction
In this chapter the reasons for the selection of the basic glass composition investigated are presented. The logic of the subsequent generation of a series
of compositions from the basic composition is also
outlined together with a description of the preparation of the glasses. An account of ~he experimental
techniques employed to characterise them is also given.
The experimental techniques selected to characterise the glasses were: the measurement of critical opalescence, viscosity and d.c. resistivity. Electron microscopy
was also evaluated, but it was found not to be 'sultablefor this part of the research programme.
TH:e observation of critical opalescence is the most commdrity USed technique to estimate the metastability limit l'fr
glass.
This involves determining the highest t~lIlpetatureatwh1ch opalescence can be induced, and the'I()W~st
temperature at which opalescence clears. TocaUl.
opalescence, the scale of the phase sepQt'ation':/'
mUsfbe of the order the wavelength of visible light. Tbeclearirigtemperature may then only indicate the temperature at
whieH
submicron phase separation is present, and so underestimate the metastability limit. D.c resistivity measurements were made to complementthe critical opalescence measurements. This is a soongly
-compositionally dependent property and shou Id be sensitive to the compositional changes occuring at and below the metastability limit.
Viscosity measurements have also been used to determine the metastability limit in several glasses (Haller, Simmons and Napolitano (1971», and as the viscosity/temperature relationship controls transport processes in the glass, the measurement of viscosity was of special interest.
2.2
The selection of the glass compositionsAlthough many glass compositions yield phase separated
glass, only a few produce the interconnected phase microstructure necessary for the production of a porous material. As it
was one of the primary aims of this investigation-to produce such materials, it was clearly important to base this study on a glass composition known to be suitable for the production of porous glass. This restricted the potentially applicable gla8s compositions to those described in section 1.3 •
Most desalting of hollow
of the previous work on the reverse osmosis
performance of porous glass has centered on the use
f' ~
fibre membranes. This form of membrane is mechanically suIted to withstand the large hydrostatic
p~~~sures applied during the desalting process and produces ~'large product flux because of its great external
surface
to volume ratio. The hollow fibre membranes previously'0" " .'.
iovestigated were manufactured from parent glass hollow fibres, themselves produced by 'drawing down.' larger glass tubes. As a consequence of this, they have a complex
thermal history. Since it is possible to produce hollow fibres directly from the glass melt and to produce porous
-glass skeletons from certain glasses which have undergone no isothermal treatment, it was decided to investigate
the microstructure and its relationship to the leaching of fibres drawn directly from the glass melt. The
thermal history of such fibres is relatively simple, being that of continuous cooling.
The two theories of decomposition in glass predict optimum connectivity for glasses having two phases of equal volume fraction. If the volume fraction of the two phases is dissimilar then the microstructure of the glass will show only limited connectivity according to Haller's
intersecting growth model; and only tenuous connectivity according to the theory of spinodal decomposition. In a three or more component glass there may be more than two phases induced (by analogy with the Gibbs phase rule) but as far as the leaching properties are concerned the
glass may be considered as having two phases: acid soluble and acid insoluble (silica phase). For a systematic study of the interconnectivity of these two phases it is
importan~ therefor~ to be able to vary the relative proportiofis of these phases.
Glass
forrnatfon>in multicomponent glasses likeE-glass is generally insensitive to the concentration of any particular constituent. Stevels (1954) and Huggins (1954) have shown that in some multicomponent glass compositions U:ls possible to vary the Si02 content over a wide range andst:ll1produce glasses. The relative insensitivity to the Si02 cpntent of glass formation in compositions
of the E-glass family was confirmed in preliminary experiments and this material was selected as a starting point for
this investigation.
-To summarise E-glass was selected as the basic glass composition for this investigation because:
i it is known to phase separate and form an interconnected microstructure, suitable for the production of porous glass,
ii it is suitable for the production of hollow fibre membranes with a simple thermal history
iii glass formation is relatively insensitive to the Si02 content.
That E-glass could be leached free of virtually all non-silicate constituents was first recognised by Nordberg and Hood (1950) and this forms the basis of the production of a commercial high silica fibre known as .Refrasi1. The composition of commercial E-glass varies within the limits shown in ~ab1e 2.1. Table 2.2 shows the composition of the
o
leached glass after drying at 100 C.
The material is designated E-g1ass because of its high 11ectr!cal reslstivitywhich is primarily the result of its low aJkali content. It is used as a general purpose glass fibre
in
many, applications (Lowrie (1967». The.. .• 0
composition of E-glass is based on the eutectic at 1170 C in the A1203-CaO-SiOa ~ystecn but it contains B203 (replacing 81°2) to improve its f.ibrefonn1ng properties and MgO
(replacing CaO) to£actlitate melting.
E-glass fibres·were used extensively by investigators studying the mechanical properties of glass fibres
(e .g. Holloway (1960), Bartenev and Ismailova (1962)
and Thomas (1960» but phase '.~lQft in this glass has been studied only by Hammel and Ohlb~rg (1965), Oh1berg
-~ ~
....
n ~,.,.
....
o e • • ~ .~ ~....
o. OQ,.,.
o o..
r
I1
\0 00 \0
...
• 0 U) N L 0»
• ~ ~ VI 0 U) L..-0 o • ~ 0 00 0 ::It • ~ ~ 0,JP
·
0 0 N U) 0 !Z: •.r
0 I-' 0 0 t-i•~
S
... N 0 "z:t • ~ 0 ... W
.
N5i
~ n oa
'8
...
M...
o :J o Hl...
~ III o ::T ~ Q. M I OQ ~ III fIJ fIJ•
-
I-VI VI
0\ N .00...
0
N
-...
...
»
0\ N N
...
0 U) N ~ o VI 0\ Q) 0
0\ 0
::c
~
~ Ntd
w 00 0
W
:.,_
+
2:w 0
~rJ'
la.
is
0-•
~ 0 t-i
...
0
N
~
-• •
~ 0 "z:t