ISSN Online: 2152-7199 ISSN Print: 2152-7180
DOI: 10.4236/psych.2017.814148 Dec. 8, 2017 2346 Psychology
Comparing Countries’
Life Satisfaction and
Their Level Curve
of Life Satisfaction
over Time:
An Analytical Framework
Oumar Bouare
Research Centre in Economic and Social Sciences, Bamako, Mali
Abstract
Life satisfaction or happiness is an elusive concept, making it difficult to ag-gregate, measure and compare at a country level. Therefore, we propose an analytical framework, which can determine life satisfaction and the level curve of life satisfaction over time in countries. We then address four countries as cases: the Netherlands, the UK, Belgium and France. The Netherlands has the highest ranking of life satisfaction by year and the level curve of life satisfac-tion over 1986-1995. This analytical framework allows for the direct interces-sion of a country’s legislator on welfare issues, strengthening social coheinterces-sion that may foster country’s economic development.
Keywords
Life Satisfaction, Life Dissatisfaction, Level Curve of Satisfaction over Time, Unit of Measurement
1. Introduction
In the 20th century, attempts of social reform influenced efforts to create wel-fare-states in order to provide a good life for everybody, particularly a good ma-terial standard of living. With the improvement of people’s living standard, life satisfaction has become a hot topic. However, life satisfaction or happiness is an How to cite this paper: Bouare, O. (2017).
Comparing Countries’ Life Satisfaction and Their Level Curve of Life Satisfaction over Time: An Analytical Framework. Psychol-ogy, 8, 2346-2376.
https://doi.org/10.4236/psych.2017.814148
Received: August 8, 2017 Accepted: December 5, 2017 Published: December 8, 2017
Copyright © 2017 by author and Scientific Research Publishing Inc. This work is licensed under the Creative Commons Attribution International License (CC BY 4.0).
http://creativecommons.org/licenses/by/4.0/
DOI: 10.4236/psych.2017.814148 2347 Psychology elusive concept due to its subjective nature.1 For many people it is an ultimate goal. Even in the United States of America’s Declaration of Independence, there is a reference to “the pursuit of happiness”. Life satisfaction however is never complete or constant because an individual’s state of life satisfaction is relative to his or her subjective assessment, which depends on the evolving environment in which he or she lives. If the state of life satisfaction, happiness or pleasure was to be constant, life would become monotonous. In addition, as opposed to dissatis-faction, satisfaction is unimaginable without dissatisdissatis-faction, just as Paradise is unimaginable without Hell, because one loses meaning without the other. These features of life satisfaction make its construct and definition difficult.
However, since the state of life satisfaction may be at different degrees for dif-ferent people, it needs to be defined. Defined simply, life satisfaction is “the de-gree of well-being experienced by individuals or aggregates of people under pre-vailing social and economic conditions” (Møller & Schlemmer, 1983). This makes the aggregation and cardinal measurement of life satisfaction problematic at a country level in general,2 and a comparison of countries’ life satisfaction even more problematic over time. This paper therefore proposes an analytical framework to aggregate, measure and compare countries’ life satisfaction as well as their level curve of life satisfaction over time.
In the first part, we review the literature. Next, we discuss ways to compare countries’ life satisfaction. We then suggest a means to compare countries’ level curve of life satisfaction over time. This is followed by the section on discussion and conclusion. Finally, we present some limitations of the study and future research.
2. Literature Review
There is a voluminous literature on life satisfaction and happiness, including so-ciology, psychology and economics. The forerunners of the introduction of psy-chology into economics were Hume (Lyon, 1970), Bentham (Ekelund Jr &
1This paper is concerned with life satisfaction. However, we will refer to “happiness” from time to
time because it is often used by researchers due to its close relationship with life satisfaction. Ac-cording to Veenhoven, “The word ‘happiness’ … is used interchangeably with terms like “well -being” or “quality of life” and denotes both individual and social welfare” (2012: p. 334). Happiness could be defined in the sense of Veenhoven as “the degree to which a person positively evaluates the overall quality of his/her life as-a-whole” (1996). According to Argyle (1987), “[h]appiness can be understood as a reflection on satisfaction with life, or as the frequency and intensity of positive emotions” (13). It follows that studies of “happiness” or “life satisfaction” will yield different results. Moreover, happiness can be a major factor affecting life satisfaction. For instance, one may be on balance unhappy but satisfied with life because of making contributions to advance the happiness of others (Ng, 2000). On empirical grounds, Di Tella et al. (2003) using Eurobarometer Surveys series reported that the correlation coefficient between happiness and life satisfaction is 0.56 for the pe-riod 1975-86 (4). In our study, we will use life satisfaction because the questionnaire administered to respondents was on life satisfaction. However, even if happiness were used, it would not under-mine the generality of our analysis. This is so because the technique used to deterunder-mine a unit of measurement for life satisfaction or happiness will remain the same although the percentage of respondents who are satisfied with life and that of those who are happy will be different.
2It should be noted that Ng proposed an interesting cardinal measurement of happiness based on a
DOI: 10.4236/psych.2017.814148 2348 Psychology
Hébert, 1990) and Keynes with the concepts such as the propensity to consume, marginal efficiency of capital and liquidity preference (Keynes, 1936). More re-cently, these scholars were followed by Easterlin (2002, 1974), Kahneman et al. (1997), Frey & Stutzer (2000a, 2000b), Di Tella et al. (2003, 1998), Helliwell (2003) and Layard (2003).3 We selected some of these for an overview before proceeding with the aggregation, measurement and comparison of countries’ life satisfaction.
The scientific engagement with satisfaction vs. dissatisfaction or pleasure vs. pain can be traced back to Adam Smith and Jeremy Bentham’s interpretation of the principle of utility or self-interest. Smith championed the idea of the natural identity of interests, which placed a great deal of confidence in natural order and harmony. He believed that the individual self-interests of human nature har-monize on their own accord in a free economy; consequently, his basic prescrip-tion essentially promoted a laissez faire policy (Ekelund Jr & Hébert, 1990) even if he stressed that when people in the same trade meet on social occasions they often conspire against the public interest.
Bentham, however, admitted that individuals are self-interested, although he denied any natural harmony of egoism. Crime, for example, provides a case of self-interested behaviour that violates public interests. The central tenet of Ben-tham’s philosophy, therefore, was that the interest of each individual must be in line with the general interest, and that it is the business of the legislator to bring about this alignment through direct intercession. Thus, it was in the form of the artificial identity of interests framework that Bentham first adopted the utility principle. His doctrine is known as utilitarianism.4
Utilitarianism added to hedonism the ethical doctrine that human conduct should be directed towards maximizing the happiness of the greatest number of people: “the greatest happiness for the greatest number” was the catch phrase of the utilitarians.5
According to Bentham and the utilitarians, the general interest of the com-munity is measured by the sum of the individual interests in the comcom-munity.6
There are several analytical difficulties in Bentham’s theory, among them “in-terpersonal comparisons” of utility. That is, one man’s happiness may be anoth-er man’s distress.7 Another problem in Bentham’s theory concerns the weighting
3This renewed interest is presumably due to the impact of economics on life satisfaction: the increase in demand and supply when consumers and
producers’ confidence is high concerning future prospects in life or life satisfaction, the availability of data, and a need for a better measurement of life satisfaction in order to more accurately assess the relationships between life satisfaction and economics.
4This doctrine bears a resemblance to the ancient Greek philosophy of hedonism, which also held that moral duty is fulfiled in the gratification of
pleasure-seeking interests. But hedonism prescribes individual actions without reference to general happiness.
5This phrase can be traced back to “Scottish Enlightenment.” According to John Rae (2003), the original author of that famous phrase is Francis
Hutcheson, beloved Adam Smith’s professor at Glasgow College.
6The utilitarian approach was both democratic and egalitarian. Each individual interest was to receive equal weight in the measurement of general
welfare. Thus, if something adds more to a peasant’s pleasure than it subtracts from the happiness of an aristocrat, it is desirable on utilitarian grounds. Likewise, if a government action enhances the happiness of the community more than it diminishes the happiness of one subset, inter-vention is justified.
7The fact that different individuals have different tastes, incomes, goals and ambitions makes comparisons of utility (gained or lost) between
DOI: 10.4236/psych.2017.814148 2349 Psychology of qualitative pleasures. Do pleasures of the mind, for instance, receive more or less emphasis than pleasures of the body? Bentham could not resolve this ques-tion. In addition, there is a shortcoming in Bentham’s theory: the “fallacy of composition.” This fallacy entails the assertion that because something is true for a part, it is also true for the whole, or that the collective interest is the sum of in-dividual interests (Ekelund Jr & Hébert, 1990). However, one can overcome some of these analytical difficulties at a country level if an appropriate weight can be determined. The realization that interpersonal comparisons are necessary for normative issues of economic policy has led to renewed interest in Bentham’s concept of measurable and interpersonally comparable utility (Kahneman et al., 1997; Muller, 2003). Thus, there has been an increased interest in studies assess-ing the relationship between socio-economic factors and happiness (e.g. Clark & Oswald, 1994; Gerdtham & Johanneson, 2001; Theodossiou, 1998; Winkelmann & Winkelmann, 1998). Diener & Lucas (2000) presented an excellent and com-prehensive literature review on the differences in societal levels of happiness, need fulfilment, relative standard, culture and evaluation theory.8
Although the sociological construct of life satisfaction or happiness is not complete and its determinants are not fully exhibited, its measurement has been underway for a long time, presumably because subjective indicators may be used as social and economic policy tools if they are refined to reach a high degree of accuracy (Møller & Dickow, 2002; Møller, 2001). This may allow for the refine-ment of social indicators. Happiness has been measured since the 1960s.9 A
8After a thorough review of these theories, Diener and Lucas (2000) propose an evaluation theory. According to their proposed evaluation theory,
subjective well-being refers to the summation of evaluative reactions that occur when an individual encounters external stimuli. Evaluation theory also acknowledges that there are basic individual differences in the way people react to information from an environment. In summary, evaluation theory maintains that subjective well-being results from the evaluations of incoming information that has relevance for well-being. Certain types of information are likely to be chronically salient, and therefore have ongoing effects: the meeting of goals and biological needs, and cultural norms. Other types of information such as comparison to others or comparison to one’s past will be relevant in evaluating one’s well-being in specific circumstances. Over time, a person’s processing of information in terms of the meaning and values he or she attaches to it will be the paramount factor governing long-term subjective well-being.
9The so-called “happiness surveys” undertaken by Gurin et al. (1960) and Bradburn and Caplovitz (1965) to assess global well-being were the
forerunners of the later in-depth studies of psychological well-being. The latter were conducted by Campbell et al. (1976) among others, who also experimented with the use of affective mood indicators in measuring contentment in more specific domains and spheres of life. However, Drew-nowski’s (1974) first attempt at compiling comprehensive measures of well-being set the stage for universally applicable development programs aimed at raising the level of living of the world’s poor. The so-called “basic needs” approach to development succeeded in attracting a large num-ber of policy makers as well as social scientists. Generally, development targets in the basic needs strategy fall into two separate but complemen-tary need categories:
1) Personal consumption needs such as food, shelter, and clothing; and 2) Essential public services such as health, sanitation, clean water, educa-tion, transport and cultural facilities. (For further informaeduca-tion, see Streeten, 1977; Lisk, 1977; Ghai et al., 1977; and International Labour Office, 1977). The prospects of adopting a basic needs strategy in the South African situation are discussed by Nattrass (1979) and Simkins (1980) among others.
It should be noted that the “absolute” indicators distinguished by Kamrany and Christakis (1970) refer only to those categories of “scientific indexes” on which experts have reached substantial agreement. In other words, normative judgments are always involved in determining scale values in quality of life measurements.
There is little agreement on absolutes, zero points and saturation thresholds with the possible exception of a lower-level threshold described as a “zero-level” or “survival with nil need satisfaction” by Drewnowski (1974), which is associated with a sub-human level of existence. By contrast, a “human” but minimum level of need satisfaction is only guaranteed when “basic needs” are met.
DOI: 10.4236/psych.2017.814148 2350 Psychology striking example of a measurement technique aimed at capturing the subjective component in defining the qualities of life is Cantril’s (1965) “self-anchoring” scale. Subjects were required to describe their life situation in relation to the “best” and “worst” worlds imaginable to them. More recently, Møller and Schlemmer (1983) proposed the index of “felt privation”, which was computed by dividing the percentage in each group adjudging an item to be among the 30 - 40 most important by the percentage expressing satisfaction with the issue. A minimum index of 1.0 was taken as the cut-off point. Finally, Veenhoven also proposed the measurement of average happiness across nations in World data-base of happiness, Catalogue of Happiness in Nations. In discussing the rationale of measurement of average happiness in Chapter 5 (Validity of happiness as in-dicator of livability) of the introductory text of Happiness in Nations (World
database of happiness), Veenhoven argued that: “[t]he observed differences in
average happiness between nations do not seem to result from cultural bias in its measurement. It is also unlikely that they result to a great extent from cultural variation in outlook on life. All in all, it is fairly probable that the differences in happiness, as observed in survey studies, do reflect differences in livability of na-tions” (emphasis added).
However, this does not mean that the observed differences in average happi-ness reflect differences in the livability of nations, nor does it mean that cultural variation in outlook on life has nothing to do with these differences.
This literature review suggests that a theory of happiness or life satisfaction needs a further sociological construct. In this regard, evaluation theory seems to be moving in the right direction. However, the measurements proposed remain relevant only within a single country. This is because life satisfaction or happi-ness is influenced by different factors in each country, and developed countries with similar livability conditions, for example, display a different average of happiness (see e.g. World database of happiness; Inglehart & Rabier, 1986; Veen-hoven, 1991). In addition, Easterlin found that “[t]he happiness differences be-tween rich and poor countries that one might expect on the basis of the within- country differences by economic status are not borne out by the international data” (1974: 106-7).10Di Tella et al. (1998, 2003) reduced biases due to culturally determined response behaviours by using country fixed effects. Helliwell (2003)
also used fixed effects to reduce biases due to culturally determined response behaviours but at regional levels. Although this technique is appealing in using a regression equation for cross-sectional studies, the coefficients of individual- specific dummy variables, which include unobserved effects, could give an al-most perfect but meaningless fit, i.e. could include the effect of other unobserved
10For further information on happiness, see Easterlin (2002). Moreover, Suh et al. (1998) found that
DOI: 10.4236/psych.2017.814148 2351 Psychology variables that have little to do with countries’ cultural fixed effects. Kapteyn et al. (2007) and Kristensen et al. (2008) used anchoring vignettes technique to study cross-country differences in self-reports of work disability and job satisfaction, respectively. However, this technique hinges on the assumption of “vignette equivalence”, i.e. “[t]he domain levels represented in each vignette are unders-tood in the same way by all respondents, irrespective of their country of resi-dence or other socio-demographic variables” (Kristensen et al., 2008). Kristensen et al. attempted to overcome this assumption by including more covariates in a chopit model, which provided them with a change in countries’ ranking; here the difficulty is that their results depended on the inclusion of more covariates and the choice of these covariates.
In their National Accounts of Well-being (NAWB), departing from the single question on whether respondents were satisfied with their life, which was gener-ally a means for measuring well-being, Michaelson et al. (2009) argued that “be-cause [NAWB] are not limited to measures of life satisfaction, they provide a more textured approach to understanding, what contributed to people’s well- being and therefore a basis for further exploration and action” (14). They went on to argue that “The practical up shot of all of this for well-being measurement is that attempting to assess a psychological state using a single question such as the satisfaction is to invite a relatively high degree of measurement error. Com-bined with the observation that the multifaceted nature of well-being means that in reality, it is unlikely to consist of one single internal state, this makes a strong case for using a range of different measures” (55-56).
As components of national well-being or profiles to be measured, Michaelson et al. (2009: 21-35) proposed: personal well-being (emotional wellbe-ing—positive feelings, emotional wellbeing—absence of negative feelings, satis-fying life, vitality, resilience & self-esteem, positive functioning) and social well-being (supportive relationships, trust and belonging).
Echoing Michaelson et al.’s (2009) view point, as a future research direction,
Forgeard et al. (2011) suggested a “dashboard [approach] of measures and indi-cators that can help us understand our strengths... Thus, [they] recommend that future measures of wellbeing present their results in a way that takes advantages of the variety of constructs that are measured” (97-98).
The difficulty with the “dashboard approach” of Michaelson et al. (2009) and
DOI: 10.4236/psych.2017.814148 2352 Psychology Moreover, it would be difficult for Michaelson et al. (2009) and Forgeard et al. (2011) to find, in the domain of psychology, a set of uncorrelated or independent components used as a basis for a multidimensional space of well-being. In other words, the dashboard approach does not provide a compelling measurement of well-being.
Furthermore, according to Michaelson et al. (2009), “satisfying life [is] show-ing a much larger range than other components. This seems to provide some justification for the way in which satisfaction-based indicators have often been treated as outcome measures in well-being research in that they seem both to summarize people’s overall sense of their personal well-being and to distinguish between those at different ends of the distribution” (29). Therefore, one must go “back to” life satisfaction as the bedrock of the measurement of well-being.
However, an analytical framework enabling the comparison of countries’ life satisfaction or happiness is still missing in literature. Oguz, Merad and Snape (2013) proposed a measurement of the UK’s national well-being. However, it was not designed to compare well-being among countries. Oishi (2010) also suggested in his conclusion the need of a new measurement tool for internation-al comparison of well-being. Furthermore, OECD (2013: p. 52) suggested that further research is needed to inform the best approach to international comparison.
To fill this gap, we determine a unit of measurement of countries’ life satisfaction which is the “umbrella” of satisfaction by using traditional technique of weighted average, which is also easier to implement. Thus, the determination of a unit of measurement by using an appropriate weight for each country will enable the comparison of countries’ life satisfaction and their level curve of life satisfaction over time. To our knowledge, this has not been attempted in previous research.
3. Comparing Countries’ Life Satisfaction
Here we use a survey questionnaire item to determine countries’ expressed life satisfaction and dissatisfaction (see Appendix A). Combined with the weighted average technique, this enables the determination of the unit of measurement of national life satisfaction and the comparison of countries’ life satisfaction. In the weighted average technique, the random variable, i.e. the subjective expressed life satisfaction, has a value in each country with a probability corresponding to an adjusted weight based on an objective value of each country’s suicide rate.11 Indeed, this technique, which determines the average value of a random variable, homogenizes the values of the random variable with their multiplication by their respective weights so that they can be added together on the numerator of the weighted average. That is, this technique, applied to the subjective expressed life satisfaction, homogenizes the countries’ cross-cultural differences because each 11The connection between external manifestations and internal states of mind was raised by
DOI: 10.4236/psych.2017.814148 2353 Psychology value of the subjective expressed life satisfaction is multiplied by its respective weight.
3.1. Determination of Countries’ Satisfaction
with a Survey Questionnaire Item
To determine countries’ expressed satisfaction, we use a four-point scale ques-tionnaire item and regroup the responses into two categories: “satisfied with life” and “dissatisfied with life”.12 Diener (1984) found that people reporting them-selves as very happy tend to be rated by those around them as being happy. Frey and Stutzer (2002a, 2002b) also reported that self-reported happiness is the best indicator of happiness. The standard questionnaire item is thus as follows:13
This questionnaire item will be used throughout a country. The number of respondents who are very satisfied or satisfied with life will be placed in the cat-egory “satisfied with life”, while those who are dissatisfied or very dissatisfied with life will be placed in the category “dissatisfied with life”.14 Thus, we will ob-tain the percentage of people expressing satisfaction and dissatisfaction with life in a country. Assume the following example:
[image:8.595.208.539.370.468.2]If researchers are concerned about the accuracy of self-reported happiness or
Table 1. Questionnaire item for life satisfaction.
Please tick one row
1 Very satisfied with life
2 Satisfied with life
3 Dissatisfied with life
4 Very dissatisfied with life
Table 2. Percentages of satisfied and dissatisfied people with life.
Categories Percentage
Number of people satisfied with life 60 = (SA)
Number of people dissatisfied with life 40 = (DSA)
Total 100 = (SA + DSA)
12To make the study clearer, the respondents are divided among two categories: “satisfied with life”
and “dissatisfied with life”. However, to ensure that respondents easily find a box that corresponds to their respective situations, we use a four-point scale questionnaire and regroup “satisfied with life” and “very satisfied with life” in one category, while “dissatisfied with life” and “very dissatisfied with life” are put in the other category even if one may perceive it as a loss of information. We also use “life satisfaction” in the text instead of “satisfaction with life” to make it pithier.
13If the study is based on “happiness” instead of “satisfaction with life”, “satisfied with life” and
“dissatisfied with life” should be replaced by “happy” and “unhappy” respectively in Table 1 and Table 2.
14The division in two categories is used because Veenhoven stated: “Though responses seldom
DOI: 10.4236/psych.2017.814148 2354 Psychology practice in survey questionnaires.15
3.2. Determination of Countries’ Unit of Measurement
of Satisfaction
Suppose we want to determine a unit of measurement of life satisfaction in n
countries (
1,2, ,
n
). One cannot use a simple average of the percentage of people satisfied with life in n countries because satisfaction is influenced by dif-ferent factors in each country.16 Therefore, the issue is to construct an average weighted satisfaction (AWSA) among countries that enables the comparison of the adjusted weighted satisfaction (JWSA) of each country to this AWSA, which will become a unit of measurement of satisfaction among countries. The construct must fulfil two criteria: the weight must be specific to each country and JWSA must counter countries’ cross-cultural differences of life satisfac-tion.17 To do so, we propose a proxy weight for dissatisfaction based on the sui-cide rate and the percentage of very dissatisfied people to determine the unit of measurement and a probability distribution of life satisfaction and dissatisfac-tion or correcdissatisfac-tion factors, which counter countries’ cross-cultural differences of life satisfaction and dissatisfaction.Within this context, the question is to find an appropriate weight for life sa-tisfaction and dissasa-tisfaction specific to each country. For instance, extreme life dissatisfaction may be a factor in taking one’s life.18 Since the suicide rate is
15The extensive explorations into the validity of measures of well-being conducted by Andrews and Withey (1976: p. 175-217) among others have
focused on what is usually referred to as “construct validity” or “internal validity”. A case is made here for an external validity check. For exam-ple, Campbell et al. (1976: p. 199-207) compared fluctuations in domain satisfaction in a limited number of cases in which external circumstances had significantly changed (between observations). A validation check may be used to establish the reliability of the findings given the limited number of cases. For further supports of the reliability and validity of subjective well-being measurement one can refer to Schimmack & Oishi (2005: p. 404), Diener, Inglehart & Tay (2012), and OECD (2013: p. 21).
16One could consider determining an index for life satisfaction which includes multiple factors affecting satisfaction in a country. This is not
necessary however, because as we have seen the expressed life satisfaction of respondents is a good indicator for life satisfaction in a country. The issue here is rather the determination of a unit of measurement which enables us to compare the expressed life satisfaction between countries.
17It should be noted that the construction of an index of measurement is not unusual in economics or social sciences. One could think for
in-stance of the Pareto index, Theil index or the Human Development index.
18Although causes of suicide may be complex (e.g. socio-economic factors, alcohol and other drug abuse, feelings of hopelessness, depression,
chemical imbalances within brain functions, psychological disorders, schizophrenia), suicide remains a planned rational decision or the result of an instinctive irrational decision. In either case, for a person who commits suicide, life is not worth living. In other words, he or she is dissatisfied with life at the point in time in which he or she ends his or her life. It also follows that people who are satisfied with life do not by and large com-mit suicide because for them, life is worth living. Several mechanisms might explain the association between life satisfaction and suicide. Within this context, stability of subjective well-being and life satisfaction has been previously reported (e.g. Koivumaa-Honkanen et al., 2001; Koivu-maa-Honkanen et al., 2000; Haight & Hendrix, 1998; Moscicki, 1995; Sorenson, 1991; Canetto, 1991; Headley, 1989; Fawcett et al., 1987; Inglehart & Rabier, 1986).
DOI: 10.4236/psych.2017.814148 2355 Psychology country specific,19 this suggests that a proxy weight for dissatisfied people who will commit suicide in any given year (RS) may be the country’s suicide rate. This idea has an empirical foundation in Finnish data. According to Helliwell, “in one large Finnish sample those with below-average life satisfaction were four times more likely than others of the same age to commit suicide over the fol-lowing ten years” (2004: p. 2). One may want to use other objective health out-comes such as anxiety, stress, high blood pressure and psychiatric conditions to rescale survey reports. However, the criterion which determines with certainty and objectivity whether a person is dissatisfied with life is suicide. This enables to anchor RS to those who said that they are dissatisfied with life and committed suicide.
However, one needs to find a proxy weight for dissatisfied people not com-mitting suicide that given year, because dissatisfied people comprise those who will commit suicide and those who will not. In some religions, suicide is forbid-den and families are ostracized when one of its members commits suicide. This may prevent some dissatisfied people who believe in these religions from com-mitting suicide. Again, in this case, people who defied the established rule to commit suicide must have experienced an extreme dissatisfaction with life with-in their cultural context. The rate of suicide with-in these cultural contexts will be commensurate with levels of dissatisfaction within these cultures. It should be pointed out that this will be the case for any objective criterion, because coun-tries have simply different cultural characteristics. This is why we are construct-ing an appropriate weight for both dissatisfaction and satisfaction for each country.20 Suppose that this proxy weight is P. Since P is a positive real number, one can always find another positive real number, C, so that P is equal to C, multiplied by RS, i.e. P C RS= ⋅ . However, the weight that dissatisfied people attach to suicide is generally greater than that attached to dissatisfaction because suicide may be the extreme outcome of life dissatisfaction. Otherwise, if dissatis-fied people did not attach more weight to suicide than dissatisfaction, majority of them would have committed suicide. This however is not the case. That is, as an extreme outcome, those who are very dissatisfied with life commit suicide. Moreover, the proxy weight for dissatisfied people committing suicide must be 19According to Eckersley and Dear (2002), correlations between suicide and other possibly relevant
cultural variables, such as tolerance of suicide, belief in God and national pride, are not significant. Although suicide and cultural variables may not be statistically significant in their work, as stated before they are related to one another. Moreover, the suicide rate is country dependent. See WHO (1989, 1990, 1991, 1994) and WHO (1999).
20One could also argue that instead of using suicide rate alone, one could add other objective health
DOI: 10.4236/psych.2017.814148 2356 Psychology greater than those not committing suicide. As a result, for P to be positive and smaller than RS, C must be positive and smaller than one. Therefore, a plausible candidate for C may be the positive correlation coefficient (ρ) between the per-centage of very dissatisfied people variable and the suicide rate variable, which is less than one since all dissatisfied people do not commit suicide.21 It follows that a proxy weight for dissatisfied people but not committing suicide that given year may be P= ⋅
ρ
RS, because ρ is related to dissatisfied people. The estimates of ρ will indicate whether ρ is positive, i.e. whether the empirical founda-tion of our idea of anchoring suicide rate to dissatisfied people is relevant.Thus, a proxy weight for dissatisfied people may be that for dissatisfied people who will commit suicide plus that of dissatisfied people who will not commit suicide in a given year, i.e. RS+ ⋅
ρ
RS RS=(
1+ρ
)
.22 One could think of(
1)
RS⋅ +
ρ
as the weight attached to dissatisfaction in a country and which iscountry specific.23 It should be noted that the determination of this weight does not concentrate on only the value of extreme dissatisfaction, but on the extreme and non-extreme dissatisfaction, i.e. on dissatisfaction.
(
1)
RS⋅ +
ρ
can be written as(
1)
( )
1 2(
RS) (
VDSA)
RS⋅ +ρ =RS⋅ ⋅V RS σ + VDSAσ , where V is the variance,
and RS σRS and VDSAσVDSA are the suicide rate variable and percentage of
very dissatisfied people variable divided by their standard deviations, respective-ly.24
Thus, our proxy weight for dissatisfied people in a given year can also be seen as the suicide rate that year multiplied by half the variance of the sum of the sui-cide rate variable and percentage of very dissatisfied people variable whose va-riances are equal to one (i.e. normalized), and whose covariance,
(
RS) (
, VDSA)
COV RS σ VDSAσ , reflects the specific relationship between
sui-cide rate and percentage of very dissatisfied people within a country.
21We do not mean that C is equal to ρ. We simply mean that C could be its proxy. It should be
noted that Bray and Gunnel (2006) found that correlations between suicide rate and life satisfaction could be negative. However, Bray and Gunnel (2006) used Spearman’s rank correlation, which is different from the linear correlation ρ we used in our study. ρ is positive because the suicide rate va-riable and the percentage of very dissatisfied people vava-riable move in the same direction. ρ can be seen as the slope of the regression line of the suicide rate and the percentage of very dissatisfied people variables, which are normalized.
22It should be noted here that the sum of the two weights is not equal to 1, because the weights are
not probabilities. Instead, one could think for instance of the weights attached to the numerical grades obtained in mathematics (weight x Grade = 2 times 70) and philosophy (weight x Grade = 5 times 95) by a high school student in the field of literature (or whose major is literature) in order to compute his or her weighted grade point average.
23It is quite exceptional that an annual suicide rate of a country be equal to zero. However, in the event
that this occurred, the weight attached to dissatisfaction RS
(
1+ρ)
becomes equal to zero. In this case, one needs a change in the referential of suicide rates (RSs) for each country from 0 to the average suicide rate ARS of the study period or to make a translation of coordinate ARS so that the new weight for dissatisfaction becomes[
ARS RS+](
1+ρ)
instead of[
0+RS](
1+ρ)
=RS(
1+ρ)
or[
RS ARS+]
(1+ρ) instead of[ ]
RS (1+ρ)=RS(1+ρ). For the rest of our study, we will consider(
1)
RS +ρ as the weight attached to dissatisfaction because suicide rates are all different from zero in our data.
DOI: 10.4236/psych.2017.814148 2357 Psychology Normalizing the weights for dissatisfaction and satisfaction so that their sum equals one, i.e. (RS
(
1+ρ)
+ proxy weight for satisfaction = 1), it follows that a proxy weight for satisfaction in a country in a given year is one minus the sui-cide rate (RS) that year multiplied by one plus the correlation coefficient, i.e.(
)
1−RS⋅ +1 ρ
. Similarly, one could think of 1−RS⋅ +
(
1 ρ)
25 as the weight attached to satisfaction in a country and is country specific. Thus, the weight at-tached to satisfaction in a country is derived from the weight atat-tached to dissa-tisfaction in the same country.Let us refer to the percentage of people satisfied with life in n countries as
1, 2, , n
SA SA SA and one minus the suicide rate (RS) multiplied by
(
1+ρ
)
inn countries as 1−RS⋅ +
(
1 ρ)
1,(
)
21−RS⋅ +1 ρ
, , 1−RS⋅ +
(
1 ρ)
n.Thus, the weighted satisfaction for country i is
{
1(
1)
}
ii
RS ρ SA
− ⋅ + ⋅
,
1,2, ,
i
=
n
. In other words, 1−RS⋅ +(
1 ρ)
i is the weight attached to SAi. While the average weighted satisfaction (AWSA) for n countries is(
)
{
}
{
(
)
}
1 1
1 1 1 1
n n
i
i i
i i
AWSA RS ρ SA RS ρ
= =
= − ⋅ + ⋅ − ⋅ +
∑
∑
(1)
26
AWSA will be our unit of measurement for life satisfaction.
Similarly, the weighted dissatisfaction for country i is
{
RS⋅ +(
1ρ
)
}
i⋅DSAi,1,2, ,
i
=
n
. While the average weighted dissatisfaction (AWDSA) for n coun-tries is(
)
{
}
{
(
)
}
1 1 1 1 n n i i i i iAWDSA RS ρ DSA RS ρ
= =
= ⋅ + ⋅ ⋅ +
∑
∑
(2)
27
Similarly, AWDSA will be our unit of measurement for life dissatisfaction. The adjusted weight,
{
(
)
}
{
(
)
}
1
1 1 i n 1 1 i
i
RS ρ RS ρ
=
− ⋅ + − ⋅ +
∑
, ofsatisfac-25Again, in the case where RS = 0, the weight attached to satisfaction should be
( ) ( )
{
1−ARS RS+ 1+ρ}
instead of{
1−RS(1+ρ)}
= − +{
1 0[ RS](1+ρ)}
. Again, for the rest of our study, we will consider{
1−RS(1+ρ)}
as the weight attached to satisfaction because suiciderates are all different from zero in our data.
26Again, there may be a different assessment of dissatisfaction and unhappiness or satisfaction and
happiness in a country. In this case, one will obtain two different values of the correlation coeffi-cient ρ: the value of the correlation coefficient between suicide rate and very life dissatisfaction and that of the correlation coefficient between suicide rate and very unhappiness. However, our technique of measuring life satisfaction or happiness will remain the same. That is, using life satis-faction or happiness does not undermine the generality of our analysis even though the two con-cepts are different.
27Notice that the correlation coefficient (ρ) between the percentage of very dissatisfied people and
suicide rate can be easily determined for a country i when one has several values of VDSAi and RSi
for country i. This should be done for all countries i=1,2,3, ,n, in order to determine AWSA and AWDSA. It should also be noted that the variable suicide is not replaced by dissatisfaction oth-erwise its weighted average would have been written as
1 1
n n
i i i
i i
RS RS SUICIDE
= =
⋅
∑
∑
, where RSiis the suicide rate for country i and SUICIDEi its suicide variable. In addition, in our analysis the
DOI: 10.4236/psych.2017.814148 2358 Psychology tion for country i (
i
=
1,2, ,
n
) enables the adjustment of life satisfaction for country i because the weight of life satisfaction, {
1−RS⋅ +(
1ρ
)
}
i, is a share ofthe sum of the specific weights for n countries,
{
(
)
}
1 1 1 n i i RS ρ = − ⋅ +
∑
. As are-sult, the weighted satisfaction for country i,
{
1−RS⋅ +(
1ρ
)
}
i⋅SAi, is adjustedby dividing it by the sum of the specific weights for n countries. Thus, the ad-justed weighted satisfaction for country i,
(
)
{
}
{
(
)
}
1
1 1 n 1 1
i i i i
i
JWSA RS ρ RS ρ SA
=
= − ⋅ + − ⋅ + ⋅
∑
,becomes a share of AWSA for n countries, because AWSA is the sum of
i
JWSA for n countries. Given that the random variable SA takes a value in each of the n countries, one could think of the coefficient of SAi in JWSAi,
(
)
{
}
{
(
)
}
1
1 1 i n 1 1 i
i
RS ρ RS ρ
=
− ⋅ + − ⋅ +
∑
, or correction factor of satisfaction asthe probability that the random variable SA takes the value SAi in country i.
It follows that the values of SAi (
i
=
1,2, ,
n
) are homogenized with theirmultiplication by their respective weights on the numerator of AWSA so that they can be added together. Thus, as adjusted weighted satisfaction, JWSAi
counters the cross-cultural differences of life satisfaction among n countries. Si-milarly, the adjusted weighted dissatisfaction for country i,
(
)
{
}
{
(
)
}
1
1 n 1
i i i i
i
JWDSA RS ρ RS ρ DSA
=
= ⋅ + ⋅ + ⋅
∑
,becomes a share of AWDSA for n countries, because AWDSA is the sum of the adjusted weighted dissatisfaction of n countries. Again, given that the ran-dom variable DSA takes a value in each of the n countries, one could think of the coefficient of DSAi in JWDSAi or correction factor of dissatisfaction as
the probability that the random variable DSA takes the value DSAi in
coun-try i. It also follows that the values of DSAi (
i
=
1,2, ,
n
) are homogenizedwith their multiplication by their respective weights on the numerator of AWDSA so that they can be added together. Thus, similarly, the adjusted weighted dissa-tisfaction counters the cross-cultural differences of life dissadissa-tisfaction among n countries.
3.3. Comparison of Countries’ Satisfaction
Having transformed qualitative variables (satisfaction and dissatisfaction) into quantitative variables (JWSAi and JWDSAi), we can now use the AWSA or
our unit of measurement to determine the number of units of satisfaction in each country. To do so, we simply divide the JWSAi of each country by AWSA.
Thus, we obtain:
(
)
{
}
{
(
)
}
( )
1
1 1 n 1 1 , 1,2, ,
i i i i
i
k RS ρ RS ρ SA AWSA i n
=
= − ⋅ + − ⋅ + ⋅ =
DOI: 10.4236/psych.2017.814148 2359 Psychology
, 1,2, ,
i i
k =JWSA AWSA i= n
where for any i, ki is a positive real number. i
k tells us how many units of AWSA are contained in country i’ s adjusted weighted satisfaction (JWSAi). Thus, ki is country i’s coordinate of adjusted
weighted satisfaction. This enables us to compare the satisfaction of n countries by simply comparing the values of ki for
i
=
1,2, ,
n
.Similarly,
(
)
{
}
{
(
)
}
(
)
1
1 n 1 , 1,2, ,
j j i j
i
k RS ρ RS ρ DSA AWDSA j n
=
= ⋅ + ⋅ + ⋅ =
∑
, 1,2, ,
j j
k =JWDSA AWDSA j= n
where for any j, kj is a positive real number.
Again, kj tells us how many units of AWDSA are contained in country j’s
adjusted weighted dissatisfaction (JWDSAj). Similarly, kj is country j’s
coor-dinate of adjusted weighted dissatisfaction. This also enables us to compare the dissatisfaction of n countries by simply comparing the values of kj for
1,2, ,
j= n.
It should be noted that if we have three categories: “satisfied with life”, “dissa-tisfied with life” and “none of the above”, instead of two categories: “sa“dissa-tisfied with life” and “dissatisfied with life”, one can still compare countries” satisfac-tion even though the sum of the percentage of people who are satisfied with life and that of people who are dissatisfied with life does not add up to 100 per cent because of the percentage of respondents who tick “none of the above”.
This means that the sum of SA and DSA will be in general different from 100 per cent in each survey. The coefficient of adjustment
β
of the percentage of people who are satisfied and dissatisfied with life should be determined as(
SA DSA)
SA DSA 100%β
+ = ⋅β
+ ⋅β
= orβ
=(
100%) (
SA DSA+)
.Thus, the adjusted percentage of people who are satisfied with life and that of people who are dissatisfied with life are respectively:
( )
[
]
100%
JSA= ⋅β SA= SA SA DSA+ and
(
)
[
]
100%
JDSA= ⋅β SDA= DSA SA DSA+ .
In this way, the same referential percentage of 100 per cent is maintained; otherwise JSA and JDSA will not add up to 100 per cent and JDSA cannot be determined knowing JSA and vice versa.28 Again, when we have three cat-egories instead of two, the average adjusted weighted percentage of people who are satisfied and dissatisfied with life will be the respective unit of measurement of satisfaction and dissatisfaction of n countries. However, for consistency, we propose to use either three or two categories for each country. Given these two alternatives, our suggestion is to use the design of the two categories in Table 1
28To see that, suppose we choose β so that (βSA + βDSA) is different from 100%. In this case, (JSA +
DOI: 10.4236/psych.2017.814148 2360 Psychology because it is a clear expression of satisfaction-dissatisfaction.
To illustrate our technique, we use four countries as cases, the Netherlands, the United Kingdom (UK), Belgium and France, and employ their data on life satisfaction in Eurobarometer Surveys series (1986-1995) and their data on sui-cide rates in World Health StatisticsAnnual (1990-1996), which contain the data for the period 1986-1995.
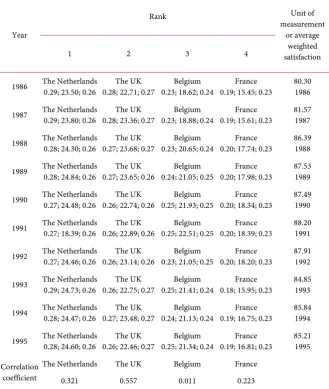
[image:15.595.208.538.248.638.2]From 1986 to 1995, the ranking of the four countries’ coordinate of life satis-faction is depicted in Table 3 as well as their adjusted weighted life satisfaction,
Table 3. Estimates of the coordinates and their ranking by year; Adjusted weighted life satisfaction; Adjusted weights; Units of measurement of life satisfaction and Correlation coefficients.
Year
Rank Unit of
measurement or average
weighted satisfaction
1 2 3 4
1986 The Netherlands 0.29; 23.50; 0.26 0.28; 22.71; 0.27 The UK 0.23; 18.62; 0.24 Belgium 0.19; 15.45; 0.23 France 80.30 1986
1987 The Netherlands 0.29; 23.80; 0.26 0.28; 23.36; 0.27 The UK 0.23; 18.88; 0.24 Belgium 0.19; 15.61; 0.23 France 81.57 1987
1988 The Netherlands 0.28; 24.30; 0.26 0.27; 23.68; 0.27 The UK 0.23; 20.65; 0.24 Belgium 0.20; 17.74; 0.23 France 86.39 1988
1989 The Netherlands 0.28; 24.84; 0.26 0.27; 23.65; 0.26 The UK 0.24; 21.05; 0.25 Belgium 0.20; 17.98; 0.23 France 87.53 1989
1990 The Netherlands 0.27; 24.48; 0.26 0.26; 22.74; 0.26 The UK 0.25; 21.93; 0.25 Belgium 0.20; 18.34; 0.23 France 87.49 1990
1991 The Netherlands 0.27; 18.39; 0.26 0.26; 22.89; 0.26 The UK 0.25; 22.51; 0.25 Belgium 0.20; 18.39; 0.23 France 88.20 1991
1992 The Netherlands 0.27; 24.46; 0.26 0.26; 23.14; 0.26 The UK 0.23; 21.05; 0.25 Belgium 0.20; 18.20; 0.23 France 87.91 1992
1993 The Netherlands 0.29; 24.73; 0.26 0.26; 22.75; 0.27 The UK 0.25; 21.41; 0.24 Belgium 0.18; 15.95; 0.23 France 84.85 1993
1994 The Netherlands 0.28; 24.47; 0.26 0.27; 23.48; 0.27 The UK 0.24; 21.13; 0.24 Belgium 0.19; 16.75; 0.23 France 85.84 1994
1995 The Netherlands 0.28; 24.60; 0.26 0.26; 22.46; 0.27 The UK 0.25; 21.34; 0.24 Belgium 0.19; 16.81; 0.23 France 85.21 1995
Correlation coefficient
The Netherlands The UK Belgium France
0.321 0.557 0.011 0.223
Source of data on suicide rate: World Health Statistics Annual (1990, 1991, 1992, 1993, 1994, 1996); Source of data on life satisfaction: Public Opinion Analysis (1986-1995), Eurobarometer Surveys series (1986 to 1995). The first numbers below the countries are their coordinate of life satisfaction or number of units of life satisfaction or values of ki, which is obtained by dividing the second number (i.e. the adjusted weighted
life satisfaction) by the corresponding units of measurement or average weighted satisfaction in the last column. The third numbers below the countries are the adjusted weights or the values of the coefficient of expressed life satisfaction in JWSAi. The second numbers below the countries (i.e. adjusted weighted life
DOI: 10.4236/psych.2017.814148 2361 Psychology adjusted weights, unit of measurement of life satisfaction and correlation coeffi-cients between the suicide rate variable and very dissatisfied people variable. Our technique is limited to four European countries because their data on suicide rates, and life satisfaction and dissatisfaction from 1986 to 1995 were complete. We used a limited set of countries because were unable to get an additional complete set of data. To avoid a lengthy paper, from the illustration, we excluded the table on the ranking of the countries’ coordinate of life dissatisfaction as well as other tables related to life dissatisfaction.
The first numbers below the countries are their coordinates of life satisfaction, or number of units of life satisfaction or values of ki; the second set of numbers
are countries’ adjusted weighted life satisfaction or values of JWSAi; and the
third set of numbers are the adjusted weights or values of the coefficient of ex-pressed life satisfaction in JWSAi.
be-DOI: 10.4236/psych.2017.814148 2362 Psychology cause 93 should be above 92 (Luxembourg ranks second instead of the Nether-lands), or Luxembourg’s ranking is correct, and then the value 93 is incorrect because 93 cannot be below 89. The same logic holds for Northern Ireland and Ireland whose percentage of people “satisfied or very satisfied with life as a whole” is 89 and 84, respectively.
The last column in Table 3 corresponds to the values of the unit of measure-ment by year, which fluctuate around their mean, 85.52, within the range of (80.3, 88.20). Thus, our technique represents an improvement as compared with Inglehart and Rabier’s technique, and an improvement in general as compared with the techniques in which the mean score is used for comparisons. As indi-cated earlier, the task at hand is to construct a weighted life satisfaction which enables the comparison of countries’ life satisfaction.
The last line of the table represents the correlation coefficients which are posi-tive, confirming that the empirical foundation of our idea of anchoring suicide rate to dissatisfied people is relevant.
Now, let us turn to the comparison of countries’ level curve of life satisfaction over time.
4. Comparing Countries’ Level Curve of Life Satisfaction
over Time
In his pioneering work, Easterlin found that national comparisons among coun-tries over time reveal an association between income and happiness, which is weaker than, if not inconsistent with, that shown by comparisons within coun-tries. As an explanation, he suggested a Duesenberry-type model, involving rela-tive status considerations as an important determinant of happiness (1974: p. 111-112, 118). Diener et al. (1995) computed a regression analysis across 38 na-tions in which life satisfaction and happiness were each separately predicted from income. This enabled them to compute the residual values from the pre-dicted equation and to compare both the happiness and life satisfaction levels of countries. However, this comparison rested on one variable, the “substantial predictor in the sample,” which is income (12). Blanchflower and Oswald (1999)
compared happiness for the U.S. from 1972 to 1998 and life satisfaction for Great Britain from 1973 to 1998. Their study provides some support for Easter-lin’s pioneering work even though the picture is not simple. For instance, their results indicate that some groups in society such as American men and Blacks have become happier through the decades (19).
In this section, we propose another technique based on the weighted average. The reason is as follows. In Table 6 (1960) and Table 7 (1965), Easterlin (1974)
DOI: 10.4236/psych.2017.814148 2363 Psychology happiness over time. To compare countries’ level of life satisfaction over time, we first determine their weighted level curve of satisfaction over time. Second, we determine their adjusted weighted level curve of satisfaction over time. Then we compare countries’ adjusted weighted level curve of life satisfaction over time.
4.1. Determination of a Country’s Level Curve
of Satisfaction over Time
Here, we use the fact that an increase (decrease) in life satisfaction in a country results in a decrease (increase) in life dissatisfaction to construct a level curve of satisfaction over time for each country.
From Table 2, one can see that if the percentage of people who are satisfied with life (SA) increases, then the percentage of people who are dissatisfied with life (DSA) decreases because the sum of the two percentages must be 100 per cent. However, the coefficient of SA in JWSA is smaller than one because its numerator is contained in its denominator, which is the sum of weights attached to SA in each of the n countries. The same logic holds for the coefficient of
DSA in the adjusted weighted dissatisfaction (JWDSA).
As a result, JWSA is smaller than SA and JWDSA is smaller than DSA. It follows that JWSA JWDSA+ is below 100 per cent.
Moreover, there is no reason for the sum of JWSA and JWDSA to be constant as SA DSA+ , which is equal to 100 per cent. This suggests that the weighted level curve of satisfaction over time of a country, in which Y JWSA= and X JWDSA= , cannot be a decreasing straight line as SA DSA+ =100 per cent since
(
JWSA JWDSA+)
≠constant. However, it may have the shape of theright branch of a hyperbola. Formally,
( )
, 0, 0Y A X= α A> α> (3)
where Y represents JWSA, X represents JWDSA, and A and α (posi-tive real numbers) are constants.
Taking the logarithm of both sides in Equation (3), we obtain
( )
( )
( )
log Y =log A − ⋅
α
log X (4)To determine the value of constant A and that of elasticity α, one needs to collect data on the percentage of satisfied and dissatisfied people in a country from several surveys to compute Y JWSA= and X JWDSA= for each survey and run an ordinary least-squares (OLS) regression of Equation (4). This will result in an estimated equation:
( )
( )
log Y =a bj− ⋅j log X j, =1,2, , n (5)
The sign and level of significance of the estimated coefficients will tell us whether our weighted level curves of satisfaction over time have the shape of the right branch of a hyperbola. The estimate “aj” of country j will enable us to
DOI: 10.4236/psych.2017.814148 2364 Psychology Figure 1. Weighted level curve of satisfaction over time in a country.
the value of α because the estimate “bj” equals α, i.e. α=bj. This means
that Equation (3) becomes
( )
bj , 0, 0, 1,2, ,j j j j
Y A= X =WL A > b > j= n (6) If the adjusted weighted percentage of people satisfied with life (Y) is on the vertical axis and that of people dissatisfied with life (X) is on the horizontal axis, we obtain the weighted level curve of satisfaction over time (WLj). The graph of
Equation (6) is as follows in Figure 1.
This curve tells us that as the adjusted weighted level of dissatisfaction of a country (X) increases, its adjusted weighted level of satisfaction (Y) decreases like the right branch of a hyperbola as on an indifference curve.
4.2. Determination of an Average Level Curve of Satisfaction
over Time
The weighted level curve of satisfaction for each country will enable us to deter-mine the average weighted level curve of satisfaction for all countries.
From Equations ((1) and (2)), we know AWSA and AWDSA for n coun-tries. Again, having calculated AWSA and AWDSA from several surveys, we can run an OLS regression of Equation (4), in which Y AWSA= and
X AWDSA= .
Similarly, the estimates “aj” and “bj” in Equation (5) enable us to determine
the values A and
b
or A and α, respectively. Formally, the functional form of the average weighted level curve of satisfaction over time (AWL) is( )
b , 0, 0Y A X= = AWL A> b>
(7) where A is the estimated value of constant
b
andb
that of α.4.3. Comparison of Countries’ Level Curve
of Satisfaction over Time
DOI: 10.4236/psych.2017.814148 2365 Psychology which will be the level number of satisfaction for the country with respect to the unit of measurement over the study period.
The derivations of the unit of measurement of the level curves of satisfaction (JY =1
[ ]
X b, (9)), countries’ adjusted weighted level curves of satisfaction(
[ ]
bj j j
Jl =A D A⋅ X , j=1,2, , n , (10)) and their level numbers (Kj = A D Aj⋅ j ,j=1,2, , n, (12)) are presented in Appendix B.
To compare countries’ adjusted weighted level of satisfaction over time, we simply need to compare the values of
j j j j j j
K =Jl JY =A D A JY JY A D A⋅ ⋅ = ⋅ , j=1,2, , n (12), (B.5)
Suppose Jl1=
( ) ( )
1 2 X 1 2 ,( ) ( )
1 22 2
Jl = X and JY=1
( )
X 1 2 are the adjusted weighted level curves of satisfaction over time of countries 1 and 2 and the average adjusted weighted level curve of satisfaction over time, respectively. We have( )
( )
1 1 2 and 2 2
Jl = ⋅JY Jl = ⋅JY
If we represent the graphs of the two countries’ adjusted weighted level curve of satisfaction as well as that of the average adjusted weighted level curve over time, we obtain Figure 2.
In this example, K1 =
(
A D A1⋅ 1)
=1 2 and K2 =(
A D2⋅ 2)
A=2. If wedi-vide K2 by K1, we obtain
( )
2 1 2 1 2 4
K K = = or K2 = ⋅4 K1
One can see that country 2’s adjusted weighted level curve of satisfaction over time is four times higher than that of country 1.
To determine countries’ adjusted weighted level curve of dissatisfaction over time, one needs to take Y and X as the dissatisfaction and satisfaction variables, respectively, and then follow the procedure we outlined in the determination of countries’ level curve of satisfaction over time.
It should be noted that if we had a five-point instead of a four-point scale questionnaire item in Table 1, “very satisfied”, “satisfied”, “dissatisfied”, “very dissatisfied” with life and “none of the above”, we would have three categories, “satisfied with life”, “dissatisfied with life” and “none of the above”, instead of
DOI: 10.4236/psych.2017.814148 2366 Psychology two categories, “satisfied with life” and “dissatisfied with life.”
In this case, each country’s weighted level curve of satisfaction and the average weighted level curve of satisfaction over time for n countries will be determined as before.
Similarly, lj (the ratio of country j’s weighted level curve to the average
weighted level curve of satisfaction) will be determined as before. This will ena-ble us to determine the adjusted weighted level curves of satisfaction over time for n countries and compare them as before.
Again, for consistency, we propose using either three or two categories for each country. Given these two alternatives, our suggestion again is to design the questionnaire item according to the format in Table 1 because it represents a clear expression of satisfaction-dissatisfaction.
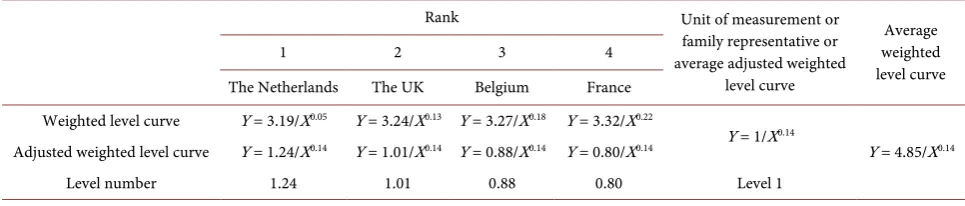
To illustrate our technique again, we can now turn to our estimates of OLS regressions, and the four countries’ level curves of life satisfaction over time as well as their level numbers and unit of measurement of life satisfaction over time, which are depicted in Table 4 and Table 5, respectively.
[image:21.595.57.539.458.556.2]All the coefficients have the negative sign and are statistically significant at the 5 per cent level, indicating that the weighted level curves of satisfaction over time have the shape of the right branch of a hyperbola. These results enable us to de-termine the weighted level curves of life satisfaction, adjusted weighted level curves, level numbers, average weighted level curve and average adjusted weighted level curve, or unit of measurement of life satisfaction over time, which are in Table 5. To our knowledge, this is the first attempt to determine such a
Table 4. Estimation of the log linear OLS regression of the average weighted level curve and weighted level curves of the four countries over the period 1986-1995.
Weighted satisfaction Constant Weighted dissatisfaction Adjusted R2
Average weighted satisfaction 4.85 −0.14* (4.44) 0.67
France 3.32 −0.22* (2.72) 0.41
Belgium 3.27 −0.18* (24.56) 0.98
The UK 3.24 −0.13* (13.40) 0.95
The Netherlands 3.19 −0.05* (2.24) 0.30
(*) means statistically significant at the 5% level. N.B.: The terms in parentheses are the t-statistics; there are 10 observations and each regression equation has 8 degrees of freedom; the aim of the econometric regressions is to determine the respective values of α over the period 1986-1995.
Table 5. Estimates of weighted level curves of life satisfaction, adjusted weighted level curves, level numbers, average weighted level curve and unit of measurement over the period 1986-1995.
Rank Unit of measurement or
family representative or average adjusted weighted
level curve
Average weighted level curve
1 2 3 4
The Netherlands The UK Belgium France Weighted level curve Y = 3.19/X0.05 Y = 3.24/X0.13 Y = 3.27/X0.18 Y = 3.32/X0.22
Y = 1/X0.14
Y = 4.85/X0.14
Adjusted weighted level curve Y = 1.24/X0.14 Y = 1.01/X0.14 Y = 0.88/X0.14 Y = 0.80/X0.14
[image:21.595.55.538.623.726.2]DOI: 10.4236/psych.2017.814148 2367 Psychology level curve of life satisfaction over time in literature.
Over the period 1986-1995, the Netherlands has the highest level number of satisfaction. It is followed by the UK, Belgium and France. In addition, the ranking of the level numbers corresponds to that of the four countries’ coordi-nate by year and over the same period in Table 3. Again, by dividing the Neth-erlands’ level number by that of each of other countries, our estimates show that the Netherlands’ life satisfaction over time is 1.22, 1.40 and 1.55 times higher than that of the UK, Belgium and France, respectively, over the period 1986-1995.
5. Discussion and Conclusion
In this paper, we provide an analytical framework that enables us to determine a unit of measurement of life satisfaction and dissatisfaction for several countries and a unit of measurement for their level curves of life satisfaction. These in turn allow us to compare countries’ life satisfaction as well as their level curve of life satisfaction over time. As an illustration of our technique, we use four countries as case study. These include: the Netherlands, the UK, Belgium and France. Our estimates show that the Netherlands has the highest ranking of life satisfaction by year as well as that of the level curve of life satisfaction over the period 1986-1995. The Netherlands is followed by the UK, Belgium and France. That is, the ranking of life satisfaction has remained the same for the four countries by year as well as over the period 1986-1995.
The underlining factors to these rankings of expressed life satisfaction and level curves of life satisfaction may be due to differences in outlook in life. In-deed, given that material living conditions, social relationship and health status are clearly related to life satisfaction in most countries in general and in the four European countries in particular, namely, the Netherlands, the UK, Belgium and France (Eurostat, 2015), these countries should be similar in terms of life satis-faction. This however is not the case in our study, because the two Northern countries, the Netherlands and the UK rank ahead of the two relatively Southern countries, Belgium and France. The same ranking is observed in the map of In-glehart, Foa et al. (2008). Then, one may probably look at countries’ outlook to have a better understanding of the ranking of these relatively Southern and Northern countries.
France ranks last probably because of its negative outlook. Senik (2014)
coined the low level of happiness in France, observed in international surveys, as “The French unhappiness puzzle”. According to her, “this points to school and childhood environment as a valuable locus of public policy.” This is reiterated in her conclusion. One of the consequences of this social set-up coined by Senik is called “the French happiness deficit”.
DOI: 10.4236/psych.2017.814148 2368 Psychology case of the Netherlands by the construction of the polders, which extends on the sea the living space of the country. In the case of the UK, the positive outlook is exemplified by its conquest of the sea that enables it to create a huge empire.
The Netherlands ranks before the UK, probably because it is a more homo-genous society c