ORIGINAL RESEARCH
Diagnostic Accuracy of Dynamic
Contrast-Enhanced MR Imaging Using a Phase-Derived
Vascular Input Function in the Preoperative
Grading of Gliomas
T.B. Nguyen G.O. Cron J.F. Mercier C. Foottit C.H. Torres S. Chakraborty J. Woulfe G.H. Jansen J.M. Caudrelier J. Sinclair M.J. Hogan R.E. Thornhill I.G. Cameron
BACKGROUND AND PURPOSE: The accuracy of tumor plasma volume andKtransestimates obtained with DCE MR imaging may have inaccuracies introduced by a poor estimation of the VIF. In this study, we evaluated the diagnostic accuracy of a novel technique by using a phase-derived VIF and “book-end” T1 measurements in the preoperative grading of patients with suspected gliomas.
MATERIALS AND METHODS: This prospective study included 46 patients with a new pathologically confirmed diagnosis of glioma. Both magnitude and phase images were acquired during DCE MR imaging for estimates ofKtrans_ and V
p_ (calculated from a phase-derived VIF and bookend T1 measurements) as well asKtrans_SI and V
p_SI (calculated from a magnitude-derived VIF without T1 measurements).
RESULTS: MedianKtrans_values were 0.0041 minutes⫺1(95% CI, 0.00062– 0.033), 0.031 minutes⫺1 (0.011– 0.150), and 0.088 minutes⫺1(0.069 – 0.110) for grade II, III, and IV gliomas, respectively (Pⱕ .05 for each). Median Vp_values were 0.64 mL/100 g (0.06 –1.40), 0.98 mL/100 g (0.34 –2.20), and 2.16 mL/100 g (1.8 –3.1) withP⫽.15 between grade II and III gliomas andP⫽.015 between grade III and IV gliomas. In differentiating low-grade from high-grade gliomas, AUCs for Ktrans_, V
p_, Ktrans_SI, and V
p_SI were 0.87 (0.73–1), 0.84 (0.69 – 0.98), 0.81 (0.59 –1), and 0.84 (0.66 – 0.91). The differences between the AUCs were not statistically significant.
CONCLUSIONS:Ktrans_ and V
p_ are parameters that can help in differentiating low-grade from high-grade gliomas.
ABBREVIATIONS:AUC ⫽area under the receiver operating characteristic curve; CT(t)⫽ tissue contrast concentration curve with time; CI⫽confidence interval; CV⫽coefficient of variation; DCE⫽dynamic contrast-enhanced;Ktrans_⫽volume transfer coefficient obtained from phase-derived vascular input function;Ktrans_SI⫽volume transfer coefficient obtained from magnitude-derived vascular input function; NPV⫽negative predictive value; PPV⫽positive predictive value; R1⫽rate of longitudinal relaxation; R2*⫽observed rate of transverse relaxation; ROC⫽receiver operating characteristic analysis; T1⫽longitudinal relaxation time; Vp_SI⫽plasma volume obtained from magnitude-derived vascular input function; VIF⫽vascular input function; Vp_ ⫽plasma volume obtained from phase-derived vascular input function
C
ontrast-enhanced anatomic MR imaging is not always accu-rate in differentiating high-grade gliomas from low-grade gliomas.1The presence of contrast enhancement is more com-mon in higher grade gliomas but is not infrequently found in low-grade tumors. Physiologic imaging such as perfusion MR imaging has been used recently to evaluate angiogenesis, which is important for both the growth and metastasis of malignant tu-mors.2The 2 most common MR perfusion techniques used in clinical practice are dynamic susceptibility-weightedcontrast-en-hanced imaging and DCE imaging.3Following an intravenous injection of a Gd-based contrast agent, dynamic susceptibility-weighted contrast-enhanced imaging measures the change in R2* during the first pass of the bolus, while DCE imaging measures the changes in R1during both the first pass and washout phases. While DCE perfusion might be more accurate than dynamic sus-ceptibility-weighted contrast-enhanced in the measurement of pa-rameters such as cerebral blood volume and permeability index, DCE usually requires more complex data acquisition and analysis. First, determination of T1 values in brain tissue before contrast injec-tion is now usually done for calculainjec-tion of CT(t) from changes in R1 following bolus injection.4Additional measurements of T1 values following contrast injection, “bookend” measurements, have also been performed to improve the accuracy of DCE parameters.5 Sec-ond, an accurate VIF is needed but is difficult to obtain because the relationship between MR signal intensity and absolute contrast concentration is not always linear and might be compromised by inflow.6,7Recently, several authors have proposed the use of phase information to derive the VIF.8,9It is known that if a vessel is ap-proximately parallel to the magnetic field, changes in gadolinium-based contrast agent concentration vary linearly with phase
Received September 1, 2011; accepted after revision November 11.
From the Departments of Radiology (T.B.N., G.O.C., J.F.M., C.H.T., R.E.T., I.G.C., S.C., J.M.C.); Medical Physics (C.F., I.G.C.); Pathology (G.H.J., J.W.); Surgery, Division of Neurosurgery (J.S.); and Medicine, Division of Neurology (M.J.H.); The Ottawa Hospital, University of Ottawa, Ottawa, Ontario, Canada.
Abstract previously presented at: 49th Annual Meeting of the American Society of Neuroradiology, June 4 –9, 2011; Seattle, Washington; and 19th Annual Meeting of the International Society for Magnetic Resonance in Medicine, May 6 –13, 2011; Montreal, Quebec, Canada.
This work was funded by the Brain Tumour Foundation of Canada.
Please address correspondence to Thanh Binh Nguyen, MD, Medical Imaging, The Ottawa Hospital, 1053 Carling Ave, Ottawa, Ontario, K1Y 4E9; e-mail [email protected] http://dx.doi.org/10.3174/ajnr.A3012
BRAIN
ORIGINAL
changes.10Because phase images can be acquired at the same time as magnitude images, no additional imaging is required.
In this study, we evaluated the diagnostic accuracy of DCE MR imaging parameters by using phase-derived VIF and bookend T1 measurements in the preoperative grading of patients with sus-pected gliomas. We compared this technique with a simpler pharmacokinetic analysis by using magnitude-derived VIF with-out T1 mapping.
Materials and Methods
Subjects
All examinations were conducted in accordance with the guidelines of our institution for human research, and written informed consent was obtained from all participating subjects. All adult patients presenting at the Ottawa Hospital with a newly diagnosed brain lesion compatible with a glioma be-tween December 2008 and March 2010 were included in this prospective study. We set the following exclusion criteria: pregnancy, renal failure, and a known history of allergy to gadolinium-based MR imaging contrast agent. Following the MR imaging examination, patients underwent surgery with biopsy or surgical resection of the lesion. The average time interval between the MR imaging examination and surgery was 12.5 days. Histopathologic diagnosiswasprovidedbyanexperiencedneuropathologist(J.W.,12yearsof experience, or G.H.J., 23 years of experience) by using the World Health Organization classification.
MR Imaging Acquisition
All MR imaging data were acquired by using either a 1.5T (Symphony; Siemens, Erlangen, Germany) or a 3T clinical scanner (Trio, Siemens).
Anatomic imaging was performed by using standard sagittal T1-weighted and axial T1-weighted pre- and post-DCE contrast in-jection; and axial FLAIR, axial T2, and coronal T1 post-DCE contrast injection.
At 1.5T, DCE MR imaging was performed by using a 2D fast low-angle shot pulse sequence (5 axial sections, TR⫽45 ms, TE⫽ 2.1, 5.5 ms, flip angle⫽90°, matrix⫽96⫻128, FOV⫽17⫻23 cm2,
section thickness⫽5 mm,⌬t⫽2.2 seconds). 2D fast low-angle shot was used for dynamic imaging on the 1.5T scanner because of hard-ware limitations. The desired temporal resolution (⌬t⬍3 seconds) was only achievable with the 2D sequences. At 3T, a 3D fast low-angle shot sequence was used (18 axial sections, TR⫽6.5 ms, TE⫽1.7, 3.9 ms, flip angle⫽30°, matrix⫽96⫻128, FOV⫽23 cm2, section
thickness⫽5 mm,⌬t⫽2.9 seconds). The 2D and 3D fast low-angle shot sequences generated phase images in addition to the standard magnitude images. Both before and after the DCE MR imaging, a series of gradient-echo images was acquired, which enabled the cal-culation of T1 maps. 3D fast low-angle shot images (TR⫽50 ms, TE⫽2.2 ms, flip angle⫽10°, 20°, 40°, 70°) were obtained at 1.5T, and 3D volumetric interpolated breathhold examination images (TR⫽20 ms, TE⫽1.2 ms, flip angle⫽4°, 25°) were used at 3T. 3D sequences were used on both scanners for T1 mapping, to minimize section profile effects. For T1 mapping on the 3T scanner, volumetric inter-polated breathhold examination was used instead of fast low-angle shot, though the contrast mechanisms of these 2 sequences are very similar (T1-weighted spoiled gradient-echo). A shorter TR and fewer flip angles were used for T1 mapping at 3T to reduce scanning time.
Fig 1.A,Phase-derived VIF and tumor CT(t) from a patient with confirmed grade IV glioma obtained at 3T.BandC, Ktrans_(B) and Vp_(C) maps.D, Magnitude-derived VIF and tumor signal-intensity changes from the same patient for comparison.EandF,Ktrans
_SI (E) and Vp_SI (F) maps. MaximalK trans
_and Vp_values in tumor are 0.099 minutes⫺1and 5.7 mL/100 g compared with 0.15 minutes⫺1and 18 mL/100 g forKtrans_SI and V
[image:2.594.57.533.47.365.2]This was possible due to the additional signal intensity–to-noise ratio available on that machine.
Gadopentetate dimeglumine (Magnevist; Bayer Schering, Berlin, Germany) was injected at 0.1 mmol/kg and 4 mL/s, beginning 40 seconds after the start of the scan. The duration of the DCE sequence was 220 seconds.
Pharmacokinetic Modeling
Phase-Derived VIF with Bookend T1 Correction.Voxel wise maps of CT(t) were calculated in 2 steps. First, the double echo was
used to extrapolate all magnitude signals to TE⫽0 ms, thereby re-ducing T2* effects. Second, the pre- and post-DCE T1 maps were combined with the extrapolated tissue signal-intensity-versus-time curve by using standard signal-intensity equations to compute CT(t).
The VIF was calculated from the superior sagittal sinus by measuring the change in phase as a function of time, taking into account the angle of each vessel segment relative to the main magnetic field. This step was performed off-line by using in-house software written in IDL (ITT Visual Information Solutions, Boulder, Colorado) and is de-scribed in a previous article.8Voxel-by-voxel estimates of V
p_and Ktrans_were determined by using a kinetic model analysis from the
nordicICE software (Version 2; NordicNeuroLab, Bergen, Norway) as described in the Appendix. Representative parametric maps of Vp_andKtrans_are shown in Fig 1B, -C.
Magnitude-Derived VIF with No T1 Correction.DCE magni-tude images were processed directly in Nordic ICE to generate maps of Vp_SI andKtrans_SI as described in the Appendix (Fig 1D, -E).
Image Interpretation
Two neuroradiologists, blinded to the pathologic diagnosis (C.H.T. and S.C., with 3 and 5 years of experience, respectively) interpreted the struc-tural images. Based on standard radiologic criteria of contrast enhance-ment, central necrosis, and vasogenic edema, each radiologist graded the glioma from 1 to 4. A senior radiology resident (J.F.M., third- year radi-ology resident) traced 4 ROIs of 25 mm2in the solid part of the tumor.
The maximum value of the 4 mean values from the ROIs was obtained forKtransand Vpfor each pharmacokinetic approach. All ROIs were
verified by a neuroradiologist (T.B.N., 10 years of experience) to ensure that inadvertent placement on an adjacent vessel was avoided.
Statistical Analysis
All data were analyzed by using MedCalc for Windows, Version 11.5 (MedCalc Software, Mariakerke, Belgium). There were 6 components to the statistical analysis: 1) calculation of sensitivity and specificity for each reader by using anatomic MR imaging to grade gliomas, 2) assessment of inter-reader reliability by using thestatistic. 3) tests for difference in maximum VpandKtransvalues according to grade by
using the Mann-WhitneyUtest, 4) tests for difference in maximum VpandKtransvalues according to the MR imaging acquisition method
(2D-versus-3D fast low-angle shot) by using the Mann-WhitneyU
test, 5) ROC analysis for VpandKtransin grading gliomas by using
each method, and 6) Bland-Altman analysis of within-subject repro-ducibility of VpandKtransvalues by using both methods and testing
for difference between values by using a paired Wilcoxon test.
Results
Participants
During the study period, a total of 60 patients presented with a newly diagnosed brain lesion and had DCE MR imaging. Six patients did not have any surgery, 6 patients had a pathologic diagnosis other than glioma following surgery (1 normal brain tissue, 4 metastasis, 1 supratentorial ependymoma grade III), and 2 patients had missing data from MR perfusion imaging. Forty-six patients with a newly pathologically proved diagno-sis of glioma were included in the analydiagno-sis (9 grade II, 9 grade III, 28 grade IV) with 42 astrocytomas, 3 oligoastrocytomas, and 1 oligodendroglioma.
Accuracy of Conventional Imaging for Distinguishing Low-Grade from High-Grade Gliomas
In distinguishing low-grade (grade II) from high-grade glio-mas (grades III and IV), reader 1 had a sensitivity of 97% and a specificity of 67% (PPV⫽92%, NPV⫽86%), while reader 2 achieved a sensitivity of 95% and a specificity of 67% (PPV⫽ 92%, NPV⫽75%). There was substantial agreement between the 2 readers (⫽0.76, 95% CI, 0.50 –1.0).
Vpand KtransValues According to Glioma Grades
The medianKtransand V
[image:3.594.51.534.70.148.2]pvalues for each glioma grade and for each MR imaging scanner are summarized in Tables 1–3 and Table 1: Median values of the maximal perfusion parameters and coefficient of variation for different grades of gliomas using a 2D gradient-recalled echo sequence on a 1.5T MR imaging scanner
No.
Ktrans_
(min⫺1) (95% CI)
CV (%)
Ktrans_SI
(min⫺1) (95% CI)
CV (%)
Vp_
(mL/100 g) (95% CI)
CV (%)
Vp_SI
(ml/100 g) (95% CI)
CV (%) Grade 2 8 0.0086 (0.0010–0.047) 153 0.0032 (0.00056–0.17) 210 0.66 (0.091–1.55) 91 1.35 (0.22–6.9) 143
Grade 3 4 0.020 142 0.0052 191 1.37 105 2.8 114
Not defined Not defined Not defined Not defined
Grade 4 19 0.10 (0.072–0.13) 46 0.13 (0.073–0.23) 85 2.0 (1.7–3.1) 78 8.8 (5.3–14) 76
Table 2: Median values of the maximal perfusion parameters and coefficient of variation for different grades of gliomas using a 3D gradient-recalled echo sequence on a 3T MR scanner
No.
Ktrans_
(min⫺1) (95% CI)
CV (%)
Ktrans_SI
(min⫺1)
(95% CI)
CV (%)
Vp_
(mL/100 g) (95% CI)
CV (%)
Vp_SI
(mL/100 g)
(95% CI)
CV (%)
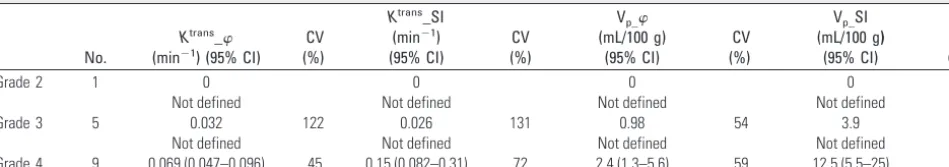
Grade 2 1 0 0 0 0
Not defined Not defined Not defined Not defined
Grade 3 5 0.032 122 0.026 131 0.98 54 3.9 57
Not defined Not defined Not defined Not defined
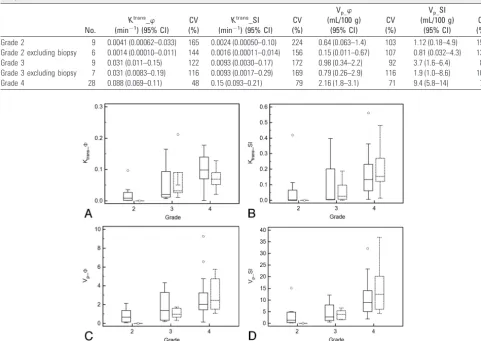
[image:3.594.56.531.178.261.2]depicted graphically in Fig 2. There was a statistical difference in medianKtrans_estimates between grades III and IV (Table 4). The difference inKtrans_between grade II and III gliomas is near statistical significance (P⫽.050) and becomes significant if we exclude patients who had a pathologic diagnosis from a stereo-tactic biopsy and not from a surgical resection (P⫽.0047).
Median Vp_values also increased with higher glioma grade. This difference was not statistically significant between grades II and III but was significant between grades III and IV (Table 4). The intersubject CVs were higher for low-grade gliomas than for high-grade gliomas.
With the magnitude-derived VIF approach,Ktrans_SI values and Vp_SI values also differed on the basis of glioma grade (Tables 1–3) (Fig 2C, -D). There was a statistically significant difference found between grades III and IV but not between grades II and grade III (Table 4).
Vpand KtransValues According to MR Imaging Acquisition Method (2D versus 3D)
In general, 3D acquisitions had lower intersubject CVs for bothKtransand V
pthan 2D acquisitions.Ktrans_values had lower intersubject CVs thanKtrans_SI. Vp_values had lower CVs than Vp_SI except for grade III gliomas (Tables 1–3).
In the group of 9 patients with grade II gliomas, compari-son between values obtained from the 2D fast low-angle shot sequence (1.5T scanner) and 3D fast low-angle shot sequence
(3T scanner) was not possible because only 1 patient was scanned on the 3T scanner (Tables 1 and 2). For patients with grade III, no statistical difference could be found between per-fusion parameters obtained with 2D and 3D acquisition meth-ods, but for grade IV gliomas, a near statistical difference was found withKtrans_(P⫽.058) (Table 4).
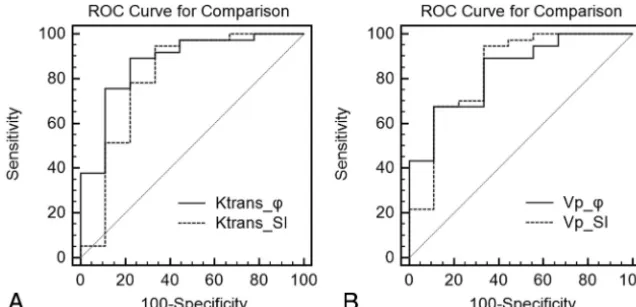
Accuracy of DCE MR Perfusion for Distinguishing Glioma Grades by using ROC
In distinguishing low-grade (II) from high-grade gliomas (III⫹IV), the highest AUC corresponded toKtrans_, followed by Vp_, Vp_SI, andKtrans_SI (Fig 3A, -B) (Table 5). However, the differences between the AUCs forKtrans_versusKtrans_SI and for Vp_versus Vp_SI did not reach statistical significance (P ⫽.18 and P ⫽ .87, respectively). Using a threshold of
[image:4.594.53.535.67.408.2]Ktrans_⬎0.018 minutes⫺1, we achieved a sensitivity of 89%
Table 4: The statistical significance (PValues) of differences in median perfusion parameter values for various grades of gliomas and imaging techniques
PValue Ktrans_ Ktrans_SI V
p_ Vp_SI
Grade II vs III .050 .17 .15 .14
Grade II vs III excluding biopsy .0047 .070 .051 .070
Grade III vs IV .040 .014 .015 .0026
Grade III 2D vs 3D .32 .62 .80 .80
Grade IV 2D vs 3D .058 .50 .57 0.21
Table 3: Median values of the maximal perfusion parameters and coefficient of variation for different grades of gliomas combining 2D and 3D acquisition methods
No.
Ktrans_
(min⫺1) (95% CI)
CV (%)
Ktrans_SI
(min⫺1) (95% CI)
CV (%)
Vp_
(mL/100 g) (95% CI)
CV (%)
Vp_SI
(mL/100 g) (95% CI)
CV (%) Grade 2 9 0.0041 (0.00062–0.033) 165 0.0024 (0.00050–0.10) 224 0.64 (0.063–1.4) 103 1.12 (0.18–4.9) 155 Grade 2 excluding biopsy 6 0.0014 (0.00010–0.011) 144 0.0016 (0.00011–0.014) 156 0.15 (0.011–0.67) 107 0.81 (0.032–4.3) 133 Grade 3 9 0.031 (0.011–0.15) 122 0.0093 (0.0030–0.17) 172 0.98 (0.34–2.2) 92 3.7 (1.6–6.4) 86 Grade 3 excluding biopsy 7 0.031 (0.0083–0.19) 116 0.0093 (0.0017–0.29) 169 0.79 (0.26–2.9) 116 1.9 (1.0–8.6) 103 Grade 4 28 0.088 (0.069–0.11) 48 0.15 (0.093–0.21) 79 2.16 (1.8–3.1) 71 9.4 (5.8–14) 75
Fig 2.Boxplots showing ability of parametersKtrans_(A),Ktrans_SI (B), V
[image:4.594.299.534.663.730.2]and a specificity of 75% (PPV⫽94%, NPV⫽62%). With a threshold of Vp_⬎1.4 mL/100 g, sensitivity was 68% and specificity was 89% (PPV⫽96%, NPV⫽40%).
In distinguishing grade III from grade IV gliomas, the AUCs associated with Vp_and Vp_SI were slightly higher than those obtained forKtrans_SI andKtrans_(Table 5). However, the dif-ferences between the AUCs for Vp_SI and Vp_and forKtrans_SI andKtrans_were not statistically significant (P⫽.43 andP⫽.38 respectively). Using a threshold of Vp_⬎1.75 mL/100 g, sensi-tivity was 68% and specificity was 88% (PPV⫽95%, NPV⫽ 44%) for differentiating grade IV from grade III gliomas.
Within-Subject Reproducibility of Vpand KtransValues by using Magnitude-versus-Phase Techniques
The mean absolute difference betweenKtrans_SI andKtrans_
was 0.06 minutes⫺1with limits of agreement of⫾0.22 min-utes⫺1, which was statistically different (P⫽.001) (Fig 4A). The difference in percentage was 17%, with limits of agree-ment of⫾191%. The mean absolute difference between Vp_SI and Vp_was 6.7 mL/100 g, with limits of agreement of⫾15.4 mL/100 g, which was statistically different (P⬍.0001) (Fig 4B). The difference in percentage was 103% with limits of agreement of ⫾134%. Agreement between Ktrans_SI and
Ktrans_and between V
p_SI and Vp_is dependent on the magnitude of measurements, with a good agreement at low values and a poor agreement at high values.
Discussion
Dynamic susceptibility-weighted contrast-enhanced MR perfu-sion is currently the most frequently used technique to measure CBV in cerebral gliomas, primarily due to the robustness of the technique. Several authors have demonstrated a high degree of correlation between histologic grades and CBV.1,11 However, CBV measurements from dynamic susceptibility-weighted con-trast-enhanced require correction for leakage in areas of blood-brain disruption in tumors and are prone to susceptibility arti-facts arising from hemorrhage, calcification, or bone.12-14
DCE MR imaging is a T1-weighted technique, which is, as a consequence, less sensitive to susceptibility artifacts. It has been introduced more recently to quantify the absolute plasma volume and the volume transfer coefficient, which measures the degree of contrast leakage from the intravascular to the extravascular com-partment. Although there have been numerous studies using
DCE MR perfusion to grade tumors, it is somewhat difficult to compare published values because different research centers have different MR imaging acquisition techniques and postprocessing algorithms. In our study, we compared 2 methods: 1 that assumes that there is linearity between changes in contrast concentration and signal intensity and a more novel approach that uses pre- and postcontrast T1 quantification and a vascular input function de-rived from MR phase images.
The Ktrans values obtained by using the magnitude-VIF (Ktrans_SI) were within the range of those published in 1 of the first studies using DCE MR imaging for grading gliomas by Roberts et al,11which used changes in signal intensity to cal-culate perfusion values.8 The authors obtained a median transfer constant for grade IV gliomas of 0.107 minutes⫺1, which is similar to ourKtrans_SI of 0.15 minutes⫺1. They also found a statistically significant difference between the transfer constants for grade III and IV gliomas but not between grades II and III, which is consistent with our findings. The median fractional blood volume for grade IV gliomas reported by Roberts et al was only 6%, which (assuming a hematocrit of 0.45) is lower than the 17% value corresponding to our Vp_SI value of 9.4 mL/100 g. They did not find a correlation between fractional blood volume and tumor grade, whereas we found a statistical difference between Vp_SI values for grade III and IV gliomas but not between grade II and III gliomas. Their pro-tocol was slightly different from ours because they had low temporal resolution and used a Patlak analysis, whereas our images were acquired with high temporal resolution and ana-lyzed by deconvolution of the VIF.
A more recent study by Patankar et al6used precontrast T1 mapping and a magnitude-derived VIF to demonstrate that CBV can be used to distinguish high-grade and low-grade gliomas. The authors reported CBV values of 1.3%, 3%, and 4% for grade II, III, and IV gliomas, respectively. These results are in the range of our Vp_values of 0.64 mL/100 g (CBV⫽ 1.2%), 0.98 mL/100 g (CBV⫽1.78%), and 2.16 mL/100 g (CBV⫽3.9%) for grade II, III, and IV gliomas, respectively. In contrast to Patankar et al, we did not find a significant differ-ence in Vp_between grade II and III gliomas, perhaps due to inaccurate pathologic grading from biopsy. Two patients in our low-grade glioma group had very high perfusion param-eters but their gliomas were classified as grade II following biopsy. There was probably a sampling bias because the lesions
Fig 3.A, ROC for comparison of maximalKtrans
_andKtrans
[image:5.594.134.452.44.197.2]enhanced strongly and the patients died shortly after surgery. The other study obtainedKtransvalues of 0.0007 minutes⫺1, 0.0185 minutes⫺1, and 0.0250 minutes⫺1for grade II, III, and IV gliomas, respectively, which are lower than our values and could be due to the use of a different pharmacokinetic model. The authors did not find a statistically significant difference between either grade II and III or grade III and IV gliomas.
In agreement with the published literature, our study showed that VpandKtransvalues are dependent on the assumptions made for the conversion of signal intensity to contrast concentration and the choice of vascular input function.5Within each subject, there is a bias toward lower values by using the phase method compared with the signal-intensity method. This bias was less important forKtransthan for Vp(17% versus 103%), but the limits of agreement are larger (SD of 191% versus 134%). Within each glioma group, the reproducibility ofKtrans_is better than that of Ktrans_SI. The diagnostic accuracy ofKtrans_was also slightly better (though not statistically significant) thanKtrans_SI and comparable with conventional MR imaging in our study.
The use of a phase-derived VIF has several advantages over techniques that use a magnitude-derived VIF: Phase does not saturate at high contrast concentration and is less sensitive to inflow effects.8,9,15For that reason, some authors have proposed performing 2 injections of 0.05 mmol/kg of gadolinium for DCE MR imaging to minimize the error arising from the conversion of signal intensity to gadolinium concentration from magnitude images.16While saturation of signal intensity could lead to an underestimation of the contrast agent concentration, the pres-ence of inflow effects could lead to an overestimation.17Our mag-nitude-VIF basedKtransand Vpestimates were higher than those derived from the phase method. This might be due to an under-estimation of the contrast agent concentration in the VIF. We obtained lower coefficients of variation for the perfusion values with the phase method. This is expected because phase-derived VIF is less sensitive to inflow effects.9Even though 3D gradient-recalled echo sequences are less sensitive to inflow than 2D gradi-ent-recalled echo, perfusion values obtained with the phase method also had lower coefficients of variation than the ones obtained from the SI method. The use of bookend T1 measure-ments with the phase technique could also have contributed to an improvement in the calculations of perfusion values because this technique can presumably provide more accurate estimation of the gadolinium concentration in tumors.4
The disadvantages of using a phase-derived VIF are the fol-lowing: It requires additional time to process phase images even though they are freely available from the scanner. Measurements can be biased if there is a drift of the phase signal intensity, making estimation of the steady-state baseline less reliable.18In certain circumstances, such as when the signal intensity–to-noise-ratio is low, the signal-intensity approach might even yield more useful perfusion measurements because less processing of the data is required than for a phase- or magnitude-based approach, which requires the conversion to gadolinium concentration by using T1 measurements obtained at baseline.19
We note 3 potential limitations to our findings: First, the small number of patients with grade II and III gliomas limited our power to detect a statistical difference in the diagnostic accuracy of our novel phase-VIF technique compared with the more con-ventional magnitude-VIF method. Second, because some pa-tients with grade II gliomas had only a biopsy, a misclassification could have resulted in including these cases. We suspect this sur-gical sampling bias contributed to the very high coefficients of variation for perfusion parameters in low-grade tumors. Third, there might be a measurement bias due to methodologic differ-ences between the 2D and 3D techniques. However, we do not believe that the different pulse sequences and field strengths had a major systematic effect on pharmacokinetic parameters calcu-lated from phase-derived VIFs with bookend T1 correction. The bookend technique has inherent self-correcting and self-consis-tency mechanisms that depend little on pulse sequence parame-ters or field strength. There was not any statistically significant difference in steady-state gadolinium concentrations in tumor between the 2D and 3D acquisitions (data not shown). For the phase-derived VIFs, changes in pulse-sequence parameters and field strength theoretically should not introduce systematic errors either. We found no statistically significant difference in peak gadolinium concentration, area under the first pass, or steady-state gadolinium concentration between the 2D and 3D acquisi-tions (data not shown). Therefore, it is not clear why there was a near-significant difference inKtrans_values between the 2D and 3D acquisitions for grade IV gliomas. This is perhaps due to the inherent biologic heterogeneity of these tumors and the subtlety of effects related to the different acquisitions. The similarity of pharmacokinetic parameters between 2D and 3D acquisitions for magnitude-derived VIFs with no T1 correction also suggests that the relationship between signal intensity and gadolinium concen-tration was consistent and reasonably linear for each of the 2 acquisitions.
Conclusions
We have shown thatKtrans_and Vp_values obtained by using the phase-derived VIF with the bookend T1 measurement tech-nique can be used to differentiate low-grade from high-grade gliomas. This novel method can be implemented by using either a 2D or a 3D sequence, but in general, the use of a 3D sequence resulted in better intersubject reproducibility. This approach might improve the diagnostic accuracy of preoperative glioma grading compared with other MR imaging methods currently used to assess tumor perfusion.
Appendix
[image:6.594.54.536.60.105.2]Kinetic modeling theory was performed by using a 2-compart-ment extended Tofts model imple2-compart-mented in the nordicICE soft-ware (NordicNeuroLab).20-22The contrast agent is assumed to be distributed in the plasma volume (Vp) initially with a time-de-pendent leakage to the extravascular, extracellular space.Ktransis the transfer coefficient from the plasma volume to the extravas-cular, extracellular space, and Kepis the rate constant back to the
Table 5: AUC values for various ROC curves
AUC forKtrans_
(95% CI)
AUC forKtrans_SI
(95% CI)
AUC for Vp_
(95% CI)
AUC for Vp_SI
plasma space. Given the tissue concentration curve CT(t) and the vascular input function Cp(t), this equation can be solved by us-ing the followus-ing convolution integral:
CT(t)⫽Ktrans
冕
0 tCp()䡠e⫺Kep(t-)d⫹Vp䡠Cp(t).
When deconvolution of the VIF is performed,Ktransand K ep val-ues are obtained in units of inverse minutes, whereas Vpis a rel-ative fraction.
CT(t) is not measured directly but is derived from changes in MR signal intensity due to gadolinium injection. For the simpler pharmacokinetic approach by using magnitude im-ages only, we assumed that signal intensity varied linearly with CT(t). Because this assumption might not be valid at a high concentration of gadolinium, we used the bookend technique for our novel method with a phase-derived VIF. The bookend technique measured T1pre and T1post values, which allowed computation of CT(t) from changes in signal intensity.
Disclosures: Thanh Binh Nguyen—UNRELATED: Consultancy: Bayer HealthCare, Com-ments: I have acted as a paid consultant for Bayer HealthCare in 2 projects unrelated to the submitted work,Grants/Grants Pending: Bayer HealthCare,Travel/Accommodations/ Meeting Expenses Unrelated to Activities Listed: Bayer HealthCare. Carlos Torres— UNRELATED: Multiple Sclerosis Society of Canada.* Gerard H. Jansen—UNRELATED: Board Membership: Elekta,Comments: payment only of travel costs. Elekta is a laboratory informatics company. The money paid to me is not in any way connected to my work on the publication.Consultancy: Public Health Agency of Canada,Comments: This relates to other work I perform for the Canadian government related to Creutzfeldt-Jakob disease. The money paid to me is not in any way connected to my work on the publication. Jean-Michel Caudrelier—UNRELATED: Employment: Cancer Care Ontario, Comments: clinical fees for service activities. Matthew Hogan—UNRELATED:Grants/Grants Pending: Canadian Foundation for Innovation.*Money paid to the institution.
References
1. Law M, Yang S, Wang H, et al.Glioma grading: sensitivity, specificity, and predictive values of perfusion MR imaging and proton MR spectroscopic im-aging compared with conventional MR imim-aging.AJNR Am J Neuroradiol
2003;24:1989 –98
2. Verheul HM, Voest EE, Schlingermann RO.Are tumours angiogenesis-depen-dent?J Pathol2004;202:5–13
3. Ludemann L, Warmuth C, Plotkin M, et al.Brain tumor perfusion. Compari-son of dynamic contrast enhanced magnetic reCompari-sonance imaging using T1, T2 and T2* contrast, pulsed arterial spin labeling, and H2
15
O positron emission tomography.Eur J Radiol2009;70:465–74
4. Brix G, Griebel J, Kiessling F, et al.Tracer kinetic modelling of tumour angio-genesis based on dynamic contrast-enhanced CT and MRI measurements.Eur J Nucl Med Mol Imaging2010;37(suppl 1):S30 –51
5. Cron GO, Kelcz F, Santyr GE.Improvement in breast lesion characterization with dynamic contrast-enhanced MRI using pharmacokinetic modeling and bookend T(1) measurements.Magn Reson Med2004;51:1066 –70
6. Patankar TF, Haroon HA, Mills SJ, et al.Is volume transfer coefficient (Ktrans) related to histologic grade in human gliomas?AJNR Am J Neuroradiol
2005;26:2455– 65
7. Donahue KM, Weiskoff RM, Burstein D, et al.Diffusion and exchange as they influence contrast enhancement.J Magn Reson Imaging1997;7:102–10 8. Foottit C, Cron GO, Hogan MJ et aI.Determination of the venous output
function from MR signal phase: feasibility for quantitative DCE-MRI in hu-man brain.Magn Reson Med2010;63:772– 81
9. Cron GO, Foottit C, Yankeelov TE, et al.Arterial input functions determined from MR signal magnitude and phase for quantitative DCE-MRI in the hu-man pelvis.Magn Reson Med2011;66:498 –504
10. Weisskoff RM, Zuo CS, Boxerman JL, et al.Microscopic susceptibility varia-tion and transverse relaxavaria-tion: theory and experiment.Magn Reson Med
1994;31:601–10
11. Roberts HC, Roberts TPL, Brasch RC, et al.Quantitative measurement of mi-crovascular permeability in human brain tumors achieved using dynamic contrast-enhanced MR imaging: correlation with histologic grade.AJNR Am J Neuroradiol2000;21:891–99
12. Calamante F, Vonken E, van Osch MJP.Contrast agent concentration mea-surements affecting quantification of bolus-tracking perfusion MRI.Magn Reson Med2007;58:544 –53
13. Mangla R, Kolar B, Zhu T, et al.Percentage signal recovery derived from MR dynamic susceptibility contrast imaging is useful to differentiate common enhancing malignant lesions of the brain. AJNR Am J Neuroradiol
2011;32:1004 –10
14. Hu LS, Baxter LC, Pinnaduwage DS, et al.Optimized preload leakage-correc-tion methods to improve the diagnostic accuracy of dynamic susceptibility-weighted contrast-enhanced perfusion MR imaging in posttreatment glio-mas.AJNR Am J Neuroradiol2010;31:40 – 48
15. Kim J, Seethamraju RT, Suh JY, et al.R1 and R2* changes according to Gd concentration: a potential limiting factor in converting MR signal intensity to Gd concentration.In:Proceedings of the 19th Annual Meeting of the International Society for Magnetic Resonance in Medicine, Montreal, Quebec, Canada; May 6 –13, 2011
16. Sourbron S, Ingrisch M, Siefert A, et al.Quantification of cerebral blood flow, cerebral blood volume and blood-brain-barrier leakage with DCE-MRI.
Magn Reson Med2009;62:205–17
17. Kim YR, Rebro KJ, Schmainda KM.Water exchange and inflow affect the ac-curacy of T1-GRE blood volume measurements: implications for the
evalua-tion of tumor angiogenesis.Magn Reson Med2002;47:1110 –20
18. de Bruin PW, Versluis MJ, Yusuf E, et al.Arterial input functions in dynamic contrast-enhanced MRI: magnitude versus phase. In:Proceedings of the 19th Annual Meeting of the International Society for Magnetic Resonance in Medicine, Montreal, Quebec, Canada; May 6 –13, 2011
19. Song HK, Xue Y, Yu J, et al.Comparison of the standard gadolinium concen-tration and signal difference methodologies for computation of perfusion pa-rameters in DCE-MRI at various SNRs. In:Proceedings of the 19th Annual Meet-ing of the International Society for Magnetic Resonance in Medicine, Montreal, Quebec, Canada; May 6 –13, 2011
20. Ott RJ, Brada M, Flower MA, et al.Measurements of blood-brain barrier per-meability in patients undergoing radiotherapy and chemotherapy for pri-mary cerebral lymphoma.Eur J Cancer1991;27:1356 – 61
21. Tofts PS.Modeling tracer kinetics in dynamic Gd-DTPA MR imaging.J Magn Reson Imaging1997;7:91–101
22. Tofts PS, Brix G, Buckley DL, et al.Estimating kinetic parameters from dy-namic contrast-enhanced T(1)-weighted MRI of a diffusable tracer: standard-ized quantities and symbols.J Magn Reson Imaging1999;10:223–32 Fig 4.Agreement betweenKtrans_andKtrans_SI (A), V
[image:7.594.136.451.43.162.2]