1
Building Decoding Fluency in Children with Reading Delay and
Antisocial Behaviour
A thesis
submitted in partial fulfilment
of the requirements for the Degree
of
Master of Science
in the University of Canterbury
by
Sarah A. Whitcombe-Dobbs
University of Canterbury, New Zealand
2
Contents
Page
LIST OF TABLES ... 4
LIST OF FIGURES ... 5
ACKNOWLEDGEMENTS ... 6
ABSTRACT ... 7
CHAPTER 1: INTRODUCTION ... 8
CHAPTER 2: METHOD ... 39
Experimental Design ... 39
Participants ... 39
Setting ... 45
Measurement Procedures ... 45
Teaching Materials and Procedures ... 49
Schedule of Events ... 52
CHAPTER 3: RESULTS ... 56
CHAPTER 4: DISCUSSION ... 72
REFERENCES ... 88
APPENDICES Appendix I: Information and Consent Forms ... 100
Appendix II: Phonemic Segmentation Test ... 102
Appendix III: Decoding Fluency Test... 103
Appendix IV: Canterbury Social Development Scale... 105
3
Appendix VI: Sample Flashcards... 108
Appendix VII: Sample Racetracks ... 109
Appendix VIII: Sample SNAP! Cards ... 110
4
List of Tables
Page
Table 1. Various Interventions Targeting Specific Reading Skills ……….... 19
Table 2. Risk, Predictive and Protective Factors for Developing Conduct Disorder……... 22
Table 3. Demographic Characteristics and Pre-test Scores for the Seven Participants …... 43
Table 4. Teacher-Reported Additional Information ..……….… 44
Table 5. Pre- and Post-Test Reading Ages on the Neale Analysis of Reading Ability...…… 69
Table 6. Pre- and Post-Test or Follow Up results on the Decoding Fluency Test and the Prose Reading Fluency Measure ……….………... 70
5
List of Figures
Page
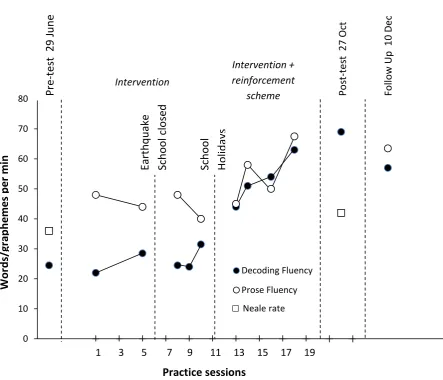
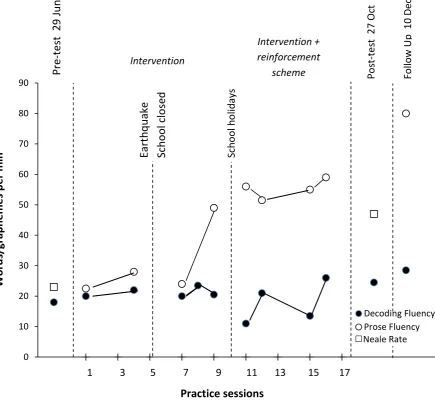
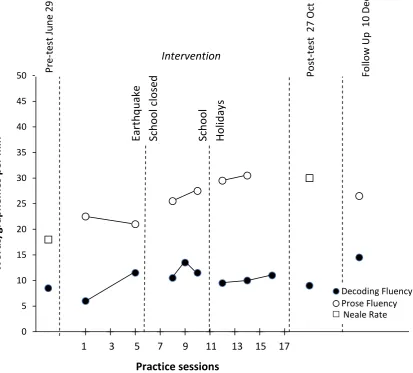
Figure 1. Children‟s vocabulary development across income groups………...…. 15 Figure 2. Number of correct graphemes per minute on the Decoding Fluency Test, number of correct words per minute on connected prose, and pre- and post-test Neale reading rate scores for Sophie…..………...……….. 57 Figure 3. Number of correct graphemes per minute on the Decoding Fluency Test, number of
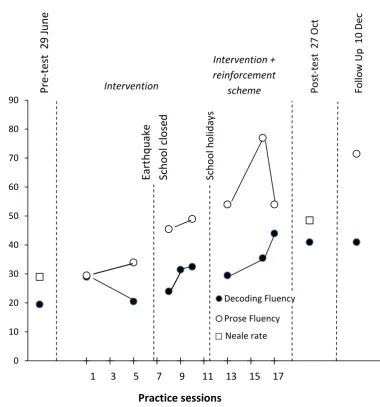
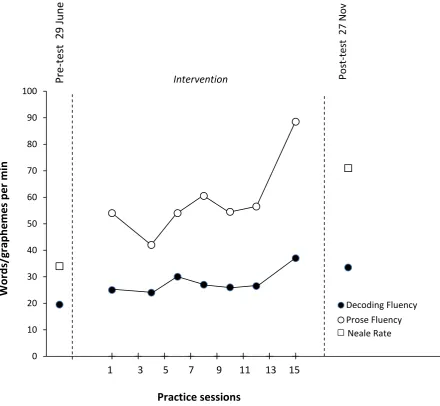
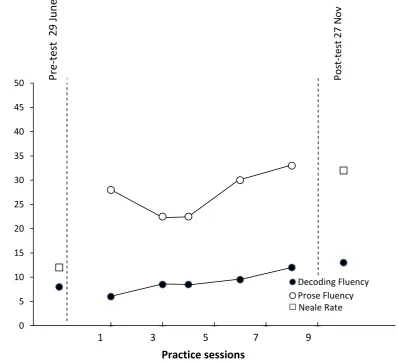
correct words per minute on connected prose, and pre- and post-test Neale reading rate scores for Isaiah…..………... 59 Figure 4. Number of correct graphemes per minute on the Decoding Fluency Test, number of
6
Acknowledgements
7
Abstract
The present study firstly aimed to identify children with delayed reading who were missing the component skills of decoding fluency and who also displayed antisocial behaviour in the classroom. It also aimed to replicate with them an intervention designed by Church, Nixon, Zintl and Williams (2005). The study finally aimed to explore the question of whether children who have both a reading delay and a disruptive behaviour disorder require a reinforcement scheme to maintain their engagement in learning activities. Six participants worked with same-age peer tutors on specially-designed practice activities for approximately 20 minutes a day, four times a week, for 8-18 sessions. Improvement in decoding fluency and prose reading fluency was tracked for each child throughout the intervention. Results showed that the six participants gained, on average, sixteen months on their age-equivalent score for reading rate. Decoding fluency scores increased from a pre-test average of 16 correct
8
Chapter One
Introduction
“The connection between reading speed and comprehension; a film is made up of still images flashed in rapid succession to simulate
movement. Slow down the film, and the movement and meaning slows and the film's impact is diminished. Viewers won't learn as much about the film as if it were shown at normal speed. With reading the same thing can happen. When a person reads word by word, like frame by frame, they are not reading on the level of ideas. You need to read on some level that's more conversational and allows things to coalesce into ideas themselves.” (Evans, n.d.).
Behaviour problems and reading problems in children are the two most common
difficulties faced by teachers, parents and other professionals. Prevalence rates vary, but up to about 20% of all children experience problems in learning to read (Lee, 2009; Chamberlain, 2006), and up to about 5% engage in antisocial behaviour (Church, 2003; Patterson,
9 and antisocial behaviour develop, interventions can be tailored to be appropriate for this group‟s special education and behaviour management needs.
Component Skills of Reading
Learning to read is a complex process that requires the acquisition of a number of component skills (Gelheiser & Clark, 1991). An adult-level reader can read with speed, accuracy and understanding but, in order to do so, they must have previously mastered some specific component skills. The first of these is the ability to discriminate between the written letters of the alphabet (Adams, 1990). This skill is also referred to as letter-naming or
orthographic knowledge. It consists of the ability, for English-speaking readers, to
discriminate between the 52 lower-case and upper-case English letters (Church, 2005). In addition to visually discriminating between the letters, a child learning to read must also be able to aurally discriminate between the sounds of the phonemes (Adams, 1990). Spoken English contains 43 phonemes, or sounds, that are used to make up words. The ability to “hear the difference” between the sounds is most commonly referred to as phonemic awareness. It is also called phoneme discrimination, phonological awareness and linguistic awareness (Church, 2005). It is virtually impossible to teach a child to read until they have acquired a good level of phonemic awareness (Church, 2005; Stanovich, 1998). A third component skill of competent reading is a knowledge of grapheme-phoneme equivalence relations, or the alphabetic code (Gelheiser & Clark, 1991). This is the ability to see a letter, or group of letters, and to correctly pronounce the sound it or they make. This is often
10 equivalence relations. The term “grapheme” refers to a letter or a group of letters used to represent a single phoneme. The term “equivalence relations” acknowledges that each phoneme has a written form and a spoken form. When joined together to make words, each word also has a particular meaning. Thus, the word “bell” can be expressed orally (as three phonemes joined together), written graphically on paper, and understood as referring to a particular object. In order to read a word with comprehension, a child needs to be able to recognise its graphic form, pronounce it orally, and understand its meaning. Knowledge of individual words involves six equivalence relations: the ability to comprehend the spoken word and the written word, the ability to use the word correctly in both oral and written language and the ability to read and to spell the word. Although there are six equivalence relations to be learned, Sidman (1994) discovered that in most cases only two of these need to be specifically taught in order for a child to acquire knowledge of all six equivalence
relations. The English language uses over 200 graphemes to represent its 43 phonemes, and around 110 of these occur with high frequency (Adams, 1990).
After learning to correctly identify the letters of the alphabet, to aurally distinguish between the spoken sounds, and to recognise a sufficient number of phoneme-grapheme equivalence relations, the child needs to be able to recognise and read the written graphemes with sufficient speed to maintain the meaning of what is being read. This means that their responses (spoken phonemes) to the stimuli (written graphemes) need to be fast enough to be automatic, or without conscious thought (Church, 2005; Gelheiser & Clark, 1991). Williams (2002) discovered that the rate at which most normal-progress 8- and 9- year olds decode the 45 most commonly-occurring English graphemes is 60-70 graphemes per minute. The speed and accuracy with which a child can recognise and pronounce grapheme-phoneme
11 comprehension (Church, 2005; Hasbrouck & Tindal, 2006; Fuchs, Fuchs, Hosp & Jenkins, 2001). This is because slower readers have to hold the beginning words of each sentence in memory for longer than faster readers; it is difficult to concentrate on decoding each word while remembering previous words. Faster readers appear to automatically recognise each word and hence only have to hold previously-read words in memory for a few seconds in order to maintain comprehension. This can be referred to as “developmental efficiency” in learning to read (Ferrer et al., 2007). Church (2005) notes that it is unlikely that the slow reading rate of the child who struggles with decoding fluency will be experienced as engaging by the child, making them less likely read for pleasure and consequently more likely to miss many vital practice opportunities.
The size of a child‟s receptive vocabulary must also be mentioned at this point. If one already knows the meanings of the words one is reading, mental processes simply match the written word to the spoken one with the meaning already present. It logically follows that if a child has a small vocabulary, their reading will be slower as they will also be trying to work out the meanings of words as well as decoding the graphemes (Adams, 1990; Jenkins, Fuchs, van den Broek, Espin & Deno, 2003; Sidman, 1994). Thus, the size of a child‟s receptive vocabulary will affect the rate of acquisition of the component skill of decoding fluency when learning to read (Church, 2005).
Attaining a “sight-word” vocabulary that is large enough to read most of the words in most of the text facilitates the development of reading fluency. When most words are
12 words read by children who are skilled readers (Clay, 1967; Juel, 1988; Anderson, Wilson & Fielding, 1988).
Prose reading fluency, or oral reading fluency, refers to the number of words read correctly per minute, and can be used to define competent reading (Adams, 1990; Fuchs, Fuchs, Hosp & Jenkins, 2001). Hasbrouck and Tindal (2006) examined the oral reading fluency of children in elementary school in North America with a view to establishing norms. They found that after two years at school, the average oral reading fluency rate of
age-appropriate text was around 95 words per minute. This rose to 115 words per minute after three years, and after four years to about 120 words per minute. In a related study, children who were identified as skilled readers read at around 150 words per minute, while the children whose reading was delayed read much more slowly, at around 50 words per minute after five years at school (Jenkins et al, 2003). This research allows us to use oral reading fluency as a good measure of overall reading ability.
Origins of Reading Delay
13 Etiology of reading delay: Neurodevelopmental theory
Shaywitz and Shaywitz (2003) found, using functional magnetic resonance imaging (fMRI), that children and adults with dyslexia had brains that showed different activation patterns from children and adults whose reading skills were developing at a normal rate. This evidence has been used to conclude that reading delay in children is caused by a neural abnormality. However, it is possible that both the neural differences and the poor reading are caused by a common antecedent variable because cause and effect were not demonstrated by the Shaywitz and Shaywitz correlational method (Church, 2005). Nevertheless, it is clear that there are some neurobiological differences between typically-developing children and those who struggle to learn to read. If the neural differences truly are a cause of reading delay, it is doubly important to identify and effectively support children‟s learning as early as possible. The arguments over whether this is a cause or an effect will continue but the end result is the same: children with reading delay need effective remedial help, and educational interventions are the only interventions available at this time. As an aside, it is tempting for professionals to place the cause for reading delay “within” the child – this exonerates them from
responsibility for the child‟s lack of progress. This is unhelpful, as it can result in parents and professionals accepting the status quo instead of adjusting the environment to give the child every opportunity to succeed. In fact, Shaywitz and Shaywitz (2007) report that evidence-based reading intervention at an early age supports the development of the affected neural areas as well as increasing reading fluency (Foorman, Brier & Fletcher, 2003; Shaywitz & Shaywitz, 2007; Torgeson et al., 1999).
Etiology of reading delay: Lack of opportunity to learn
14 learning to read, and even during the early years there are variations in the number of
learning opportunities experienced by individual children. Hart and Risley‟s (2003)
description of their research summarises the similarities and differences they found between the language experiences of the 2- to 3-year old children of professional, working class and welfare-dependent parents in their sample. As they point out, infants and preschoolers, up until the age at which they enter an educational institution, are dependent solely on their families for their language development. Hart and Risley recorded over 1300 hours of
observations in the homes of 42 families. The average number of parental utterances per hour of the Professional parents was 487; the Working Class group parents used 301 utterances per hour; and the Welfare group parents engaged in 176 utterances per hour – around 36% of that of the parents in the Professional group. Given that children‟s language develops through exposure to conversation, it is not hard to see how their children‟s speech development might be affected (Hart & Risley, 2003). Figure 1 shows the differences in the vocabularies of the children in the three different socioeconomic groups at three years of age.
15 Figure 1: Children‟s vocabulary development across income groups (referenced from Hart & Risley, 2003, p. 114).
Remedial Reading in New Zealand
16 discontinued because they moved schools or for other reasons (Lee, 2009). Although results from the Progress in International Reading Literacy Study (PIRLS) 2005/2006 show that New Zealand‟s Year 5 students achieved well in reading, the wide range of results is
concerning because it includes what is often referred to as a “long tail” of underachievement (Chamberlain, 2006). In the PIRLS study, at Year 5, 5% of girls and 11% of boys did not reach the Low International Benchmark, meaning that they could not, for example, “locate a specified part of the story… or reproduce explicitly stated information, particularly when it was located at the beginning of the text or in a clearly defined section” (Chamberlain, 2006, p. 23). The sociological data of the lower-achieving students point to inequalities in our education system and wider society: the children were more likely to be male and from lower socioeconomic backgrounds, and Maori and Pasifika children were over-represented
(Chamberlain, 2006). This evidence is paralleled by the Annual Monitoring of Reading Recovery 2008 report, indicating that “…Asian and Pakeha/European students were more likely to have successfully discontinued their series of lessons than Pasifika and Maori
students… (who were) more likely to be referred on for specialist help…(or) to have left their school before reaching the level required to successfully discontinue their Reading Recovery lessons” (Lee, 2009, p. 17).
Reading Recovery uses a whole-language, or “top-down” approach to literacy. Rather than teaching the skills for phonological decoding of unknown words, children are taught to use multiple clues to identify words (Greaney, 2002). This lack of letter-sound teaching is the main criticism of the Reading Recovery programme, and it appears that the significant
17 the children who need it (Cosgrave, Bennie & Kerslake, 2002; Hiebert, 1994). Children with reading problems can be reliably identified at 7-8 years and spontaneous recovery after this time is extremely unlikely (Smart et al., 1996). It follows that children for whom Reading Recovery has failed need an intervention that focuses on mastery of the missing component skills of reading.
Building Decoding Fluency as a Reading Intervention
Williams (2002) investigated the phonemic awareness, decoding fluency and reading age of 8- to 9- year old children. Sixty-four children were separated, according to their ability, into two groups: Low Progress readers and Normal Progress readers. The Neale Analysis of Reading Ability (Neale, 1999) was used to measure reading ability, and the children in the Low Progress group scored on average 27 months behind children in the Normal Progress group. There were no significant differences between the groups according to gender and ethnicity. Williams measured their phonemic awareness using a short test based on the Queensland Inventory of Literacy (Dodd, Holm, Oerlemans & McCormick, 1996). Williams and Church then devised a timed two-minute test to measure decoding fluency. It was found that children in the Low Progress group had similar phonemic awareness skills to the children who were reading at the appropriate level for their age. Their decoding fluency, however, was significantly weaker than that of the normal progress readers. None of the readers who were significantly delayed were able to decode graphemes at the speed of 60 words a minute or more, whereas all except five of the children in the Normal Progress group were able to do so (Williams, 2002). Williams concluded that the ability to decode graphemes rapidly was the component reading skill lacked by many 8- to 9-year old children with
18 Decoding fluency is positively correlated with word reading fluency (Olsen, Wise, Conners & Rack, 1990; Shankweiler et al., 1999) and with overall progress in learning to read (Juel, 1988; Jones, Torgesen & Sexton, 2001). As mentioned above, many studies have shown that oral reading fluency is an important marker characteristic of reading ability (Church, 2005; Fuchs et al., 2001; Hasbrouck & Tindal, 2006). Therefore, an intervention for older children with reading delays is more likely to be effective if it targets the specific skill deficit of reading fluency. To do this, the children whose decoding skills are less fluent must be given sufficient learning opportunities to build their decoding skills to a higher, functional level of decoding fluency. This appears to be about around 60-70 graphemes per minute. Although there are few studies that have evaluated programmes to build fluency, Table 1 summarises some interventions that targeted component reading skills. The most effective of these per unit of time was the intervention reported by Church, Nixon, Williams and Zintl (2005).
The Church et al. (2005) study was designed to find out whether building decoding fluency in older poor readers improved not only their decoding fluency but also their prose reading fluency. Children were referred by their teachers. The Neale Analysis of Reading Ability (Neale, 1999) was used to test reading age, and children were included who scored at least one year behind their biological age. The authors also screened for phonemic awareness using the Phonemic Segmentation test used by Williams (2002), including only those
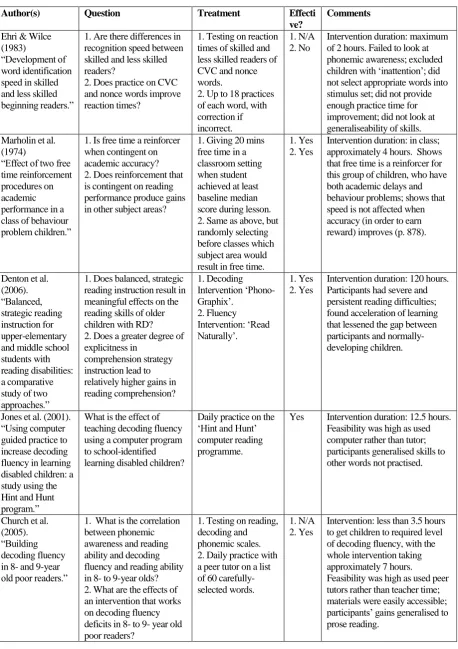
19 Table 1: Various interventions targeting specific reading skills.
Author(s) Question Treatment Effecti ve?
Comments
Ehri & Wilce (1983)
“Development of word identification speed in skilled and less skilled beginning readers.”
1. Are there differences in recognition speed between skilled and less skilled readers?
2. Does practice on CVC and nonce words improve reaction times?
1. Testing on reaction times of skilled and less skilled readers of CVC and nonce words.
2. Up to 18 practices of each word, with correction if incorrect.
1. N/A 2. No
Intervention duration: maximum of 2 hours. Failed to look at phonemic awareness; excluded children with „inattention‟; did not select appropriate words into stimulus set; did not provide enough practice time for improvement; did not look at generaliseability of skills. Marholin et al.
(1974)
“Effect of two free time reinforcement procedures on academic performance in a class of behaviour problem children.”
1. Is free time a reinforcer when contingent on academic accuracy? 2. Does reinforcement that is contingent on reading performance produce gains in other subject areas?
1. Giving 20 mins free time in a classroom setting when student achieved at least baseline median score during lesson. 2. Same as above, but randomly selecting before classes which subject area would result in free time.
1. Yes 2. Yes
Intervention duration: in class; approximately 4 hours. Shows that free time is a reinforcer for this group of children, who have both academic delays and behaviour problems; shows that speed is not affected when accuracy (in order to earn reward) improves (p. 878).
Denton et al. (2006). “Balanced, strategic reading instruction for upper-elementary and middle school students with reading disabilities: a comparative study of two approaches.”
1. Does balanced, strategic reading instruction result in meaningful effects on the reading skills of older children with RD? 2. Does a greater degree of explicitness in
comprehension strategy instruction lead to relatively higher gains in reading comprehension? 1. Decoding Intervention „Phono-Graphix‟. 2. Fluency Intervention: „Read Naturally‟. 1. Yes 2. Yes
Intervention duration: 120 hours. Participants had severe and persistent reading difficulties; found acceleration of learning that lessened the gap between participants and normally-developing children.
Jones et al. (2001). “Using computer guided practice to increase decoding fluency in learning disabled children: a study using the Hint and Hunt program.”
What is the effect of teaching decoding fluency using a computer program to school-identified learning disabled children?
Daily practice on the „Hint and Hunt‟ computer reading programme.
Yes Intervention duration: 12.5 hours. Feasibility was high as used computer rather than tutor; participants generalised skills to other words not practised.
Church et al. (2005). “Building decoding fluency in 8- and 9-year old poor readers.”
1. What is the correlation between phonemic awareness and reading ability and decoding fluency and reading ability in 8- to 9-year olds? 2. What are the effects of an intervention that works on decoding fluency deficits in 8- to 9- year old poor readers?
1. Testing on reading, decoding and phonemic scales. 2. Daily practice with a peer tutor on a list of 60 carefully-selected words.
1. N/A 2. Yes
Intervention: less than 3.5 hours to get children to required level of decoding fluency, with the whole intervention taking approximately 7 hours.
20 The researchers introduced an intervention that specifically targeted decoding fluency. This was done over about four weeks, with 21 minutes of practice a day with peer tutors from the participants‟ classrooms. Specific activities included flashcards, reading racetracks and a game of SNAP! All reading activities centred on words from a sixty-word list compiled by the researchers. This list provided practice on 50 commonly occurring English graphemes. Each of 25 targeted consonants and consonant digraphs were present in two words in the initial position. Each of the 18 targeted vowels and diphthongs were present in two words in the middle position. Many of the targeted consonant graphemes also appeared in the terminal position. Words were limited to one-syllable words, with the exception of “video”. Results showed that the children‟s prose reading fluency improved dramatically as a result of this intervention: from an average of 45 correct words per minute to almost 74 correct words per minute. They also had an average increase in comprehension age of 14 months (Church et al, 2005).
There were some inconsistencies in administration of the experiment. The time between intervention and follow-up was inconsistent across participants; the practice settings were inconsistent; the number of measures taken across participants varied and one child was also receiving extra reading tutoring for the duration of the experiment (Church et al., 2005). Overall, however, the intervention produced greater gains in decoding fluency and reading progress than any other intervention found on the subject. This experiment was a feasible intervention in a mainstream classroom setting, requiring very little extra teaching time or funds above those that would be normally allocated for each student.
Behaviour Problems
21 Horwood, 1995). Children with behaviour problems are more likely to have difficulties learning to read, and children with learning difficulties are more likely to have behaviour problems (Fergusson & Horwood, 1995). Difficulties in learning to read and atypically high levels of antisocial behaviour, once established, can be highly stable (Smart et al., 1996).
Origins of Antisocial Behaviour in Children
Many labels have been applied to children who engage in elevated rates of antisocial behaviour: oppositional defiant disorder, conduct problems, early-onset conduct disorder, emotional-behavioural disturbance/disorder, antisocial behaviour, behaviour difficulties and so on. For the purpose of this paper, “developmentally inappropriate levels of antisocial behaviour” will suffice as it is broad enough to include most terms used by other researchers.
Over the past four decades, much research has examined the ways in which children develop antisocial behaviour, and there is now a detailed understanding of its trajectory (Cicchetti, Toth & Maughan, 2000; Patterson et al., 1990). For a list of the ecological and biological risk and protective factors for developing antisocial behaviour, see Table 2.
However, the present study focuses on the social learning processes that lead to elevated rates of antisocial behaviour. “Antisocial development consists of thousands of trials in which dispositions, contexts, and life experiences reciprocally influence each other across time, canalizing pathways toward or away from chronic conduct-problem outcomes.” (Dodge & Pettit, 2003, p. 358). During childhood, the immediate family is the main social environment. As the child grows, so the environment expands, but the main ecological contexts remain the parents, siblings, peers and teachers. The Oregon Social Learning Centre (OSLC) has
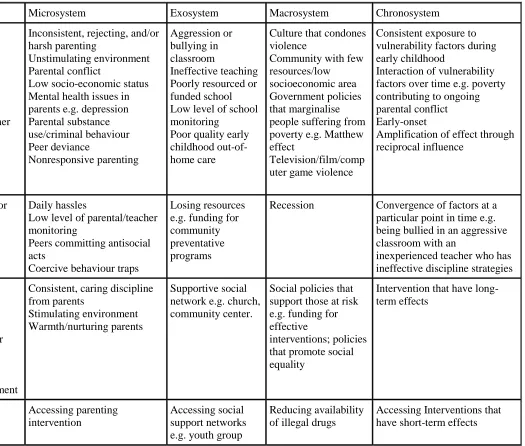
22 Table 2: Risk, Predictive and Protective Factors for Developing Conduct Disorder
Ontogenic Microsystem Exosystem Macrosystem Chronosystem
Vulnerability Factors (enduring) Difficult temperament Attention Deficit Disorder/Impulsivity Poor social skills Learning &language disabilities/delays Substance abuse
Exposure to smoking or other teratogens in prenatal
environment Male gender School failure Large size at age 3
Inconsistent, rejecting, and/or harsh parenting
Unstimulating environment Parental conflict
Low socio-economic status Mental health issues in parents e.g. depression Parental substance use/criminal behaviour Peer deviance Nonresponsive parenting Aggression or bullying in classroom Ineffective teaching Poorly resourced or funded school Low level of school monitoring
Poor quality early childhood out-of-home care
Culture that condones violence
Community with few resources/low socioeconomic area Government policies that marginalise people suffering from poverty e.g. Matthew effect
Television/film/comp uter game violence
Consistent exposure to vulnerability factors during early childhood
Interaction of vulnerability factors over time e.g. poverty contributing to ongoing parental conflict Early-onset
Amplification of effect through reciprocal influence
Challengers (transient)
Stressors e.g. being teased or bullied
Daily hassles
Low level of parental/teacher monitoring
Peers committing antisocial acts
Coercive behaviour traps
Losing resources e.g. funding for community preventative programs
Recession Convergence of factors at a
particular point in time e.g. being bullied in an aggressive classroom with an
inexperienced teacher who has ineffective discipline strategies Protective
Factors (enduring)
Good conflict management skills
Close relationship with teacher/adult
Skill or talent in a particular area
Female gender Non-smoking mother
Good early health/development
Consistent, caring discipline from parents
Stimulating environment Warmth/nurturing parents
Supportive social network e.g. church, community center.
Social policies that support those at risk e.g. funding for effective
interventions; policies that promote social equality
Intervention that have long-term effects
Buffers (transient)
Pride over accomplishment Accessing parenting intervention
Accessing social support networks e.g. youth group
Reducing availability of illegal drugs
23 During the first four years of life, there are a number of markers which point towards a risk of antisocial development. Firstly, a child may fail to acquire age-appropriate levels of compliance. Data from direct observational studies in 12 countries show that rates of compliance for 2 to 3 years olds are around 72% (Whiting & Edwards, 1988). Parents who have not developed the skills to manage misbehaviour and establish boundaries are more likely to have aversive interactions with their children (Patterson et al., 1990). In fact, aversive interactions make up 10 to 15% of interactions in families with a child displaying antisocial behaviour, and preschoolers with antisocial development yell, tease or whine approximately twice as many times as their typically-developing peers – about once every two minutes (Patterson, 1982). Pro-social behaviour develops in young children through reinforcing responses from parents when the child displays desirable behaviour, and
punishing responses when the child displays undesirable behaviour. Parents of children with antisocial behaviour tend to be non-contingent in their responses to their child‟s actions i.e. inconsistent and unpredictable. They also tend to be harsher, to have little positive
involvement with the child, and to provide inadequate supervision and monitoring of their children (Patterson, 1982).
24 and those with antisocial development. They found that for the children with antisocial development, coercive tactics worked more often than constructive tactics, whereas for the typically-developing children, constructive tactics worked more often than coercive tactics. This leads to a behaviour trap whereby the child repeatedly avoids demands made on them, often ones which would normally lead to important skill acquisition such as conflict
resolution skills, homework and housework. Over many thousands of separate interactions, the child not only misses out on thousands of learning opportunities but coercive responses become increasingly entrenched. Thus the child develops two sets of problems: antisocial behaviour and a lack of pro-social skills (Patterson et al., 1990). Effective parents, on the other hand, avoid reinforcing child misbehaviour such as tantrums and whining, and intervene in such a way that the coercive behaviour ceases (Snyder & Stoolmiller, 2002).
When a child reaches the primary years, their antisocial behaviours begin to shape their social environment (Dodge & Pettit, 2003). Aggressive social interactions such as tantrums and hitting lead to rejection by pro-social peers, which in turn further reduces their
opportunities to develop pro-social skills (Cantrell & Prinz, 1985; Dodge, Coie & Brakke, 1982; Patterson et al., 1990; Roff & Wirt, 1984) “Rejected children are also deficient in a number of social-cognitive skills, including peer group entry, perception of peer group
norms, response to provocation, and interpretation of pro-social interactions” (Patterson et al., 1990, p. 265). An inability to manage appropriate classroom behaviour leads to missed
learning opportunities and they are likely to fall behind in their academic skills (Patterson et al., 1990).
25 likely to sanction inappropriate behaviour. They also have low rates of attending positively to children with disruptive behaviour even when those children display appropriate behaviour (Goldstein & Brooks, 2007; Walker & Buckley, 1973). There is potential to turn this around: school-wide changes in teachers‟ behaviour management practices have lead to a significant lowering in the amount of antisocial behaviour exhibited by children with behaviour
problems (Nelson, 1996). In this way, the bidirectional relationship between the antisocial child and their social environment is demonstrated: social rejection by peers is both a result of and a contributing factor to aggressive behaviour. Failure to acquire academic skills is the result of an inability to self-manage, and a cause of later struggles when the child is further behind and finding the work too difficult.
Antisocial Behaviour and Reading Delay
26 The nature of the correlation is complex, whether: reading problems cause behaviour
problems; whether behaviour problems cause reading problems; whether there is a
bidirectional relationship between the two; or whether both result from a common antecedent variable (Fergusson & Lynskey, 1997; Hinshaw, 1992). Is it more important to provide an intervention that targets behaviour, and hope that this results in better learning as well? Or, is it better to provide remedial teaching so that the child does not have to „act out‟ in order to distract peer attention away from their lower academic achievement?
Hinshaw (1992) explored the issues surrounding the relationship between academic underachievement and antisocial behaviour. Firstly, he found that hyperactivity-inattention problems were associated with poor progress in primary school, but antisocial behaviour was correlated with academic underachievement in adolescents. During the early years, the strong relationship between cognitive deficits such as inattention, and externalising behaviour and poor reading progress suggests the presence of prior antecedent variables contributing to all domains (Jorm, Share, Matthews & Maclean, 1986; Kellam, Branch, Agrawal and
Ensminger, 1975; McGee et al., 1986; McMichael, 1979; Richman, Stevenson & Graham, 1982; Palfrey, Levine, Walker & Sullivan, 1985;). No unidirectional causation models for reading problems or antisocial behaviour were supported when regression analyses controlled for other factors (Hinshaw, 1992).
27 behaviour and reading delay (Hinshaw, 1992; Moffitt, 1990; Olweus, 1983; Richman et al, 1982).
28 in a mediating role rather than as a prior causative factor as argued by other researchers (Fergusson & Lynskey, 1997; Hinshaw, 1992; Morgan et al., 2008; Smart et al., 1996).
Fergusson and Lynskey (1997) sought to delineate the causation, if it existed, using data from the Christchurch Health and Development Study, which has examined the development of over 1200 children born in Christchurch in 1977. Around 13% of children were identified from testing at age 8 years as having reading delay. Conduct problems were assessed once every two years from age 10 through to age 16 using self-report, teacher-report and maternal-report measures. Information about possible confounding factors were also included in the data to be analysed, and these included: early childhood indicators of conduct problems and attentional difficulties, demographic factors such as maternal age and
education, socioeconomic status, ethnicity, living standards, childhood disadvantage, avoidance of punishment, and maternal emotional responsiveness.
Unsurprisingly, they found that children with reading delay had significantly higher conduct problem scores on average. Gender and age, however, were both modifiers of the relationship, suggesting that boys‟ conduct problems were more likely to be exacerbated by reading delay. The authors then compared the reading-delayed and non-reading-delayed children according to social, family and individual factors. There were a number of
29 covariate factor that consistently emerged as a predictor of later conduct problems was
conduct problems at the age of 6 years” (Fergusson & Lynskey, 1997, p. 904). They did, however, find a correlation between conduct problems at age six and reading delay at age eight, and suggest that this may be due to common antecedent variables during early development. The authors concluded that reading delay does not cause later conduct problems, but that the two have many early risk factors in common.
Effective Interventions for Antisocial Behaviour in the Classroom
Functional assessment of disruptive behaviour and antisocial behaviour in the primary school classroom confirms that such behaviour is very frequently maintained by the positive reinforcement and negative reinforcement which it produces for the misbehaving child (Heckaman, Conroy, Fox & Chait, 2000). It is not surprising, therefore, to find that the interventions which have been shown to be most successful are those in which appropriate behaviour results in reinforcement and inappropriate behaviour results in extinction, escape extinction, time out or response cost contingencies.
The simplest way of changing the classroom contingencies for pro-social and antisocial behaviour in the classroom is differential attention. With differential attention the teacher attends to the child in a positive manner when they are behaving appropriately, and
withdraws this attention whenever the behaviour becomes inappropriate (Walker et al., 1997; Webster-Stratton & Reid, 2002). It has been consistently found that when teachers attend more than 50% of the time to appropriate behaviour rather than misbehaviour, the level of antisocial behaviour is reduced even in children with ongoing conduct problems (e.g. Sutherland, Wehby & Copeland, 2000; Wood, Umbreit, Liaupsin & Gresham, 2007).
30 contingent access to desired activities has been found to be highly effective (e.g. Baer,
Fowler & Cardin-Smith, 1984; Marholin, McInnis & Heads, 1974).
These contingency changes have been introduced in the form of a game. For example, the Good Behaviour Game devised by Barrish, Saunders and Wolf (1969) consists of
breaking the class into teams. Behaviour goals are set and defined, and teams‟ behaviours are monitored throughout the day. Children who behave inappropriately receive a check against their team on a visible board. Teams with low numbers of checks are rewarded at the end of the day. A review by Tingstrom, Sterling-Turner and Wilczynski (2006) found that the research base for its effectiveness is strong. There are a variety of ways that the Good Behaviour Game can be implemented, but the mechanisms remain the same. Reinforcers, team competition and peer pressure combine to motivate students who are usually disruptive to curb their behaviours in order to „win‟ the game. A disadvantage for this intervention is that the peer pressure from the other children in a team towards a disruptive child to try and influence them to behave pro-socially may begin to verge on harassment (Tingstrom et al., 2006).
The research into differential reinforcement for pro-social behaviour in the classroom shows that positively attending to appropriate behaviour, reinforcement for appropriate behaviour, consistent consequences for inappropriate behaviour, interdependent reward systems for appropriate team behaviour and systematic monitoring and feedback systems can all be used to motivate children with behaviour problems to behave prosocially.
Peer Tutoring as an Intervention
Church et al. (2005) successfully paired normal- to high-progress readers with low-progress readers to implement their intervention. As mentioned above, the number of learning opportunities available to each child is a key factor in the process of learning to read –
low-31 progress peers. Any intervention that targets reading delay needs therefore to provide many more learning opportunities for the delayed reader if they are to “catch up”. Given that most classrooms have 20 to 30 pupils, it is not possible for a class teacher to provide individual children with additional teacher-supervised reading practice daily. Peer tutoring is an
effective alternative teaching technique commonly used in classrooms to optimise one-to-one teaching and learning time, and has benefits both for the learner and the tutor. These include increased time spent on task, a greater number of learning experiences and immediate feedback on academic performance (Fuchs, Fuchs & Kazdan, 1999; Spencer, 2006). It generally consists of pairs working together to teach each other material that their class teacher has set up for them to learn and is often used, with good effect, for children who underachieve academically (Falk & Wehby, 2001).
Spencer (2006) reviewed the use of peer tutoring with children with emotional or behavioural disorders, both as the tutor and the tutee. Research studies were included from mainstream schools and special schools, and the author used a wide definition of EBD to include as many studies as possible. Peer tutoring arrangements could involve same-age or cross-age peers. Thirty-eight studies published between 1972 and 2003 were examined. Around three-quarters of these studies were set in public schools (state schools), and 526 of the 982 (54%) of the tutors had some form of EBD. On average, the tutoring sessions occurred four times per week, for 23 minutes a day, on subjects that included math, reading and social studies. Thirteen studies yielded calculable effect sizes, with an average positive effect of 0.72. Seventeen reports were set in elementary (primary) schools, with eight of them targeting reading. Peer tutoring was generally found to be effective. All but one study
32 EBD was found to be an effective strategy for learning with possible additional social and behavioural benefits (Spencer, 2006).
An after-school programme was the setting for one study examining both contingent rewards, peer tutoring and paired instruction for ten at-risk pupils aged 9- to 11-years old (Gardner et al., 2001). Direct Instruction in reading was delivered by one-to-one coaching from adults, but the math component was taught via reciprocal peer tutoring, using timed tests, over three months. The educators gave group rewards for students staying on-task throughout the day‟s programme. Seven out of 10 students made gains in multiplication fluency to over 50 correct answers per minute. Although the academic gains in this
evaluation were significant, they were made in the context of a complete programme with a large number of variables, so the attributable gains to the peer tutoring are unknown.
Sutherland and Snyder (2007) tested the effects of reciprocal peer tutoring and self-graphing on the reading fluency, disruptive behaviour and active responding of four children, aged 11-13, with EBD. Because research has found that the relationships between members of a dyad in peer tutoring situation can be problematic when randomly assigned (Pomplun, 1997; Slavin, 1994; Sutherland, Wehby & Gunter, 2000), the classroom teacher used
academic achievement data as well as social competence and observation data to group each child into an intervention pair in which they were likely to work well. The method used was based on Peer-Assisted Learning Strategies (PALS), a well-supported peer tutoring
intervention that uses structured activities, frequent interaction, and feedback during learning (Fuchs et al., 2001b). A multiple-baseline-across-participants design showed that the effects on the children‟s disruptive behaviour were mixed: two children showed a downward trend in the number of disruptive behaviours per minute, while the data of the other two was largely stable. Overall, active responding increased during the intervention phase across all
33 more words read correctly per minute each week – a “typical” rate of reading progress (Deno, Fuchs, Marston & Shin, 2001). All four participants exceeded this goal, but follow-up data revealed that the effects were not maintained. Three out of four of the children‟s error rate trends decreased during the intervention phase. Overall, the intervention showed that active responding and reading fluency can be increased, and disruptive behaviour decreased, in students with EBD, using a peer-tutoring method. However, the authors suggest that in order for the gains to be maintained, the intervention needs to remain in place in the classroom.
Spencer, Scruggs and Mastropieri (2003) investigated peer tutoring and traditional instruction methods to teach social studies to 30 children with EBD in a North American middle school. A crossover design was used, where peer tutoring, using explicit strategy instruction, was used for two weeks, and alternated with traditional teaching methods for two weeks, to teach material in the school‟s social studies textbook. In this way, each student served as their own control. The peer tutoring methods used included rules, how to identify and correct errors, and checklists for self-monitoring. The traditional teaching methods included teacher-led discussions, round-robin reading and videos. Outcomes were measured using pre- and post-chapter tests, quizzes, and children‟s use of summarisation skills. Observational methods were used to provide data about on-task behaviour. Before the peer tutoring condition was implemented, two lessons were used for the class teacher to teach the children the procedures. Dyads were grouped according to reading ability and teachers‟ judgement – and altered if pairings proved unsuitable. Results on all quantitative measures showed improved scores during the peer tutoring condition. Weekly quiz scores and multiple choice scores were higher, as was the average time spent on-task in each lesson. The students and teachers also reported higher levels of satisfaction and enjoyment during the peer tutoring condition. The authors report that peer tutoring is a “powerful” tool for improving
34 key features of the success of peer tutoring, especially when working with children with EBD, are making sure that the dyadic pairs are suitable and providing sufficiently close monitoring of interactions during the lessons.
Overall, peer tutoring when used with children with antisocial behaviour in the school setting appears to be an effective teaching method (Gardner et al., 2001; Spencer, 2006; Spencer et al., 2003; Sutherland & Snyder, 2007). However, a couple of issues are apparent. Firstly, the pairs or groups used must be chosen carefully, as problematic relationships
between children who are supposed to be helping each other will lead to less work being done and more disruptive classroom incidents. For children with EBD, this can be especially difficult due to their less-developed social skills. Secondly, long-term benefits of peer tutoring in the classroom are unclear: both studies reviewed here showed increased rates of learning during the peer tutoring intervention phase, but this ended after two or four weeks. Sutherland & Snyder‟s (2007) work showed that the gains were not maintained, while Spencer and her colleagues‟ (2003) design did not allow for follow-up data to be gathered. Perhaps the highly-structured nature of effective peer tutoring strategies reviewed here lends itself to short-term teaching bursts of specified information rather than ongoing, open-ended progress in wider academic domains.
Summary and Statement of Research Objectives
35 around 120 words per minute, and the average decoding fluency is around 60-70 correct graphemes per minute.
Children who learn to read along a typical developmental trajectory acquire these component skills as a matter of course in their early years at primary school. However, some children fail to acquire one or more of these component skills and thus do not learn to read in a timely fashion. Neurodevelopmental differences in brain structure may account for some of these children‟s problems, and provide support for the argument that effective remediation of reading delay at an early age is vital. In fact, the development of the affected neural areas is improved by evidence-based reading interventions.
A lack of learning opportunities may also account for the variation in rates of learning to read. Hart and Risley‟s (2003) recordings of the differences in verbal interactions for very young children based on social class highlights the massive cumulative effects of an ongoing social disadvantage. Reading progress is likewise positively correlated with the number of learning opportunities a child receives on a daily basis: The Matthew Effect in reading is clear.
Data from the annual Reading Recovery report suggest that the programme is
successful at remediating the reading of up to about 83% of referred children. Recovery for the children for whom the programme does not succeed, however, is unlikely. The PIRLS report revealed that 5% of Year 5 girls and 11% of Year 5 boys did not reach the Low
International Benchmark for reading in 2005/2006 (Chamberlain, 2006). Reading Recovery‟s
36 Church and his colleagues (2005) trialled an intervention targeting the component skill of decoding fluency in 8- to 9- year old children with reading delay. Williams (2002) had found that the main feature distinguishing normal-progress readers from low-progress readers was their low score on a decoding fluency test. The decoding fluency intervention produced significant gains in decoding fluency and this generalised to improved prose reading fluency in nine out of 10 of the participating children. The intervention proved to be feasible and effective in a mainstream classroom setting.
Reading delay is one of the most common childhood disorders, and antisocial behaviour is another; the large overlap between the two is also well-known. Antisocial behaviour begins to develop in children from a very young age, often before they arrive at school. Research shows that aversive interactions between family members of a child with antisocial behaviour occur at much higher rates than in families of typically-developing children. On entry to school, the social environment responds to antisocial behaviour in ways which often function to reinforce this behaviour. This makes it less likely that the child will learn prosocial behaviours such as sustained attention to classroom tasks with the result that academic development is also delayed.
The relationship between antisocial behaviour and reading delay is not yet entirely clear: there are many variables, changing over time and context and influencing the development of both. It appears that reading delay and antisocial behaviour in children
develop from a number of environmental factors that are interacting with each other, the child and the responses of teachers and parents.
37 It is essential to provide effective interventions for children with co-morbid reading problems and antisocial behaviour. Both problems have a high prevalence and the
combination of the two places a child on a trajectory with poor outcomes both for that child and for society as a whole. At this stage, programmes such as Reading Recovery are not meeting the learning needs of a significant proportion of children in New Zealand/Aotearoa. It is possible to identify the strengths and weaknesses of children with reading delay – whether it is letter-naming, phonemic awareness, decoding skills, decoding fluency, a sight word vocabulary of sufficient size and/or oral fluency. Church and his colleagues (2005) implemented an intervention that effectively remediated the reading of older children whose decoding fluency was lower than that of their same-age peers. Given that children with behaviour problems are more likely to have reading delay than typically developing children, it is important to trial interventions that will address their academic needs. Therefore, the present study aims to replicate the findings of Church et al., using the same methods, in a group of children with persistent behaviour problems. However, children with behaviour problems can be more difficult than their typically-developing peers to engage in an intervention that aims to accelerate academic achievement. Any work with children with elevated rates of antisocial behaviour must take into account that they may be more difficult to manage than children with reading delay only. Thus, the intervention must be designed so as to manage inappropriate behaviour while also maintaining motivation. Therefore, the aims of the present research were twofold:
38 Fluency Test (Williams, 2002), and (c) a teacher report that the child had persistent behaviour problems.
39
Chapter 2
Method
Experimental Design
The present research took the form of a single case generalisation experiment in which the effects of training decoding fluency were measured on both decoding fluency and reading fluency. The experiment was replicated across six primary school students with persistent behaviour problems.
Participants
One Decile 2 primary school in Christchurch was approached and asked if they were interested in participating in the proposed research. After indicating they were, preliminary discussions indicated that the school had sufficient numbers of children with both difficulties in both reading and behaviour, so no further schools needed to be approached. In order to maintain the feasibility of the study, only one school was approached. The school‟s most recent Education Review Office report indicated that the ethnic composition of the school included around 50% who identified as Pakeha/New Zealand European, and about 40% who identified as Maori or Pacific Islanders.
Recruitment of teachers
40 and that the intervention group would take up half of this time. Secondly, they thought that the children with behaviour problems would not cooperate with the initial baseline testing procedures because they would “take one look” at the texts and decide that they were too hard. Thirdly, they felt that the children‟s self-esteem would suffer from finding the testing procedures too difficult. Fourthly, they were concerned that the children‟s behaviour would be unsettled when they returned to class after the group, and that they would then have to spend time re-settling the children instead of teaching. Fifthly, these teachers believed that running records on unseen materials were poor practice as an assessment method, and would be too daunting for children who were already aware of their reading problems. Lastly, the teachers expressed the view that the researcher would be unpractised in conducting Running Records, and would do a poor job.
Each concern was discussed and addressed as far as it could be. The researcher‟s
Curriculum Vitae was sent to the syndicate leader to provide her with some information about background experience in the management of children with severe behaviour difficulties. It was explained that the test results found by the research would not be used in the school‟s reporting, so any methodological flaws would not affect their own educational data. Finally, they were reminded that if at any point they were dissatisfied with the way the research was being conducted, they could withdraw their consent and the intervention would be
abandoned. After consideration, all four teachers gave their informed consent to the project.
41 Recruitment of participants
The information sheet for the parents of the target children explained that their child had been selected for a reading programme for children who have good phonetic skills but who are still reading slowly, and who have behavioural difficulties. Everyday language was used to explain what the intervention would involve and how long it would take. It was made clear that their child‟s reading would be tested a number of times during the intervention, and an offer to explain the procedures in more detail was made.
Verbal consent from participating children was obtained during the baseline testing phase, and then formal consent was given on the first day of meeting together as a group for the intervention itself. Although information sheets and consent forms were given to the children, the researcher read them aloud, and had a discussion about what it meant in
language that the children understood. They were encouraged to ask questions if they did not understand. Participants and peer tutors gave consent together, and their roles, as well as what to expect during the reading group, were explained fully. It was reiterated a number of times to the children at this stage, and later during the intervention, that they could withdraw their consent.
Children were selected into this study if:
(a) They scored more than 35 out of 60 on the Phonemic Segmentation Test described below,
(b) They scored less than 60 correct responses per minute on the Decoding Fluency Test described below,
42 (d) They scored at or below 106 on the Canterbury Social Development Scale (CSDS) for Year 1 to 4 students.
Eleven students were tested, and ten met inclusion criteria. All students were given two stickers and a reward for participating in the testing, which took approximately 30 minutes. One included child was one point above the cut-off score for behaviour problems. Consent forms and information sheets were sent to the parents of all ten children. Parental consent was initially obtained from the parents of four children (Group 1), so a group was started with these participants towards the end of August 2010. During this time, a further three consents were obtained, and a second group (Group 2) began once the first had finished, in October 2010.
Ethical approval for the research was obtained from the University of Canterbury Educational Research Human Ethics Committee in May 2010. An information sheet and consent form was given to the school‟s principal, deputy principal, relevant teachers, parents of the peer tutors, parents of the target children, as well as the potential participants and potential peer tutors themselves. These information sheets are reproduced in Appendix 1. The information sheet for the teachers described the purpose of the project, the activities involved, the time frames that were expected, and what would happen if a reading pair failed to develop a positive working relationship. Each information sheet included two footnotes, one stating that the research had obtained ethical approval, and one giving the contact details for the Chair of the Educational Research Human Ethics Committee, in case of complaint.
43 master list that identified participants was kept in a locked safe at the University of
[image:43.595.80.561.172.535.2]Canterbury.
Table 3: Demographic characteristics and pre-test scores for the seven participants
Eth- nic-ity* Gen-der Year/ Class Age Y:Mo Phon-emic Segment-ation (Correct Sounds/ 60) Decoding Fluency (Correct responses/ min) Neale Accura cy (read-ing age) Neale Compre-hension (reading age) Neale Rate (read-ing age) CSDS
Sophie P F 4/2 8:4 59 24.5 6.9 7.1 7.0 107
Isaiah M M 3/1 7:11 48 19.5 6.0 <6* 6.8 77
Emily P F 3/1 7:11 45 18 6.0 <6* 6.3 64
Jesse P M 3/2 7:8 38 8.5 <6* 6.2 <6* 95
Josh P M 4/3 8:3 53 19.5 6.5 6.11 6.11 105
Jamal P.I M 3/1 7:3 49 8 <6* <6* <6* 67
Randall P M 4/3 8:9 42 32 6.7 6.5 7.3 74
*P=Pakeha, M=Maori, PI=Pacific Islander
44 progress, he no longer met the criteria for the intervention, so he was returned to the
classroom and was excluded from the study.
The Canterbury Social Development Scale reproduced in Appendix 4 asked teachers for any information they were aware of regarding pupils‟ mental health diagnoses and whether they receive any extra educational funding. A summary of the information provided is given in Table 4.
Table 4: Teacher-reported additional information
Name Information reported, if any
Jamal English a second language. Receives ESOL tutoring. Currently receives RTLB assistance.
Emily Currently receives RTLB assistance.
Josh No issues reported.
Randall No issues reported.
Isaiah Has received RTLB assistance in the past but not currently.
Sophie No issues reported.
Jesse Currently receives RTLB assistance. Diagnoses include Dyslexia and Dyspraxia. On medication for Attention Deficit/Hyperactivity Disorder
Recruitment of peer tutors
45 explaining that their child would participate as a peer tutor and no data would be gathered about their child. All children who were nominated by their teachers as peer tutors returned their consent forms signed by parents.
Setting
The intervention setting agreed to by the deputy principal was an unused classroom. For the first group, consisting of Emily, Isaiah, Sophie and Jesse, and their peer tutors, this was changed a number of times from Session 1 to Session 5 because the assigned room was sometimes booked by other groups. On these occasions the school library was used. From Session 6 onwards, the group met consistently in a back room off a teaching block. This room was adequately lit and ventilated, and was furnished with two tables and four chairs.
Pre-test, post-test and follow up testing were all conducted in one of two small offices off the classrooms. The rooms were adequately lit and ventilated, but there was considerable classroom noise during testing, and occasional interruptions from children or teachers needing to come through the rooms. All testing was conducted in the mornings.
Measurement Procedures
Neale Analysis of Reading Ability
46 difficult for them (i.e. they make more than 16 errors on test levels 1-5 and more than 20 errors on text level 6). Scores are derived from the passages which have been successfully read, according to norms for each year of schooling. The Neale was chosen because the norms are based on an Australian sample and this was deemed to be more similar to an Aotearoa/New Zealand context than any other measure. It is also reasonably fast to
administer (about twenty minutes), and has adequate reliability and validity (Neale, 1999). It provides percentile ranks, stanine scores, and reading age equivalents for reading accuracy, reading rate (fluency) and comprehension.
The Neale is scored in three parts. Firstly, the number of errors for each text level read is counted and then subtracted from a total of 16 for each level passed up until level 6. For the text level 6, the number of errors is subtracted from 20. These remaining numbers are added together to give a raw score for accuracy. Secondly, the numbers of correctly answered comprehension questions for each text level are added together, giving a raw comprehension score. The comprehension questions are only asked if the child has passed the text level. Thirdly, each text level is timed by the tester, and the time recorded in seconds for each passage. These are added together to give the total time. The words from each passage that the child has passed are added together to give a total number of words read. The total number of words read is divided by the total number of seconds and the answer is multiplied by 60, giving a raw reading rate score. Raw scores are looked up in the norm tables at the back of the Neale manual, which provide reading ages, percentiles and stanine scores for each year of schooling from year 1 to year 8.
47 The Neale was also used to track the participants‟ progress from pre-intervention to post-intervention. Form 1 of the Neale was administered to all the participants in June 2010. Form 2 was administered to Group 1 at the end of October 2010, and to Group 2 in December 2010. Scores from this provided pre- and post-intervention measures of reading accuracy, reading comprehension and reading rate for all participants.
Phonemic Segmentation Test
The Williams‟ Phonemic Segmentation Test (Williams, 2002) was administered pre- treatment only. This test is reproduced in Appendix 2. It was devised to measure phonemic awareness in children, and is based on the Queensland Inventory of Literacy (Dodd, Holm, Oerlemans & McCormick, 1996). In the present project this was used as a screening test to ensure that all children had acquired sufficient phonemic awareness to profit from the proposed intervention. This test was administered as follows. After the procedures were explained to and practised by the child, 16 words (consisting of nine real words and seven pseudo-words) were said aloud to the child. After each one the child was asked to break the word into its component sounds. For example, the word “big” becomes “b – i – g”. Each word was scored by counting the number of spoken sounds correctly identified (with 60 being the highest score possible). The cut-off point was set at 35 because Church et al. (2005) found that a participant who scored below this did not benefit from the proposed intervention, and in hindsight should not have been included.
Decoding Fluency Test
48 time it was administered, children were given practice with a list of ten words until they understood what they were to do. They were asked to read the words as quickly as they could for two minutes, when the tester told them to stop. If they came to a word they did not know, they were to just say “don‟t know” and proceed to the next item. The children were instructed to read the words in order, and if they read through the whole 90 words in less than two minutes, the time taken was recorded and the correct graphemes-per-minute score was calculated. Because it was regularly administered throughout the intervention, children were asked to start on a different line each time to minimise practice effects. The Decoding
Fluency Test was administered approximately twice weekly during the intervention, after the day‟s practice session. For the first group of children (Emily, Isaiah, Sophie and Jesse), this test was administered irregularly for the first two weeks of the intervention, due to difficulties negotiating suitable times and venues.
Running Record of Oral Reading
A simplified version of the Running Record of Oral Reading (New Zealand Ministry of Education, 2000; Blaiklock, 2004) was administered regularly during the treatment, as well as at follow-up. The form used for the present investigation asked the child to read a passage that they had not seen before at a level which they could read with 90-95% accuracy. To calculate both reading fluency and reading accuracy, these Running Records were timed for two minutes, and each error was recorded. For the present investigation, errors were
49 children could read his text with at least 90% accuracy. The researcher then lowered the levels until an appropriate level for each child was found, and books were used at this level for the remainder of the running record measures. Many of the books at the lower levels were short enough to be read in one or two two-minute reading tests, and many of the books at these levels had been read before by the children, so a large number at each required level were obtained from the University of Canterbury Education Library. Even within one level, however, the text difficulty varied considerably.
The Social Development Scale
The Social Development Scale (Church, Tyler-Merrick & Hayward, 2006) was administered pre-intervention. This is reproduced in Appendix 4. This provided an independent measure, aside from the teacher‟s referral, of each child‟s behavioural
difficulties. Although behaviour problems exist on a continuum, a cut-point of 106 was used to distinguish children with antisocial development from those with typical development. The SDS was completed by the child‟s classroom teacher. This screening measure was chosen because it was developed for the use of teachers in New Zealand classrooms, it has positive items as well as negative items and it only takes about ten minutes to complete (Church et al., 2006).
Teaching Materials and Procedures
Teaching materials
50 initial position. Each of 18 targeted vowels and diphthongs were present in at least two words in the middle position. Many of the targeted consonant graphemes also occurred in the
terminal position. The words were limited to one syllable, with the exception of “video”. All words were high frequency words. The stimulus set consisted of the four word lists described above (A1, A2, B1 and B2), four reading racetracks, one to match each list, and two decks of SNAP! cards. One deck of SNAP! cards (Set A) contained the words from lists A1 and A2, and the other (Set B) consisted of the words from B1 and B2.
Teaching activities
There were three practice activities. Each pair had a “kit” that contained the practice materials, which were all on laminated white paper and came in a zip lock bag with a stopwatch. The first activity was reading from flashcards, where the participant read each word either silently or aloud from a deck of 15 cards. A sample of these is reproduced in Appendix 6. All children chose to do this activity with their peer tutor either just watching, or watching and timing them. The second activity was a „reading racetrack‟, where the target words were written on a „racetrack‟ card. This is reproduced in Appendix 7. The participants read each word aloud until they completed the circuit, and this was timed by the peer with a stopwatch. The aim was to reduce the time to get around the whole circuit. The third activity was the game „SNAP!‟ played in the conventional way, except that instead of matching words, the players were taught to identify the matching sound in the two words in order to pick up the pile (e.g. snapping “fly” and “prize” was allowable because both words contain the long “i” sound).
51 timed the peer tutor on reading the words. These measures were not used as data, but merely to indicate to the researcher when the participant might be ready to move on to the next practice list (i.e. reading the list in <15 seconds). During the practice sessions, participants and peer tutors were instructed to approach the researcher if the participant could read the list he or she was working on in less than 15 seconds. The researcher then checked the time of the te