Access to Finance and Growth: Evidence from
Dutch SMEs
Author: Julia Goldhausen
University of Twente P.O. Box 217, 7500AE Enschede
The Netherlands
ABSTRACT,
This paper studies the impact of access to finance on firm growth for Dutch small
and medium-sized enterprises (SMEs) from 2008 – 2015 in terms of a panel study.
Based on a sample of 2,680 SMEs, evidence is found that access to finance is a
major growth restraint during the financial crisis and the years afterwards. SMEs
were able to grow during the period of crisis (2008 – 2011) but this growth is
nonexistent in the post-crisis period (2012 – 2015). Internal financing is available
during both periods, however, bank financing is not readily available throughout
the time of investigation. Anyhow, trade credit is also used by Dutch SMEs to
finance growth. Eventually, it can be concluded that Dutch SMEs are financed
according to the pecking order theory during the period of crisis and post-crisis.
Graduation Committee members:
Dr. S.M. Zubair, Dr. X. Huang, Prof. dr. R. Kabir, Dr. ing. H.C. van Beusichem and
Dr. S.A.G. Essa
Keywords
SMEs, the Netherlands, firm growth, financial crisis, access to finance, pecking-order theory
Permission to make digital or hard copies of all or part of this work for personal or classroom use is granted without fee provided that copies are not made or distributed for profit or commercial advantage and that copies bear this notice and the full citation on the first page. To copy otherwise, or republish, to post on servers or to redistribute to lists, requires prior specific permission and/or a fee.
9th IBA Bachelor Thesis Conference, July 5th, 2017, Enschede, The Netherlands.
2
1.
INTRODUCTION
Small and medium-sized enterprises (hereafter referred to as SMEs) are very important for any economy. Across the European Union 99.8% of all companies are classified as SMEs (Muller et al., 2016). This is also the case in the Netherlands where 99.8% of all companies are SMEs (Eurostat, 2012). Furthermore, these enterprises account for 66.8% of employment in the European Union (Muller et al., 2016). Additionally, the majority of newly created jobs within an economy become available due to growth of existing firms and not by the establishment of new ones (Davidsson, Achtenhagen & Naldi, 2006). Consequently, SMEs are first of all important job generators and these firms are also seen as crucial innovators (Muller et al., 2016). Therefore, those corporations are essential to study and their growth is desired from a societal point of view in order to stimulate the economy. SMEs are financially constrained (i.e. they do not obtain the capital they desire) (de la Torre, Martínez Pería & Schmukler, 2010). Additionally, they are highly dependent on bank finance (Beck, Demirgüc-Kunt & Maksimovic, 2005). Consequently, when there is a negative effect on the bank sector, ultimately SMEs are negatively affected, too. This is also the case during the last financial crisis. The recent global financial crisis commenced in 2007 and the causes for this recession are manifold. These include, for instance, defaulting mortgages and the housing boom (Acharya & Richardson, 2009). As many of the sub-prime loans of assets were offloaded on European banks, Europe was also hit by the crisis in autumn 2008 (Barrell & Davis, 2008). SMEs are generally affected first by a financial crisis due to their financial restrictions. Reasons for SMEs being financially constrained include that SMEs have less access to external finance compared to larger firms (Beck, Demirgüc-Kunt & Maksimovic, 2008), therefore, growth has to be financed mostly internally (Berger & Udell, 1998). Retained earnings are considered the most important internal financing source for SMEs. However, in order to finance growth, debt is often needed as not enough funds are available to finance growth only internally (Degryse, de Goeij & Kappert, 2012). Additionally, in contrasts to other countries, bank financing is seen as the most important financing source for Dutch SMEs (Degryse, de Goeij & Kappert, 2012). As small businesses are usually owner-managed, these companies often do not have a diversified management and they have undiversified portfolios. Additionally, SMEs do not have access to the public market and they lack a basis for valuation of their shares. Hence, it is more risky for outside investors to invest in these enterprises (Ang, 1991). Furthermore, in times of financial crises accessing or renewing bank debt becomes even more difficult (Kestens, van Cauwenberge & Bauwhede, 2012). Also, internally generated funds decrease due to lower consumer spending (Zubair, 2015). Thus, SMEs become more financially restricted during the times of crisis.
Recently the amount of literature on SME growth is steadily enlarging (Davidsson, Achtenhagen & Naldi, 2006). However, most papers do not account for times of crisis (Chittenden, Hall & Hutchinson, 1996; Evans, 1987; Heshmati, 2001) and only a few do (for instance Peric & Vitezic, 2016). Nevertheless, the recent financial crisis is a worthwhile topic to study. A tremendous amount of studies is conducted on the causes of the recent financial crisis as well as on its effects for firms (among others Campello, Graham & Harvey, 2010; Carbó-Valverde, Rodríguez-Fernández & Udell, 2016; Tsuruta, 2015). Additionally, according to Treur and van de Hei (2016) Dutch SMEs find it hard to meet the credit terms of bank loans since the beginning of the crisis, therefore, owners search for other forms of finance.
Thus the question remains if access to finance is a growth restraint during the financial crisis and the post-crisis period or if SMEs are able to use an alternative financing source to finance their growth. Hence, the impact of the recent financial crisis on SME growth can be considered an interesting factor to study and therefore, the key motivation to conduct this research is to provide evidence for Dutch SMEs and to close this research gap. The main research question to be answered is the following: Does access to finance impact SME growth in the Netherlands during the financial crisis of 2008 and the years afterwards?
Albeit, this research deviates from previous studies in several ways. Surveys are frequently used for the data collection process in previous growth researches (Beck, Demirgüc-Kunt & Maksimovic, 2005; Gambini & Zazzaro, 2013) whereas financial data from Reach is used for this study. Additionally, only private SMEs from the Netherlands are under investigation as firm growth among private and public firms may be different (Honjo & Harada, 2006). Furthermore, financial data on the recent financial crisis and the years afterwards is only now becoming available as companies are recovering from it. Therefore, new evidence is needed to close this research gap.
The contribution to the literature is closely aligned to the motivation behind this study. To provide evidence in terms of a comparison among the period of crisis and post-crisis for Dutch SMEs, thus for a new time period as well as for a new setting. Furthermore, given the great amount of SMEs compared to large firms these are especially important to foster economic recovery from a financial crisis (Rossi et al, 2016). Therefore, providing evidence whether access to finance is a major growth restraint for Dutch SMEs or not is an important contribution in order to stimulate the economy, for instance by introducing policies. To answer the research question, the focus of this thesis is on Dutch SMEs. The goal is to gain insight on which financing sources SMEs in the Netherlands were able to access during the financial crisis and the years afterwards to finance their growth which to the best of my knowledge has not been done in terms of a comparison among these two periods for Dutch SMEs before. As the gross domestic product (GDP) of the Netherlands is fluctuating heavily from 2008 until the beginning of 2012, the end of the crisis is set to the end of the year 2011 for the Netherlands. From 2012 onwards, the GDP line is generally facing upwards although some fluctuations are still visible (Trading Economics, 2017). Therefore, a panel study is conducted in which four years of crisis and four years of post-crisis are investigated.
The results show that Dutch SMEs were able to grow during the time of crisis, however, this growth declines in the after crisis period. Additionally, internal financing is the most important financing source for both periods. Bank financing is still not readily available in the post-crisis period although it is the most important financing source for Dutch SMEs. Furthermore, trade credit is also used to finance growth. Therefore, the evidence shows that Dutch SMEs are financed according to the pecking order theory and that access to finance indeed is a major growth restraint for these companies.
2.
THEORETICAL FRAMEWORK
2.1
Finance and growth nexus
3 possibility to grow (Davidsson, Achtenhagen & Naldi, 2006).
Davidsson and Delmar (1997) distinguish among organic growth and growth achieved through acquisitions. Organic growth is accomplished by an increase of capacity over time (i.e. created internally by the firm) (Rahaman, 2011). Small firms grow mostly organically, whereas larger firms accomplish growth through acquiring other firms (Davidsson & Delmar, 1997). Nevertheless, growth can have desirable as well as undesirable outcomes. Undesirable outcomes include that owners conclude their firms’ being less likely to be able to go through a crisis when growing (Davidsson, Achtenhagen & Naldi, 2006). Additionally, they are concerned about the well-being of their employees since the family based relationship among owners and workers may suffer when their enterprise is enlarged (Wiklund, Davidsson & Delmar, 2003).
To get a better understating of the terms internal and external financing, these concepts are briefly described.
Internal financing can be classified as all financing gained from within a business. It is generated by retained earnings, sales of existing assets or a cut down in stock levels (Rossi et al., 2016). Retained earnings are part of profits generated through operating the business which are not paid out as dividends to shareholders (Brealey, Myers & Allen, 2011). However, as internal financing resources are restricted, also external financing is needed to foster growth (Rossi et al., 2016).
External financing on the other hand can be described as financing obtained from sources outside the business, thus third parties. Relevant external financing sources for this paper are only debt forms, more precisely bank loans as well as trade credit. However, also other forms of external financing exist, these include for instance equity options in terms of shares (Rossi et al., 2016).
Trade credit can be explained by suppliers granting their buyers a later payment of already delivered goods (Cuñat, 2007). Companies can thus act as receivers and suppliers of trade credit. In case of the former trade credit is mentioned as trades payable on the balance sheet of the receiver. The buyer is unable to pay for the goods when these are delivered. Therefore, they will be paid at some time in the future. For the latter trade credit serves as trades receivable on the balance sheet. The supplier will therefore, receive the payment of the handed over products at some point in the future. It is also possible that this concept continues like a chain until the final buyer of the product pays and the money is then transferred up the chain. Furthermore, the availability of trade credit depends on the supplier being able to allow trade credit to their customers or not (Petersen & Rajan, 1997).
Being granted trade credit may be important to assure that production costs can be financed and on the other hand customers may be unable to buy products once they are not being approved trade credit due to their financial constraints (Ferrando & Mulier, 2013).
Although a higher perceived risk for the supplier, trade credit is still allowed to customers as the risk of the buyer being unable to repay may be outweighed by the benefits of long-term business relationships and potential future revenue streams from this (Petersen & Rajan, 1997).
2.2
Financing theory of firms
The pecking order theory was initiated by Donaldson (1961) and further extended by Myers (1984) and Myers and Majluf (1984). It hierarchically orders the financing structure of firms. On the one hand costs of information asymmetries are important to consider and on the other hand the involved risk. Asymmetric information can be explained by managers or owners of a
company knowing more about, for example the firm’s health, than outside investors do. Thus they have insider information. Therefore, internal financing is the preferred financing source as asymmetric information does not exist and the involved risk is low due to the fact that retained earnings are used and no third parties are involved (Myers, 1984).
In case of the need of external funding, debt is chosen over equity, resulting in preferring short-term debt over long-term debt. The involved risk for issuing equity is far greater than the one for debt. This can be explained by the fact that once insider information becomes public the future value of securities changes. However, the value of equity changes more than the one for debt. For debt financing, short-term debt is less risky than long-term debt given the amount of time in the future the liability is due. For equity, however, new stock issues can be undervalued due to asymmetric information. Therefore, issuing new equity is more risky than debt financing and thus less preferred. Given the riskiness of equity, the premium asked is also higher and therefore, equity financing is costlier than debt financing (Myers & Majluf, 1984).
Trade credit can also be used as a form of external financing. However, due to the fact of high interest costs it is usually seen as an undesired form of financing, begin low in the pecking order theory (Petersen & Rajan, 1997). High interest costs are asked due to insurance and default premiums. Insurance premium is the compensation the supplier is granted as a protection against future liquidity problems of the buyer. Whereas default premiums are asked to account for the additional risk of future inability of payment by the customer. Therefore, the risk of the supplier of trade credit is higher than the one for internal or debt financing, as they grant credit to companies banks are unwilling to lend money to (Cuñat, 2007). However, information asymmetry may be lower due to the fact that suppliers often have more information about their customers than banks do (Petersen & Rajan, 1997; Rodriguez-Rodriguez, 2006). Additionally, once the receiver of trade credit is unable to pay the supplier back, the latter being active in a related business field has enough experience to sell the products to other customers (Mian & Smith, 1992). Therefore, they are better able to access the involved risk in grating credit than outside investors.
According to Degryse, de Goeij and Kappert (2012) Dutch SMEs are financed according to the pecking order theory before the financial crisis. This is also confirmed by Ang (1991) who concludes that the pecking order theory is important for small enterprises. It is, thus, interesting to analyse whether the pecking order theory holds for Dutch SMEs during the financial crisis or if trade credit can serve as an alternative source of financing given the potential constraints in accessing debt financing. Another financial theory is the static trade-off theory as explained by Modigliani and Miller (1963). This theory is concerned about a firm’s optimal debt ratio which is a trade-off among additional costs associated of borrowing and tax benefits. Costs include adjusting the current debt ratio to the optimal one whereas benefits are achieved through tax shields as interest is tax deductible (Myers, 1984). The optimal debt ratio is thus achieved once the tax benefits are equal to the associated perceived financial distress (López-Gracia & Sogorb-Mira, 2008). However, it may be unfeasible for SMEs to achieve the target debt ratio as banks may be reluctant to lend money to enterprises during the financial crisis. Additionally, small firms may face high transaction costs and rely on a lower than optimal debt ratio (López-Gracia & Sogorb-Mira, 2008).
4 to the optimal debt ratio slower than larger firms (López-Gracia
& Sogorb-Mira, 2008).
2.3
Firm growth
In a classical study Gibrat (1931) investigates the impact of size on company growth and concludes that these two variables are independent of each other. Therefore, every firm regardless of its size is able to grow at the same rate. Although some studies have confirmed Gibrat’s law there are also researchers who rejected this law. Huynh and Petrunia (2010), for instance, point out that there is a negative relationship between firm size and growth, additionally, younger firms grow at a faster rate and firm growth and leverage are positive correlated. This is also confirmed by Becchetti and Trovato (2002) who further research Gibrat’s law and emphasise that small firms tend to grow more than larger ones. However, this growth potential might be limited by the unavailability of external financing.
Evans (1987) also shows that firm growth is related to the age of the firm. Younger firms tend to grow at a faster rate than their older counterparts. Navaretti, Castellani and Pieri (2014) reason based on a sample of French, Spanish and Italian manufacturing firms that besides age also financial factors as access to finance, productivity and firm characteristics like CEO age as well as the qualification of the labour force do have an impact on firm growth. Furthermore, differences are also visible between industries (Degryse, de Goeij & Kappert, 2012).
2.3.1
Access to finance and firm growth
A lot of research is conducted about access to finance (among others Carpenter & Petersen, 2002; Honjo & Harada, 2006; Rahaman, 2011) and generally, the results point out that access to finance is one of the major restraints of firm growth. Furthermore, accessing external financing is even harder during a financial crisis (Kestens, van Cauwenberge & Bauwhede, 2012).
Although Chittenden, Hall and Hutchinson (1996) do not find evidence that growth directly influences the financial structure of a firm, they emphasise that the combination of fast growth and restricted access to finance does. Based on an analysis of UK public and private companies in which they investigate firm’s profitability, asset structure, age, size as well as access to the capital market, these variables do have an influence on the financial structure of SMEs.
Carpenter and Petersen (2002) maintain that internal financing does constrain firm growth especially given the fact that small firms tend to use little external financing. Additionally, companies using external financing sources are better able to grow, thus only using internal financing can be considered a major growth restraint (Carpenter & Petersen, 2002). Honjo and Harada (2006) further confirm these results when investigating the impact of SME policies as well as the financial structure of firms on SME growth. They infer that internal finance has an impact on growth as well. Furthermore, SMEs are constrained in raising external financing once they are already highly leveraged. Related to this, Beck and Demirguc-Kunt (2006) argue that access to finance is one of the main constraints for SME growth. They further conclude that especially policies are a useful tool to achieve greater access to finance for SMEs.
Rahaman (2011) investigates why some constrained firms are better able to grow than unconstrained ones. In his research, he concludes that access to internal financing does affect firm growth. Additionally, Rahaman (2011) highlights that access to internal financing can play a twin role. First it serves as a proxy for the internal financial capacity of a firm and it further provides signals about future growth potential of the enterprise to outsiders. Albeit, when gaining access to external funding, the
effect of internal financing decreases thus external financing is used as the primary financing source. However, this conclusion is a contradiction to the pecking order theory explained above. Especially during times of crisis, gaining financing is a challenging task for all companies. However, for SMEs, which are usually more restricted in gaining external financing, during a crisis this option is even more limited (Vermoesen, Deloof & Laveren, 2013).
Nonetheless, besides debt financing as an external form of financing also trade credit can serve as an alternative source of finance.
Some research is conducted on trade credit during the recent financial crisis. However, the results are twofold. On the one hand McGuiness and Hogan (2016) find evidence that trade credit plays a significant role in financing SMEs during the financial crisis in Ireland. Constrained SMEs receive more trade credit but were not able to grant trade credit to their buyers in terms of trades receivable. This is in line with results from Casey and O’Toole (2014) who also find evidence that trade credit among others can serve as an alternative to bank finance particularly for constrained firms, during a financial crisis. Carbó-Valverde, Rodríguez-Fernández and Udell (2016) who conduct a research based on Spanish SMEs remark that especially constrained firms, which SMEs usually are, use trade credit as a source of finance. Nonetheless, unconstrained firms do not rely on trade credit but use bank finance. Thus, their results are twofold, proving that some SMEs use trade credit whereas other do not.
Tsuruta (2015) comes to the conclusion that bank loans and trade credit are used complementary in times of crisis based on a dataset of small firms from Japan. Love and Zaidi (2010), however, reason that trade credit does not serve as a substitution for bank finance in times of crisis based on a study of four countries in East Asia. According to them bank finance is an important source to finance growth in times of crisis and trade credit cannot be used for this, as financially restricted firms tend to reduce trades payable during the crisis as well as trades receivable.
Therefore, the results whether trade credit can serve as a substitute or as a complementary to bank finance during a financial crisis are inconclusive. It is thus interesting to see whether the pecking order theory also holds during the financial crisis of 2008 in the Netherlands and if Dutch SMEs use trade credit as well as bank credit or rather rely on one source of financing.
2.4
Hypotheses development
To develop testable hypotheses, the above-mentioned literature, which analyses the effect of access to finance on firm growth was looked upon. In order to answer the research question the subsequent hypotheses are developed.
Consistent with the pecking order theory, internal financing is the preferred financing source of enterprises. Rahaman (2011) who researches the sources of financing used and compares small, medium as well as large firms, concludes that small firms use internal financing to grow. Carpenter and Petersen (2002) find out that the unavailability of internal financing is one of the main growth restraints for SMEs. Furthermore, internal financing can have a double role and gives an indication about future growth potential of a company to outsiders. Thus, if internal financing is available, the likelihood of being granted external financing also increases (Rahaman, 2011). Therefore, the first hypothesis is formulated as follows:
5 Internal financing and firm growth should therefore, have a
positive relationship. Once internal financing is available, this can be used as the cheapest source to finance growth during a crisis but also in non-crisis years.
Further following the pecking order theory, as a first source of external financing, as soon as internal financing is unavailable, debt is chosen. Additionally, according to the static trade-off theory, debt should be used to finance growth as tax benefits can be achieved. Moreover, Rahaman (2011) states that his results show once external financing becomes available for firms, internal financing has a smaller effect on firm growth. This demonstrates that firms do not only use internal financing but also external financing when growing. However, Becchetti and Trovato (2002) conclude that growth is limited by the unavailability of external financing. Also Honjo and Harada (2006) investigate a negative influence of leverage on firm growth, suggesting that leverage is not widely available. Leading to the second hypotheses:
H2: Bank finance and firm growth have a positive relationship. a: Bank finance and firm growth have a negative relationship during the financial crisis.
b: Bank finance and firm growth have a positive relationship during the post-crisis period.
As Dutch SMEs are bank financed, as well as following the pecking order and the static trade-off theory, a positive relationship is expected among bank financing and firm growth. However, as bank financing is not widely available during the times of crisis, a negative impact is anticipated for this period. For the post-crisis period, bank financing should be available and thus a positive impact is predicted.
As renewing or being granted debt financing may be difficult during the financial crisis, trade credit can serve as an alternative source of external financing (Vermoesen, Deloof & Laveren, 2013). McGuinness and Hogan (2016) argue that financially stronger firms are able to provide external financing in terms of trade credit to their customers as accounts payable. However, when looking at the pecking order theory as described above, this source of financing is usually seen as undesirable given the excessive costs. Nevertheless, in times of crisis it may be the only financing source available to finance growth. Casey and O’Toole (2014) also suggest that once firms are unable to receive bank credit, they turn to other forms of finance. Therefore, the next hypotheses to test are:
H3: Trade credit has a negative impact on firm growth. a: Trade credit has a positive impact on firm growth during the financial crisis.
b: Trade credit has a negative impact on firm growth during the post-crisis.
Therefore, trade credit is expected to have a positive impact on firm growth during the financial crisis as it may be the only financing source available. However, since it is undesirable from the perspective of the pecking order theory, a negative impact is predicted for the post-crisis period as well as for the overall time period.
3.
METHODOLOGY AND DATA
3.1
Data sample
In order to collect data on SMEs, the database Reach from Bureau van Dijk is used. Databases from Bureau van Dijk are
1 Micro enterprises have less than 10 employees and a balance
sheet total as well as a turnover of not more than €2 million (European Commission, 2017).
frequently used in financial research (Vanacker & Manigart, 2010; Vermoesen, Deloof & Laveren, 2013). The Reach database is especially used for SMEs in the Netherlands as it contains financial information of private as well as public Dutch SMEs. In order to arrive at a sample, the following filters are applied. Only SMEs with their office country in the Netherlands and with an unconsolidated statement are selected in Reach leading to an initial sample of 763,653 companies.
Additionally, SMEs in the non-profit sector as well as governmental ones are eliminated, since governmental regulations might influence these firms. Furthermore, only those being active in the non-financial sector are used in this research. Therefore, the US SIC codes are used. Financial firms, with a SIC code interval from 6000 – 6999 and those from 8000 – 9999 are excluded (Vermoesen, Deloof & Laveren, 2013). Listed companies are also filtered out as the focus is on private SMEs given the fact that publicly-held firms might be able to access external funds more easily (Honjo & Harada, 2006).
SMEs are defined based on the definition of the European Commission (2017) as companies with more than 10 employees and less than 250, a turnover range of more than €10,000,000 and less than €50,000,000 or a balance sheet total of more than €10,000,000 and not more than €43,000,000. Micro enterprises1
are excluded, given the fact that these companies do not provide much financial data and are out of the scope of this study. Furthermore, once either two of the three conditions of the definition of the European Commission (2017) are satisfied, the company is included in the sample. Additionally, the conditions can be fulfilled for any year but do not necessarily have to hold for each year as larger companies may become SMEs or SMEs grow to large firms.
Furthermore, given the fact that many SMEs do not report data for each measure, used in the research, for every year, the panel is made of companies reporting at least three figures for every variable over the whole collection period. The data collection period is from 2008 until 2015 to account for the entire time of the crisis of which the end is set to the end of 2011 as explained above, and four years of post-crisis.
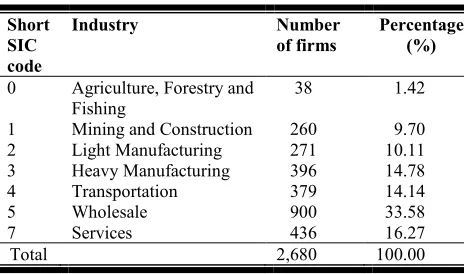
The total sample of SMEs for this research, after all filters have been applied consists of a panel of 2,680 diverse firms. Table 1 below presents the distribution of the sampled firms through different industries. The largest amount of SMEs is active in the Wholesale industry (33.58%), whereas only 1.42% of the companies is in the Agriculture, Forestry and Fishing industry. The number of firms in the Mining and Construction (9.7%), Light Manufacturing (10.11%), Heavy Manufacturing (14.78%), Transportation (14.14%) and Service (16.27%) industry is relatively similar.
3.2
Variable definition
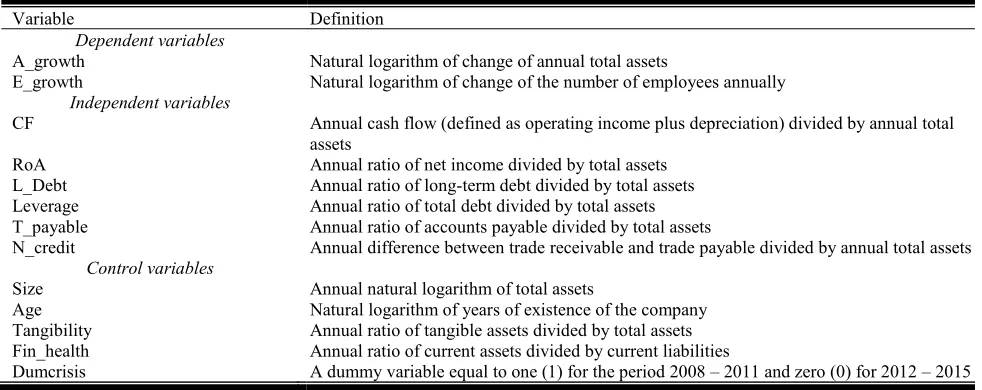
To account for growth, all variables are lagged one year behind to follow the approach of Rahaman (2011) as well as Honjo and Harada (2006). An overview of the definitions of the variables can be found in table 2 below.
3.2.1
Dependent variables
6 is especially important for manufacturing firms as these are
highly capitalised. However, this might in turn be unsuitable for service-oriented companies (Janssen, 2009).
Penrose (1959) distinguishes among two different types of growth. The first being an increase in volume and the second “an increase in size or improvement in quality as a result of a process of development” (Penrose, 1959, p. 1). Given the fact that this research is concerned with the former, common measures for this type of growth are for instance sales, assets and employment growth (Honjo & Harada, 2006; Becchetti & Trovato, 2002; Rahaman, 2011). Additionally, Davidsson, Achtenhagen and Naldi (2006) conclude that growth may have different sources, therefore it is advisable to use different definitions of this variable which is especially important for this research, as several different industries are investigated.
Following this explanation, two measures of growth, namely employment growth and growth in assets are used. Given the fact that sales are not as widely reported in the Reach database this measure is omitted.
Asset growth (A_growth) is measured as the increase or decrease of log(total assetsit) – log(total assetsit-1) (Gambini & Zazzaro,
2013; Honjo & Harada, 2006).
Employment growth (E_growth) is defined as log(number of employeesit) – log(number of employeesit-1) (Rahaman, 2011).
Therefore, the increase or decrease in the number of employees between period t and t-1 is measured.
3.2.2
Independent variables
Internal financing
As a first measure of internal financing cash flow is used. This is employed to account for the internal liquidity of the firm, to generate cash from sales. It is defined as operating income plus depreciation (López-Gracia & Sogorb-Mira, 2008). Given the fact of potential correlation between cash flow and other measures of size of the firm, for example employment, cash flow is divided by total assets (Molinari, Giannageli & Fagiolo, 2016). The cash flow ratio (CFit) is defined as cash flowit-1/total
assetsit-1 (Carpenter & Petersen, 2002; Honjo & Harada, 2006).
Another proxy to account for internal financing is performance (Rahaman, 2011). Although Bosworth and Kells (1998) conclude that economic profit is a better measure than performance, economic profit is very hard to measure. Therefore, return on Assets (RoA) is used as a measure of performance (net incomeit-1/total assetsit-1). Net income is defined as income after
tax (Rahaman, 2011).
External financing
In order to measure access to external finance, bank credit is used as a first variable. Following Sufi (2009) bank credit is considered a better measure of external financing constraints than
cash-flow. Given the fact that the value for current liabilities is not widely available in the Reach database, long-term debt is used. Furthermore, when taking the value for current liabilities in general, trade credit, which is a separate variable in this research is also included. To avoid this, following de Jong, Kabir and Nguyen (2008) long-term debt is used. Long-term debt (L_Debt) is defined as long-term debtit-1/total assetsit-1 which is a common
measure (Degryse, de Goeij & Kappert, 2012; McNamara, Murro & O’Donohoe, 2017).
Additionally, a measure for leverage (Leverage) is used which is the most common measure for capital structure. This is defined as total debtit-1/total assetsit-1 (Degryse, de Goeij & Kappert,
2012).
Furthermore, to account for trade credit, trades payable (T_payable) are measured. Commonly trade credit variables are measured as ratios, either accounts payable/firm sales or accounts payable/firm assets (Carpenter & Petersen, 2002; McGuiness & Hogan, 2016). However, given the fact that firm sales are not widely reported in Reach, only accounts payableit-1/total assetsit-1 is used.
As an alternative proxy, net trade credit (N_credit) is employed to research whether companies receiving trade credit also grant trade credit to customers. Net trade credit is defined as (accounts receivableit-1 – accounts payableit-1)/total assetsit-1 (Choi & Kim,
2005). Therefore, once this term becomes negative, the firm uses more trade credit than it grants to its customers.
3.2.3
Control variables
A number of control variables are adopted in the regression analysis to account for firm characteristics. Size (Size) is a very common measure in growth studies (Peric & Vitezic, 2016; Rahaman, 2011; Vanacker & Manigart, 2010). Nowadays, Gibrat’s law is mostly rejected and firm growth and size are not independent of each other (among others Becchetti & Trovato, 2002; Huynh & Petrunia, 2010). Size is thus seen as an heterogenic source in firm growth and is therefore, an important control variable (Rahaman, 2011). It is measured as log(total assetsit-1) (Rahaman, 2011).
Furthermore, age (Age) is also considered to have an influence on firm growth given the fact that older firms are supposed to grow slower (Evans, 1987). This is measured as log(years of existenceit-1) (Honjo & Harada, 2006; Ferrando & Mulier, 2013).
Another control variable to be used is tangibility (Tangibility), to account for the asset structure of the firm. Tangibility is calculated as tangible assetsit-1/total assetsit-1 (Degryse, de Goeij
& Kappert, 2012).
To clarify the financial health (Fin_health) of the firm, the current ratio defined as current assetsit-1/current liabilitiesit-1, is
employed (Rahaman, 2011).
To control for the effect of the crisis, a crisis dummy (Dumcrisis) is used which takes the value one (1) for the crisis period, thus the years 2008 – 2011 and zero (0) for the years 2012 – 2015, the post-crisis period.
3.3
Methodology
[image:6.595.60.292.88.225.2]Following the literature, a panel study is conducted (for example Honjo & Harada, 2006; Rahaman, 2011). Longitudinal studies are preferred for this sort of analysis (Davidsson, Achtenhagen & Naldi, 2006; McKelvie & Wiklund, 2010) since the same companies are investigated for the whole period of 2008 until 2015. This makes it possible to examine the changes taking place in access to finance on firm growth for the same companies over Table 1: Industry distribution
Short SIC code
Industry Number
of firms Percentage (%)
0 Agriculture, Forestry and
Fishing 38 1.42
1 Mining and Construction 260 9.70
2 Light Manufacturing 271 10.11
3 Heavy Manufacturing 396 14.78
4 Transportation 379 14.14
5 Wholesale 900 33.58
7 Services 436 16.27
7 the whole sampling period. As panel data allows to study the
adjustments of dynamics (Rodriguez-Rodriguez, 2006). Access to finance is the independent variable and firm growth is employed as the dependent variable. To investigate the relationship among these variables and several control variables, a multi-variate regression analysis is provided based on the data generated from the Reach database.
Following Rahaman (2011) the following growth model is to be used:
Yit = + Zit-1 + Xit-1 + Ɛit
Yit measures the growth of firm i during the period t-1. Zit-1
addresses the sources of financing the firm is able to access. Xit-1 accounts for firm control variables and Ɛ it is the error term
of the regression model.
In more detail, the overall model for this research looks like this: Growthit = + RoAit-1 + Leverageit-1 + T_payableit-1 or
N_creditit-1 + Sizeit-1 + Ageit-1 + Tangiblityit-1 +
Fin_healthit-1 + Crisis+ Ɛit
Once growth is measured in terms of A_growth (model 1) and a second time as E_growth (model 2). To avoid correlation problems, only one measure of trade credit (T_payable or N_credit) is used in one regression model.
4.
RESULTS
4.1
Empirical findings
4.1.1
Summary of descriptive statistics
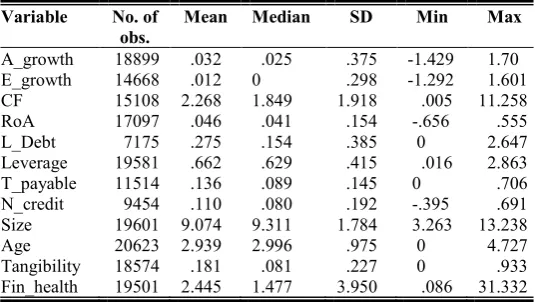
In table 3 the descriptive statistics for the full sample can be found. All variables are displayed after being winsorized at the upper and lower 1% to exclude extreme outliers (Rahaman, 2011).
For the full panel, the average yearly growth measured by A_growth and E_growth is 3.2% and 1.2% respectively. Therefore, growth in assets is slightly larger than the one of employees. The differences can be explained by the larger amount of manufacturing firms compared to service firms in the sample. Following Janssen (2009) for service firms the measure of employee growth is more reliable as these firms grow by hiring more employees. However, for manufacturing firms’ growth is rather measured in terms of total assets as machines are more important in this industry compared to hiring more employees when growing. Nevertheless, an increase in growth is
visible regardless of the measure employed. These findings are closely related to the ones of Rahaman (2011) whose average yearly growth for small firms is 3.2% in the UK and Ireland. Honjo and Harada (2006) however, report a decline in growth (-1.9%) for Japanese SMEs. However, these differences can be explained by the differences in countries.
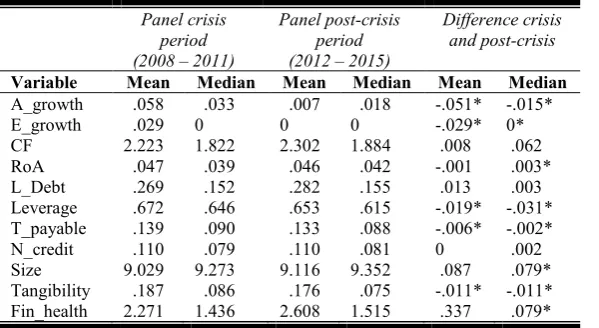
In appendix 8.1, table 4, presents the summary statistics for subpanel B of the crisis and the post-crisis period. During the crisis both measures of growth, E_growth and A_growth, are on average higher than for the post-crisis period. Therefore, SMEs grew on average 2.9% (E_growth) and 5.8% (A_growth) from 2008 – 2011. However, in the post crisis period these measures decline to 0% and 0.7% respectively. The decline in both growth measures of this variable are statistically significant. This is in line with evidence from Peric and Vitezic (2016) who conclude that Croatian SMEs grow during the times of crisis.
[image:7.595.53.544.91.286.2]The average amount of internal financing for the full panel is 4.6% of total assets. This low amount can be explained by the fact that SMEs usually have restricted retained earnings. External financing, however, is a more crucial source of financing for Dutch SMEs. Total debt accounts on average for 66.2% of total assets and long-term debt for 27.5% of total assets. This can be explained by the fact that the Dutch system is bank-based, therefore debt is an important financing source for the average SME (Treur & van de Hei, 2016). These results are similar to the ones of Honjo and Harada (2006) where internal financing also accounts for a smaller amount of financing than bank financing for Japanese SMEs. However, it is in strong contrast to Rahaman (2011) where the amount of external financing is considerably lower. Nevertheless, the difference can be explained by the fact that Japan is also a bank-financed country whereas the UK and Ireland are not (Thomson & Conyon, 2012). Trade credit seems to be also of importance for Dutch SMEs, the average amount of trades payable is 13.6% of total assets, net trade credit is slightly lower with 11% of total assets. When evaluating the subpanels, a slight decline (not more than 1% for any of the mentioned variables) is visible. RoA decreases from 4.7% to 4.6% which is an insignificant decline. This shows that the importance of internal financing did not change between the periods. However, a significant decline in Leverage from 67.2% to 65.3% is observed, indicating that SMEs are higher leveraged during the crisis than in the post-crisis period. Thus, SMEs are also more constrained in accessing bank financing from 2012 – 2015. The Table 2: Definition of variables
Variable Definition
Dependent variables
A_growth Natural logarithm of change of annual total assets
E_growth Natural logarithm of change of the number of employees annually
Independent variables
CF Annual cash flow (defined as operating income plus depreciation) divided by annual total
assets
RoA Annual ratio of net income divided by total assets
L_Debt Annual ratio of long-term debt divided by total assets
Leverage Annual ratio of total debt divided by total assets
T_payable Annual ratio of accounts payable divided by total assets
N_credit Annual difference between trade receivable and trade payable divided by annual total assets
Control variables
Size Annual natural logarithm of total assets
Age Natural logarithm of years of existence of the company
Tangibility Annual ratio of tangible assets divided by total assets
Fin_health Annual ratio of current assets divided by current liabilities
8 value for N_credit remains at 11% of total assets. Nevertheless,
T_payable decline in the post-crisis period (from 13.9% to 13.3% of total assets), indicating that SMEs use less trade credit in the post-crisis period compared to the crisis period.
Age is excluded in the descriptive statistics for the subpanels due to its definition. Size as well as Fin_health change significantly in a positive direction compared to the crisis period. Fin_health is expected to be more positive as less debt financing is used in the post-crisis period. Tangibility decreases significantly when comparing the two periods.
Therefore, based on the analysis of the descriptive statistics, one can conclude that SMEs are more financially constrained after the period of crisis compared to the time of crisis. Relating to this, a decline in growth is visible from 2012 – 2015 in contrast to the period of financial crisis.
4.1.2
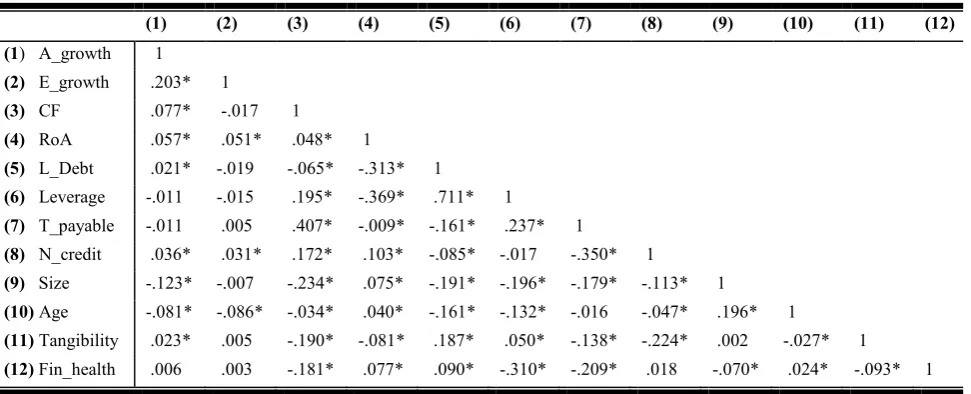
Pearson correlation matrix
The Pearson correlation matrix is displayed in table 5. Both dependent variables correlate significantly positively with each other (.203). A_growth (E_growth) and RoA .057 (.051) as well as N_credit .036 (.031) correlate significantly positively, thus, growing SMEs tend to have more internal financing and trade credit. Leverage has an insignificant correlation with A_growth and E_growth. Some of the independent variables are also correlating, as expected since they measure the same concepts. L_Debt and Leverage are the highest correlating variables (.711). This is expected as both are proxies for bank financing. T_payable and N_credit are significantly negatively correlated (-.350). This is also anticipated as N_credit is the difference among trades receivable and trade payable. Once trades payable increase, N_credit is presumed to decrease as the company does not grant the received credit directly to its customers, thus, these concepts are negatively related. RoA and L_Debt (-.313) as well as RoA and Leverage (-.369) are also significantly negatively correlated. This shows that once internal financing becomes available, external bank financing is decreased which is an indicator that the pecking order theory holds. Moreover, Leverage is positively correlated with T_payable (.237). This relationship can be explained by the fact that T_payable is a part of Leverage as it is part of total debts on the balance sheet. Therefore, these two concepts should be positively correlated. L_Debt has a negative relationship with T_payable (-.161) which further underlines the pecking order theory, once L_Debt becomes unavailable, trade credit is used to compensate for this.
2Current liabilities increase once Leverage increases and thus
the current ratio decreases.
Leverage and Fin_health are significantly negatively correlated which is also expected.2 Therefore, Leverage
and Fin_health as well as Leverage and T_payable are not introduced in the same models.
Age shows a significant negative correlation with A_growth (E_growth) -.081 (-.086). Therefore, older firms grow slower which underlines results from Honjo and Harada (2006), Huynh and Petrunia (2010) as well as Evans (1987) who also investigate that younger firms grow faster than older ones. The control variables are only slightly correlated, the highest correlation is .196 among size and age, indicating that older firms tend to be larger.
4.1.3
Regression results
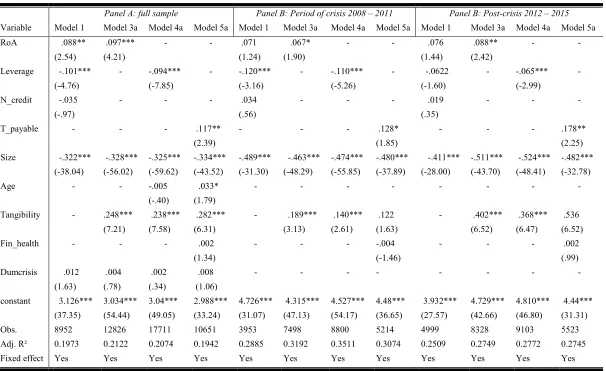
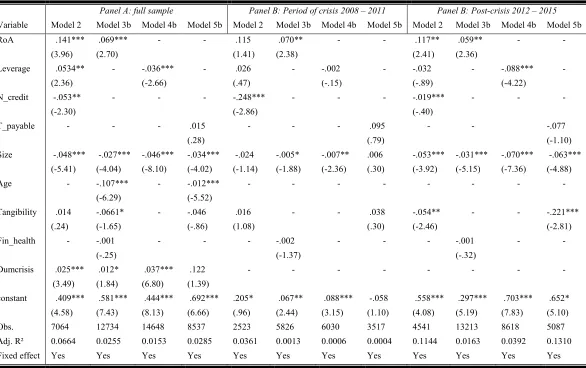
For the dependent variable two measures are used, A_growth (models 1, 3a, 4a, 5a) and E_growth (models 2, 3b, 4b, 5b). Both concepts are used for each model, however, in order of brevity only the coefficients for A_growth are shown in table 6 for the overall period (panel A) as well as for the period of crisis and post-crisis (panel B). The regressions for E_growth can be found in appendix 8.2 table 7. Overall only a few changes are visible when E_growth is employed as the dependent variable. The main purpose of the sub-models is to attain a higher observation rate and to check the robustness of the findings.
To make a comparison among the various models more feasible, the same variables are chosen. As CF and L_Debt are not normally distributed, a considerable amount of outliers remain after winsorizing and these variables do not correlate in similar ways with A_growth and E_growth both variables are excluded from the regressions. Additionally, the number of observations for L_Debt is significantly lower compared to the one of Leverage. Age is excluded in panel B as it leads to a bias due to its definition. To follow the literature fixed-effect (FE) models are employed for all models (Honjo & Harada, 2006; Rahaman, 2011).
For all regressions the assumptions were checked and none was violated. The Durbin-Watson test was conducted to check for autocorrelation. The values for all regressions are between 1 and 2, indicating that autocorrelation is not present since a value close to 2 is desired (Woolridge, 2012). To test for multicollinearity, the variance inflation factor (VIF) is used which is below 4. This is well below 10 for all models, therefore, no multicollinearity is expected (Woolridge, 2012). The residual normality is evaluated based on P-P plots. Although these seem to be not entirely normally distributed based on the central limit theorem it can be argued that residual normality is expected (Woolridge, 2012). Additionally, the residuals for each model were plotted in a histogram. These showed a normal distribution for the error terms of the residuals. Therefore, it can be argued that the residuals are normally distributed.
The R-squared values for the models of A_growth and E_growth differ considerably. Overall, the models with A_growth as the dependent variable seem to explain a lot more of the variance in firm growth with an R-squared value of at least .1942. However, the highest R-squared value for E_growth is .1144. Thus it has to be argued that important concepts explaining E_growth were left out of the model which have a large effect for the individual firm.
The financial crisis and firm growth
[image:8.595.55.323.92.243.2]For all models where Age is significant it has a negative effect on growth, this indicates that older firms grow slower than their younger counterparts which is in line with previous research as Table 3: Summary of descriptive statistics for full sample
Variable No. of
obs. Mean Median SD Min Max
A_growth 18899 .032 .025 .375 -1.429 1.70
E_growth 14668 .012 0 .298 -1.292 1.601
CF 15108 2.268 1.849 1.918 .005 11.258
RoA 17097 .046 .041 .154 -.656 .555
L_Debt 7175 .275 .154 .385 0 2.647
Leverage 19581 .662 .629 .415 .016 2.863 T_payable 11514 .136 .089 .145 0 .706 N_credit 9454 .110 .080 .192 -.395 .691
Size 19601 9.074 9.311 1.784 3.263 13.238
Age 20623 2.939 2.996 .975 0 4.727
9 for instance by Evans (1987) as well as Honjo and Harada (2006).
Size also has a negative significant coefficient in all models, suggesting that larger SMEs grow slower than smaller ones. This is consistent with research from Rahaman (2011), Huynh and Petrunia (2010) as well as Becchetti and Trovato (2002) who conclude that small firms grow faster than larger ones. Tangibility has a positive influence on A_growth but a negative one on E_growth. This can be explained by the fact that an increase in tangible assets also leads to a growth in total assets but not to an increase in the number of employees. The effect of Fin_health is insignificant for all models. Indicating that it does not affect firm growth.
The results show that SMEs were generally able to grow even during the period of crisis as can be seen by the significant positive value of Dumcrisis in all models for E_growth. For A_growth the coefficients are also positive but not significant. This is in line with results from Peric and Vitezic (2010) who conclude that Croatian SMEs were able to grow during the financial crisis.
Impact of internal financing on firm growth
For panel A, in model 1 as well as model 2, internal financing has a significant positive effect on firm growth (.088 and .141 respectively). This effect also holds for panel B, however, only the value for RoA in model 2 for the post-crisis is significant. The results for the sub-models 3a and 3b also support the significant positive effect of internal financing for panel A and panel B. However, it has to be noted that the coefficient for the post-crisis period slightly increases (from .067 to .088 for model 3a). Although a decrease is visible for model 3b (from .070 to .059) in the post-crisis period. Therefore, it can be concluded that internal financing is a crucial financing source for Dutch SMEs not only during the period of crisis but also the years afterwards. Furthermore, this verifies the first hypothesis and these effects are in line with results from Rahaman (2011) as well as Carpenter and Petersen (2002) who conclude that internal financing is an important financing source. Also following the pecking order theory it is the cheapest financing source available.
Impact of bank financing on firm growth
The greatest difference among the results of A_growth and E_growth is visible for Leverage in panel A, model 1 and 2 as well as panel B. For model 1 Leverage has a significant negative impact (-.101) and for model 2 a significant positive one (.0534).
This reverse relationship holds during the period of crisis but only the negative value for model 1 is significant. However, for the post-crisis period both values are negative but insignificant. Nevertheless, in model 4a and 4b, the results are similar for all tested periods. Leverage has a significant negative impact on firm growth for panel A as well as panel B. However, the coefficient is less negative in the post-crisis period (-.110 during the crisis and -.065 for the post crisis in model 4a) but this does not apply to model 4b. Thus one can conclude that Leverage has a negative effect on firm growth as bank financing is not readily available during the crisis and post-crisis period. Therefore, hypothesis 2a can be verified but hypothesis 2b has to be rejected as the relationship among bank financing and firm growth is still negative in the post-crisis period. The overall hypothesis 2 also has to be rejected based on the results. Furthermore, no tax benefits can be achieved as suggested by the static trade-off theory since bank financing is not readily available.
This negative relationship is in line with findings of Honjo and Harada (2006) as well as Becchetti and Trovato (2002). They also investigate a negative relationship among leverage and firm growth in Japan and Italy respectively. Moreover, Vermoesen, Deloof and Laveren (2013) conclude that being granted external financing is harder during the financial crisis. Therefore, it can be reasoned that internal financing is used for growth as debt financing may not be readily available during the period of crisis and the bank market is only slowly recovering from the crisis. Therefore, SMEs are still restricted in attaining bank financing during the post-crisis period.
Impact of trade credit on firm growth
[image:9.595.59.545.91.288.2]The evidence for N_credit is mixed, for panel A, a negative relationship is visible in model 1 (-.035) which is insignificant and model 2 (-.053) which is significant. For panel B in the crisis period a significant negative impact is investigated in model 2 (-.248) but an insignificant positive one in model 1 (.034). The same holds for the period of post-crisis. In order to get a deeper understanding of the trade credit usage as N_credit is only the difference among trades receivable and trades payable, T_payable is used in model 5a and 5b. For panel A, a positive significant relationship (.117) is seen for model 5a but an insignificant positive value for model 5b. This remains throughout the period of crisis. In the post-crisis period the value for E_growth becomes negative but is still insignificant. Table 5: Pearson correlation matrix
(1) (2) (3) (4) (5) (6) (7) (8) (9) (10) (11) (12)
(1) A_growth 1 (2) E_growth .203* 1
(3) CF .077* -.017 1
(4) RoA .057* .051* .048* 1
(5) L_Debt .021* -.019 -.065* -.313* 1
(6) Leverage -.011 -.015 .195* -.369* .711* 1
(7) T_payable -.011 .005 .407* -.009* -.161* .237* 1
(8) N_credit .036* .031* .172* .103* -.085* -.017 -.350* 1
(9) Size -.123* -.007 -.234* .075* -.191* -.196* -.179* -.113* 1
(10) Age -.081* -.086* -.034* .040* -.161* -.132* -.016 -.047* .196* 1
(11) Tangibility .023* .005 -.190* -.081* .187* .050* -.138* -.224* .002 -.027* 1
(12) Fin_health .006 .003 -.181* .077* .090* -.310* -.209* .018 -.070* .024* -.093* 1
10 Table 6: Regressions A_growth
Panel A: full sample Panel B: Period of crisis 2008 – 2011 Panel B: Post-crisis 2012 – 2015
Variable Model 1 Model 3a Model 4a Model 5a Model 1 Model 3a Model 4a Model 5a Model 1 Model 3a Model 4a Model 5a
RoA .088**
(2.54)
.097*** (4.21)
- - .071
(1.24)
.067* (1.90)
- - .076
(1.44)
.088** (2.42)
- -
Leverage -.101*** (-4.76)
- -.094***
(-7.85)
- -.120***
(-3.16)
- -.110***
(-5.26)
- -.0622 (-1.60)
- -.065***
(-2.99)
-
N_credit -.035 (-.97)
- - - .034
(.56)
- - - .019
(.35)
- - -
T_payable - - - .117**
(2.39)
- - - .128*
(1.85)
- - - .178**
(2.25)
Size -.322***
(-38.04)
-.328*** (-56.02)
-.325*** (-59.62)
-.334*** (-43.52)
-.489*** (-31.30)
-.463*** (-48.29)
-.474*** (-55.85)
-.480*** (-37.89)
-.411*** (-28.00)
-.511*** (-43.70)
-.524*** (-48.41)
-.482*** (-32.78)
Age - - -.005
(-.40)
.033* (1.79)
- - - -
Tangibility - .248***
(7.21)
.238*** (7.58)
.282*** (6.31)
- .189*** (3.13)
.140*** (2.61)
.122 (1.63)
- .402***
(6.52)
.368*** (6.47)
.536 (6.52)
Fin_health - - - .002
(1.34)
- - - -.004
(-1.46)
- - - .002
(.99) Dumcrisis .012
(1.63)
.004 (.78)
.002 (.34)
.008 (1.06)
- - - -
constant 3.126*** (37.35)
3.034*** (54.44)
3.04*** (49.05)
2.988*** (33.24)
4.726*** (31.07)
4.315*** (47.13)
4.527*** (54.17)
4.48*** (36.65)
3.932*** (27.57)
4.729*** (42.66)
4.810*** (46.80)
4.44*** (31.31)
Obs. 8952 12826 17711 10651 3953 7498 8800 5214 4999 8328 9103 5523
Adj. R² 0.1973 0.2122 0.2074 0.1942 0.2885 0.3192 0.3511 0.3074 0.2509 0.2749 0.2772 0.2745
Fixed effect Yes Yes Yes Yes Yes Yes Yes Yes Yes Yes Yes Yes
11 However, for model 5a an increase in T_payable is investigated
from (.128 for the crisis period to .178 in the post-crisis). This indicates that Dutch SMEs use trade credit during the period of crisis, however the results for the post-crisis period are mixed as an insignificant negative coefficient (-.077) for T_payable is observed for E_growth.
This is in line with evidence from McGuiness and Hogan (2016) who conclude that trade credit is an important financing source for Irish SMEs. As well as Casey and O’Toole (2014) who find evidence that SMEs use trade credit during the financial crisis. Furthermore, they also research Dutch SMEs and come to the conclusion that these companies use trade credit. Therefore, hypothesis 3a can be verified and hypothesis 3 has to be rejected as Dutch SMEs use trade credit in the overall period. The evidence for hypothesis 3b is weak but based on the insignificant coefficient for E_growth it can be argued that trade credit is also used in the post-crisis period. Thus hypothesis 3b is also rejected from the perspective of A_growth.
Access to finance and firm growth
Eventually, the results show that the pecking order theory holds. These findings are in line with evidence from Degryse, de Goeij and Kappert (2012) who also conclude that Dutch SMEs are financed according to the pecking order theory before the financial crisis. Internal financing which is also the cheapest source of financing is the most important one during and after the financial crisis. Additionally, given the fact of less availability of bank financing, SMEs use trade credit, although this is undesirable from the perspective of the pecking order theory. However, it is the only financing source available in order to achieve growth. Therefore, it can be argued that the pecking order theory holds for Dutch SMEs.
Furthermore, the evidence indicates that the amount of internal financing does not change significantly among the two periods. Thus it can be argued that sales stay approximately at the same rate and consumers do not spend more than during the crisis. Leverage still has a negative impact on growth. Therefore, one can conclude that being granted bank financing is still problematic for Dutch SMEs in the post-crisis period. Additionally, trade credit is also used as SMEs are in need of alternative financing sources. Based on these results the decline in growth can also be explained in the period of post-crisis compared to the crisis period. SMEs became more and more financially constrained during the recent financial crisis and as bank finance which is the most important financing source is not readily available in the post-crisis period growth cannot be financed. Thus it can be argued that access to finance is a major growth restraint for Dutch SMEs.
5.
SUMMARY AND CONCLUSION
SMEs are crucial in order to achieve economic recovery after a crisis given their great number (Muller et al., 2016). However, these companies are usually the first being impacted by a financial crisis as they are financially constrained. Therefore, the focus of this research is on the impact of access to finance on growth of Dutch SMEs during the recent financial crisis and the years afterwards.
For this research the definition of the European Commission (2017) is used to classify SMEs. After filtering the gained data from Reach the total sample includes 2,680 different firms from various industries. The sampling period is from 2008 – 2015. This long timeframe makes it possible to investigate the impact of access to finance on SME growth during the crisis and post-crisis period in terms of a panel study. Therefore, two overall models are used, one with A_growth as the dependent variable and another one with E_growth. Additionally, smaller
sub-models are created to research the impact of internal as well as external financing, namely bank finance and trade credit on firm growth. Furthermore, the full sample is divided into two subpanels, crisis and post-crisis to deepen the understanding of which financial resources are available for SMEs.
The univariate analysis shows that SMEs also grow during the time of crisis (5.8% and 2.9% for A_growth and E_growth respectively), however, their growth declines in the years after the crisis to almost 0%. This is also supported by the multivariate analysis where I control for Size, Age and Tangibility.
Furthermore, internal financing is the most important financing source during the crisis as well as during the post-crisis. Bank financing, however, has a negative effect on firm growth for both periods. Indicating that bank financing is not readily available during both periods and banks do not grant SMEs the amount of bank financing needed in order to finance their growth. Trade credit is also used by SMEs during the period of crisis, however, the evidence of the usage of trade credit in the post-crisis period is mixed. Nevertheless, it can be argued that it serves as an important financing source for Dutch SMEs as the coefficient for A_growth is positive and significant whereas the one for E_growth is insignificant.
Especially in the post-crisis period growth declined compared to the time of crisis. One explanation can be that bank financing as the most important financing source for Dutch SMEs is still not readily available in the post-crisis period. Eventually, it can be argued that access to finance is indeed a major growth restraint for Dutch SMEs. Additionally, the evidence shows that the pecking order theory holds for Dutch SMEs during the period of crisis as well as the post-crisis.
5.1
Limitations and future research
This research has several limitations. First, only a limited number of variables were chosen as Reach reports preliminary financial data. Variables like age of the owner and lender information, for instance (Rostamkalaei & Freel, 2016) could not be included. Additionally, unlisted SMEs in the Netherlands are not required to publish all financial information (Degryse, de Goeij & Kappert, 2012). Thus sometimes basic values for variables were missed leading to a small sample which may not be representative for Dutch SMEs. Relating to this, only companies with three years of available data were chosen therefore, the panel is unbalanced as companies may have reported values for one year but not for another. Furthermore, as firms had to satisfy the definition of the European Commission (2017) for any year, there is a possibility that firms not existing in 2008 are still included in the panel but do not show any data for the years before establishment. Thus, the panel effect could have been destroyed by this.
Therefore, future studies should be conducted with available data for each year. Additionally, a joint effect of internal and external financing could be researched as well as an investigation based on only one industry to check the robustness of the results. It is also possible to conduct a survey to deepen the understanding of whether trade credit can serve as an alternative to bank financing. Nevertheless, this was out of the scope of this study.