University of Warwick institutional repository
This paper is made available online in accordance with
publisher policies. Please scroll down to view the document
itself. Please refer to the repository record for this item and our
policy information available from the repository home page for
further information.
To see the final version of this paper please visit the publisher’s website.
Access to the published version may require a subscription.
Author(s): Sara Garfield , Nick Barber , Paul Walley , Alan Willson
and Lina Eliasson
Article Title: Quality of medication use in primary care - mapping the
problem, working to a solution: a systematic review of the literature
Year of publication: 2009
Open Access
Research article
Quality of medication use in primary care - mapping the problem,
working to a solution: a systematic review of the literature
Sara Garfield*
1, Nick Barber
1, Paul Walley
2, Alan Willson
3and Lina Eliasson
1Address: 1The School of Pharmacy, Mezzanine Floor, BMA House, Tavistock Square, UK, 2Warwick Business School, University of Warwick,
Coventry, UK and 3National Leadership and Innovation Agency for Healthcare, Bridgend Road, Llanharan, Glamorgan, UK
Email: Sara Garfield* - [email protected]; Nick Barber - [email protected]; Paul Walley - [email protected]; Alan Willson - [email protected]; Lina Eliasson - [email protected]
* Corresponding author
Abstract
Background: The UK, USA and the World Health Organization have identified improved patient safety in healthcare as a priority. Medication error has been identified as one of the most frequent forms of medical error and is associated with significant medical harm. Errors are the result of the systems that produce them. In industrial settings, a range of systematic techniques have been designed to reduce error and waste. The first stage of these processes is to map out the whole system and its reliability at each stage. However, to date, studies of medication error and solutions have concentrated on individual parts of the whole system. In this paper we wished to conduct a systematic review of the literature, in order to map out the medication system with its associated errors and failures in quality, to assess the strength of the evidence and to use approaches from quality management to identify ways in which the system could be made safer.
Methods: We mapped out the medicines management system in primary care in the UK. We conducted a systematic literature review in order to refine our map of the system and to establish the quality of the research and reliability of the system.
Results: The map demonstrated that the proportion of errors in the management system for medicines in primary care is very high. Several stages of the process had error rates of 50% or more: repeat prescribing reviews, interface prescribing and communication and patient adherence. When including the efficacy of the medicine in the system, the available evidence suggested that only between 4% and 21% of patients achieved the optimum benefit from their medication. Whilst there were some limitations in the evidence base, including the error rate measurement and the sampling strategies employed, there was sufficient information to indicate the ways in which the system could be improved, using management approaches. The first step to improving the overall quality would be routine monitoring of adherence, clinical effectiveness and hospital admissions.
Conclusion: By adopting the whole system approach from a management perspective we have found where failures in quality occur in medication use in primary care in the UK, and where weaknesses occur in the associated evidence base. Quality management approaches have allowed us to develop a coherent change and research agenda in order to tackle these, so far, fairly intractable problems.
Published: 21 September 2009
BMC Medicine 2009, 7:50 doi:10.1186/1741-7015-7-50
Received: 28 May 2009 Accepted: 21 September 2009
This article is available from: http://www.biomedcentral.com/1741-7015/7/50 © 2009 Garfield et al; licensee BioMed Central Ltd.
BMC Medicine 2009, 7:50 http://www.biomedcentral.com/1741-7015/7/50
Background
The UK, USA and the World Health Organization [1-4] have identified that priority should be given to improved patient safety in healthcare. Medication error has been shown to be one of the most frequent forms of medical error and it is associated with significant medical harm. For example, in the UK, 4.5% - 5% of admissions to sec-ondary care have resulted from preventable drug-related morbidity: preventable harm from medicines could cost more than £750 million pounds per year in England [5].
It is generally accepted that errors are the result of the sys-tems that produce them [6]. To date, studies measuring medication error have been limited as they have focused on specific errors, such as prescribing or administration errors, rather than on the whole system of the use of med-icines. Consequently, solutions to medication errors have concentrated on just one part of the whole system, such as prescribing or dispensing errors. We have little idea how these errors interact or whether problems at one part of the system would have been significantly reduced by intervention at another part of the system. An example would be medicines reconciliation interventions, which have been recommended as good practice in the UK [7] and the USA [8].
Individual interventions, such as reconciliation, seek to rectify errors which have occurred at just one point in the medicines system. For example, the aim of medicine rec-onciliation on admission to hospital is to ensure that medicines prescribed on admission correspond to those that the patient was taking before admission. It does this by: collecting information on medication history; check-ing or verifycheck-ing this list against the current prescription chart in the hospital; and documenting any changes, omissions and discrepancies [7]. Some interventions have reduced discrepancies in one part of the system, e.g. phar-macist-led medicine reconciliation on admission [7]. However, further discrepancies may re-occur at a later stage in the use of medicines. In addition, interventions such as reconciliation seek to correct errors which have already occurred rather than to improve the system in order to prevent such errors from occurring. This piece-meal approach to solutions may be one reason why a recent meta analysis found no evidence for the effective-ness of the majority of interventions aimed at reducing preventable drug-related morbidity or admissions to hos-pital [9]. There is little evidence that reductions in error rates lead to improved health outcomes.
In industrial settings there is a range of systematic tech-niques designed to improve the reliability of processes and the reduction of waste. Some of these, such as lean and six sigma, have been applied to healthcare [10-13] and include medication errors in secondary care [14,15].
The first stage of these processes is to map the whole sys-tem and establish the reliability of each stage. More than 80% of prescriptions for medication are written, and 71% of the medication budget is currently spent, in primary care [5]. We therefore chose to map out the use of medi-cation in primary care in order to establish its quality and reliability, using the UK as an exemplar. The UK is a uni-fied healthcare system with a large number of prescrip-tions. Our approach was to conduct a systematic review of the literature, to map out the system and its associated errors, to assess the strength of the evidence and to use approaches from quality management to identify ways in which the system could be made safer.
Methods
Systematic review
We carried out a systematic review of studies addressing error rates in the management of medicines in primary care searching the following databases: Medline, Embase; International Pharmaceutical Abstracts; Pharmline; Cinahl; Psycinfo; and the Kings Fund. Given the growth of electronic prescribing in primary care in the UK, and the rapid development of the medicines policy, we only searched papers from 1996 onwards. We used the key-words 'medication error', and 'primary healthcare', 'gen-eral practice', 'family practice', 'patient discharge', 'patient admission', 'medical records', 'continuity of patient care', 'hospital-physician-relations' or 'prescribing error.' We also searched the reference lists of relevant papers in order to identify any additional studies and contacted known experts.
We included studies medicines which were carried out in the UK and reported the frequency of errors in the man-agement of medicines in primary care, the frequency of prescribing errors in outpatient referrals or admissions to secondary care (as these potentially affect medication pre-scribed later in primary care). We included all definitions of error. We excluded: studies relying on spontaneous reports, as such studies grossly underestimate the error rates [16]; studies which did not report the method used for measuring error; studies of discrepancies on admission to hospital which only compared medication histories of different healthcare professionals in secondary care and did not access general practitioner (GP) medication records; and studies which only measured the error rate of one medication or therapeutic group.
sam-pling strategies employed and the validity and reliability of error rate measurement. The second reviewer inde-pendently extracted data from a random 50% sample in order to check the reliability of the data extraction (the agreement level was 94%).
Mapping the system
We mapped out the process of medicine usage in primary care and produced a high-level process map, in accord-ance with established processes [17] using an iterative process of refining the map in the light of findings from the literature review. We included episodes of secondary care which patients in primary care may have experienced (as outpatients or inpatients), treating them as a 'black box' rather than studying all types of errors that could occur in these settings. We superimposed the error rates, non-adherence rates and lack of efficacy rates, found in the literature at each stage of the process, onto the map. Where more than one study addressed the reliability of a particular stage, we reported the range of rates found. Meta analysis was not appropriate due to the heterogene-ity of methodology (discussed later). For the purpose of reviewing the system, non-adherence was treated as an error, or a system failure, as the intended outcome was treatment of the patient with a medicine. We recognize that non-adherence in some cases could be seen as an appropriate act taken by patients, however, although unquantified, this did not seem to occur very often. Unlike other forms of medication error, there is extensive literature on non-adherence which has been summarized in recent reviews [18,19]. We therefore used the adherence rates reported by the National Institute for Clinical Excel-lence (NICE) [18] and the Cochrane Collaboration [19], rather than conducting our own review.
Failures in drug effectiveness were included in the model, although these are not actual errors as they result in a loss of patient benefit from medication and, therefore, a loss in the quality of outcome. These failures were calculated using the NNT (number needed to treat); i.e. for a drug with NNT 2, two patients would be needed to be treated for every one who gains the required health outcome. This can be seen as a 50% failure rate in effectiveness.
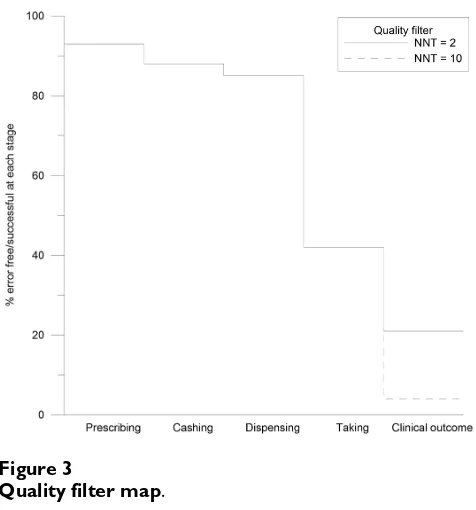
A quality filter map [20] was produced in order to demon-strate the cumulative loss of quality at each consecutive stage of the medicine management process. The filter is similar to a survival curve in which the abscissa is categor-ical rather than continuous data. It was generated using the findings from the literature for each stage of the proc-ess to estimate the number who could be expected to be seen for a single prescription with no secondary care inter-face. There were some limitations to this part of the map-ping process because units of measurement for error rates have not been consistent (an issue explored later).
How-ever, it provided an illustration of the nature and extent of quality problems in the system.
Results
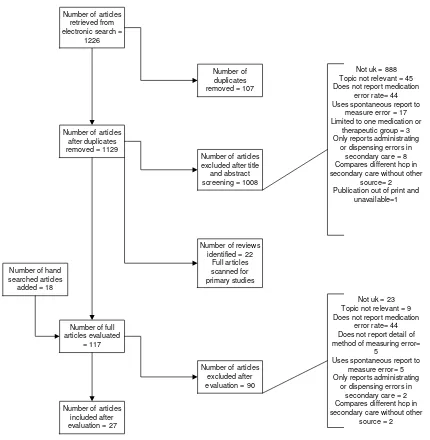
Twenty-seven relevant papers were found which met the inclusion criteria (see Figure 1). The methodological char-acteristics of the included studies are shown in Additional file 1. The whole system, including the frequency of errors, is illustrated in Figure 2[21-47]. The quality filter (Figure 3) includes two exemplar NNTs from the range usually funded in primary care, listing the most effective medi-cines used (NNT of 2) to a value that is usually accepted (10). We realize that NNTs may (depending on the design of the contributing trials) reflect elements of non-adher-ence. However, as trials are usually designed to improve efficacy and minimize non-adherence, we did not expect this to significantly affect the system for the purposes of this paper.
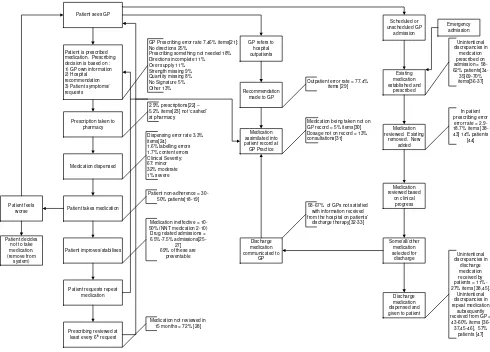
Figure 2 demonstrates that: quality issues exist at every stage of the process and that several stages of the process had error rates of 50% or more which included repeat pre-scribing reviews, interface prepre-scribing and communica-tion and patient adherence. Furthermore, it can be seen from Figure 3 that the available evidence suggests that only between 4% and 21% of patients achieve the opti-mum benefit from their medicines.
Discussion
This is the first systematic review of the cumulative medi-cation errors of a country's healthcare system, linked to a discussion of the whole system. This approach allows the development of a system-wide approach to the improve-ment of quality in the use of medication. However, we rec-ognize that there are limits to our methodology. We merged different types of studies and some areas of the map are more greatly populated than others. Weaknesses of the map are a reflection of the primary data. In the next section we reflect on the quality of the data which we found, as it affects our understanding of the whole system and also sets a research agenda of its own. We then discuss approaches to creating improvement.
Limitations of research reviewed
The limitations fall into four groups: (1) a dearth of stud-ies, (2) the method of identifying and measuring the error, (3) the use of different units of measurement and (4) sampling limitations.
BMC Medicine 2009, 7:50 http://www.biomedcentral.com/1741-7015/7/50
records are to the whole system and that further research in this area is urgently needed. In addition, research addressing the rates of the reviews of repeat prescriptions was conducted over 10 years ago and should now be updated [28].
The methodology used to measure error has been prob-lematic. Definitions of error have differed between studies which makes comparisons difficult. Some studies may not have been able to identify all the errors. For example, Shah et al. [21] conducted a study in which prescriptions were reviewed in pharmacies in order to determine the prescribing error rate: this is unlikely to detect all of the
errors [41]. Difficulties have also arisen when attempts have been made to determine the rates of errors in medi-cation history taking when patients are admitted to hospi-tal because there is no a gold standard with which to compare the medication history as general practice records have also been found to be inaccurate [30]. Dis-crepancies rather than error rates have therefore been reported. Studies have classified discrepancies as inten-tional or uninteninten-tional when patients are issued repeat prescriptions after being discharged from hospital. How-ever, in three of the studies GPs were not interviewed in order to check their intentions and therefore this classifi-cation may have been inaccurate [36,45,46].
[image:5.612.93.523.86.526.2]Flow chart of papers identified, screened and evaluated
Figure 1
Flow chart of papers identified, screened and evaluated.
Number of articles retrieved from electronic search =
1226
Number of articles after duplicates removed = 1129
Number of full articles evaluated
= 117
Number of duplicates removed = 107
Number of articles excluded after title
and abstract screening = 1008
Not uk = 888 Topic not relevant = 45 Does not report medication
error rate= 44 Uses spontaneous report to
measure error = 17 Limited to one medication or
therapeutic group = 3 Only reports administrating
or dispensing errors in secondary care = 8 Compares different hcp in secondary care without other
source= 2 Publication out of print and
unavailable=1
Number of articles excluded after evaluation = 90
Not uk = 23 Topic not relevant = 9 Does not report medication
error rate= 44 Does not report detail of method of measuring error=
5
Uses spontaneous report to measure error= 5 Only reports administrating
or dispensing errors in secondary care = 2 Compares different hcp in secondary care without other
source = 2 Number of articles
included after evaluation = 27
Number of reviews identified = 22
Full articles scanned for primary studies Number of hand
It is also difficult to compare error rates across the medi-cine management system as error rates have been meas-ured using different units. Prescribing and dispensing errors have been measured using the number of items as the denominator in the majority of cases [21,24]. How-ever, adherence has been measured per patient [18,19] and satisfaction with discharge communication has been measured per GP [32,33]. In future it may be best if error rates were expressed using more than one criterion, such as by act and by patient.
The limited sampling strategies employed in studies have led to some of the data collected being unrepresentative. Most studies conducted in the hospital setting have been carried out at a single site, sampled for convenience [25,27,29,37,39,40] and, in some cases, have been spe-cific to a single patient group [29,37]. In addition, some studies have been carried out at a single GP surgery [21,22] or on a convenient sample of independent phar-macies [24]. In some cases, there was no information
given about the sampling strategy [21,26,38] or the patients within a practice have not been randomly sam-pled [22]. Lack of contextual information has meant that one cannot determine how representative the results have been. In addition, in other areas, such as adherence and preventable drug-related admissions, random sampling has been employed or there have been consistent results between studies leading to a cumulative validity.
Creating improvement
While we acknowledge the limitations of the literature, there is still sufficient information to indicate the ways in which the system could be made safer. There are several management techniques which have been designed to improve reliability and quality and to reduce waste - for example 'lean' aims to reduce waste by removing non-value added steps from a process and 'six sigma' aims to reduce the variation in order to produce a uniform process output. Given the opportunity for improvement based upon quantifiable error rates over periods of time, the six
[image:6.612.58.548.89.441.2]A map of the medicine related processes that affect the quality of medicine use in primary care
Figure 2
A map of the medicine related processes that affect the quality of medicine use in primary care.
Patient sees GP
Patient is prescribed medication. Prescribing decision is based on : 1) GP own information 2) Hospital recommendation 3) Patient symptoms/ requests
Prescription taken to pharmacy
Medication dispensed
Patient takes medication
Patient improves/stabilises
Patient requests repeat medication
Prescribing reviewed at least every 6th
request Patient feels
worse
Patient decides not to take medication. (remove from system)
GP Prescribing error rate 7.46% items[21]: No directions 25%
Prescribing something not needed 18% Directions incomplete 11% Over supply 11% Strength missing 9% Quantity missing 8% No Signature 5% Other 13%
2.9% prescriptions[22] – 5.2% items[23] not ‘cashed’ at pharmacy
Dispensing error rate 3.3% items[24}
1.6% labelling errors 1.7% content errors Clinical Severity: 67: minor 32% moderate 1% severe
Patient non-adherence = 30-50% patients[18-19]
Medication ineffective = 10-50% (NNT medication 2-10) Drug related admissions = 6.5%-7.5%
admissions[25-27] 69% of these are
preventable
Medication not reviewed in 15 months = 72% [28]
GP refers to hospital outpatients Scheduled or unscheduled GP admission Recommendation made to GP
Medication assimilated into patient record at GP Practice
Medication being taken not on GP record = 5% items[30] Dosage not on record = 13% consultations[31] Emergency admission Existing medication established and prescribed Medication reviewed. Existing
removed. New added Medication reviewed based on clinical progress Some/all/other medication selected for discharge Discharge medication dispensed and given to patient
Unintentional discrepancies in
medication prescribed on admission = 58-62% patients[34-35]69-70% items[36-37]
In patient prescribing error error rate = 2.9-18.7% items [38-43] 14% patients
[44]
Discharge medication communicated to
GP
58-67% of GPs not satisfied with information received from the hospital on patients’
discharge therapy[32-33] Unintentional discrepancies in discharge medication received by patients = 11%-27% items [38,45].
Unintentional discrepancies in repeat medication
subsequently received from GP =
43-60% items [36-37,45-46], 57% patients [47] Outpatient error rate = 77.4%
BMC Medicine 2009, 7:50 http://www.biomedcentral.com/1741-7015/7/50
sigma approach to structured improvement is especially relevant to the improvement of quality of medication use. This approach uses a systematic methodology to define, measure, analyse, improve and control the situation. Such techniques have been successfully applied to healthcare [10-13], including the reduction of medication error in secondary care [14,15]. However, there is little evidence of the successful application of these management strategies to the primary healthcare setting generally, or to the improvement in quality of medication use in primary care. Natarjan [50] has identified a number of barriers for the application of improvement tools to primary care set-tings. They include: lack of awareness that problems exist; poor understanding of systems thinking; a traditional medical culture of individual responsibility; legal issues encouraging the concealment of error; poor information technology provision; poor data; and resource issues. In addition, unlike the situation seen in secondary care, patients have complete freedom of action and the health-care may professionals come from several different organ-izations. Any solution must be able to address these challenges.
A systematic approach, based on the existing evidence, is required in order to identify how we should apply man-agement strategies to the improvement of the quality of medication use in primary care. The approach requires a method of identifying priorities, a systematic measure-ment of error and the systematic design and testing of solutions. As problems of maintaining quality occur at every stage of the medicine management system in pri-mary care, there is a need to prioritize the processes which
need to be improved. We need to examine the impact of errors on the system as a whole and use that knowledge to develop an approach which will maximize its value to patients.
One method of choosing which processes need to be improved is to identify those that have both high error rates and which cause high levels of harm [51]. Figure 1 shows the processes with the highest error rates. However, as data regarding harm is not available for all of the proc-esses, this method is inappropriate. A more promising method would be to prioritize processes at the patient end of the system and gradually work backwards, thereby maximizing value to the patient [17]. The aim of the sys-tem is to ensure that patients are taking medication suc-cessfully and that the medication is effective and not harmful. Improving these processes would be expected to lead to improvements in patient care. Medication adher-ence, effectiveness and lack of harm are therefore the stages on which we first should focus. These are the proc-esses which are most important to the patient and in which there is high loss of quality. In order to improve these processes, we also a need to consider feedback loops within the system, another area in which there has been insufficient research. For example, it may not be possible to improve the NNT of a medication but effective feed-back systems, such as medication reviews and monitoring, may allow prescribers and others to change ineffective or harmful medication and improve the quality of outcome.
Having identified the areas which should be given prior-ity, the next stage is to measure and standardize processes at a local level. In order to assess the effects of the inter-ventions, we need to establish standard methods for measuring system errors so that error rates can be moni-tored and compared. Statistical process monitoring is a management technique which can assist this process. It uses control charts to monitor processes [52], allowing the measurement of changes in, and the predictability of, the mean error rate. It is necessary to know the predicta-bility of error as management strategies cannot be applied to the reduction of error if the rates are unpredictable or chaotic; it is essential that error rates first be stabilized and that the adherence rates and clinical effects have been monitored as proxies for the desired clinical outcome. Adherence would probably need to be measured by tech-niques such as self report and dispensing records. The measurement of clinical effectiveness would depend on the drug being used, the condition being treated and number of admissions to hospital.
Once data has been collected, the analyses will indicate which solutions would be appropriate. If error rates are chaotic, the first stage would be to reduce variation. Con-trol charts can identify whether the variations have a com-mon or a specific cause. In order to reduce comcom-mon
[image:7.612.55.293.86.341.2]Quality filter map
Figure 3
causes of the variations we must improve the process, but to reduce specific causes we need to identify and act on factors which are extrinsic to the process [52]. Once the process is stable, root cause analysis can be used as a tool to identify the causes of error. Once this knowledge is gained, appropriate solutions for reducing error rates can be identified and evaluated. It should be possible to extrapolate the information from representative and reproducible data collected at local levels and apply it at a national level.
Conclusion
By adopting the whole system approach from a manage-ment perspective we have discovered where the failures in quality occur in medication use in primary care in the UK, and where weaknesses lie in the associated evidence base. Quality management approaches allow for the prioritiza-tion of research and the coherent change and research agenda needed to tackle these, so far, fairly intractable problems.
Abbreviations
GP: General practitioner; NNT: number needed to treat.
Competing interests
The authors declare that they have no competing interests.
Authors' contributions
SG conducted the literature search and was involved in writing the paper. NB was involved in the design and writ-ing of the paper. PW evaluated alternative approaches to the analysis and was involved in the development of the maps. AW secured funding, established the research team and was involved in the conceptualization, design and editing of the paper. LE acted as a second reviewer in order to establish the reliability of the review process. All authors have seen and approved the final version.
Additional material
Acknowledgements
Funding was provided by the National Leadership and Innovation for Healthcare, NHS Wales.
References
1. Department of Health: An organisation with a memory. Report of an expert group on learning from adverse events in the NHS London: The Stationery Office; 2000.
2. Department of Health: Building a safer NHS for patients: improving med-ication safety. A report by the Chief Pharmaceutical Officer London: The Stationery Office; 2004.
3. Institute of Medicine: To err is human: Building a safer health system. Report of the Committee on Quality of Healthcare in America Washington: National Academy Press; 2000.
4. World Health Organization: Quality of care: patient safety. Report by the Secretariat Geneva: World Health Organization; 2002.
5. Department of Health: Pharmacy in England. Building on strengths-deliv-ering the future London: The Stationary Office; 2008.
6. Department of Health: Design for safety. A system-wide design-led approach to tackling patient safety in the NHS London: Department of Health; 2003.
7. National Institute of Clinical Excellence: Technical patient safety solu-tions for medicines reconciliation on admission of adults to hospital: Guid-ance London: NICE; 2007.
8. Institute of Healthcare Improvement: Getting started kit: Prevent adverse drug events (medication reconciliation). How-to guide Massachu-setts: Institute of Healthcare Improvement; 2007.
9. Royal S, Smeaton L, Avery AJ, Hurwitz B, Sheikh A: Interventions in primary care to reduce medication related adverse events and hospital admissions: systematic review and meta-analy-sis. Qual Safe Health Care 2006, 15:23-31.
10. Spear S: Fixing healthcare from the inside. Harvard Business Rev
2005, 83:78-91.
11. Berwick DM, Godfrey AB, Roessner J: Ten key lessons for quality improvement during healthcare. In New strategies for Quality improvement San Francisco: Jossey-bass; 1990:157.
12. Proudlove N, Moxham C, Boaden R: Lessons for Lean in Health-care from Using Six Sigma in the NHS . Public Money Manage-ment 2008, 28(1):27-34.
13. Taner MT, Sezen B, Antony J: An overview of six sigma applica-tions in healthcare industry. Int J Health Care Qual Assur 2007,
20:329-340.
14. Esimai : Lean Six Sigma reduces medication errors. Quality Progress 2005, 38:51-57.
15. Al-Shaqha WMS, Zairi M: Reengineering pharmaceutical care: towards a patient-focused care approach. Int J Health Care Qual Assur 2000, 13:208-217.
16. Franklin BD, O'Grady K, Paschalides C, Uley M, Gallavin S, Jacklin A, Barber N: Providing feedback to hospital doctors about pre-scribing errors: a pilot study. Pharm World Sci 2007, 29:213-220. 17. Rother M, Shook J: Learning to see: value-stream mapping to create value and eliminate muda Massachusetts: The Lean Enterprise Institution; 2003.
18. National Collaborating Centre for Primary Care: Medicines adherence Involving patients in decisions about prescribed medicines and supporting adherence London National Institute for Health and Clinical Excel-lence; 2009.
19. Haynes RB, Ackloo E, Sahota N, McDonald HP, Yao X: Interven-tions for enhancing medication adherence. Cochrane Database of Systematic Reviews 2008:CD000011.
20. Bicheno J: The New Lean Toolbox Buckingham: PICSIE Books; 2004. 21. Shah SNH, Aslam M, Avery AJ: A survey of prescription errors in
general practice. Pharmaceutical J 2001, 267:860-862.
22. Jones I, Britten N: Why do some patients not cash their pre-scriptions? Br J Gen Pract 1998, 48:903-905.
23. Beardon PHG, McGilchrist MM, McKendrick AD, McDevitt DG, Mac-Donald TM: Primary non-compliance with prescribed medica-tion in primary care. Br Med J 1993, 307:846-848.
24. Dean Franklin B, O'Grady K: Dispensing errors in community pharmacy: frequency, clinical significance and potential impact of authentication at the point of dispensing. Int J Phar-macy Practice 2007, 15:273-281.
25. Howard RL, Avery AJ, Howard PD, Partridge M: Investigation into the reasons for preventable drug related admissions to a medical admissions unit: observational study. Qual Safe Health Care 2003, 12:280-285.
26. Pirohamed M, James S, Meakin S, Green C, Scott AK, Walley TJ, Far-rar K, Park BK, Breckenridge AM: Adverse drug reactions as cause of admission to hospital: prospective analysis of 18 820 patients. Br Med J 2004, 329:15-19.
27. Green CF, Mottram DR, Rowe PH, Pirmohamed M: Adverse drug reactions as a cause of admission to an acute medical unit: a pilot study. J Clin Pharm Ther25:355-361.
Additional file 1
Table S1. Studies included. Click here for filePublish with BioMed Central and every scientist can read your work free of charge "BioMed Central will be the most significant development for disseminating the results of biomedical researc h in our lifetime."
Sir Paul Nurse, Cancer Research UK
Your research papers will be:
available free of charge to the entire biomedical community
peer reviewed and published immediately upon acceptance
cited in PubMed and archived on PubMed Central
yours — you keep the copyright
Submit your manuscript here:
http://www.biomedcentral.com/info/publishing_adv.asp
BioMedcentral
BMC Medicine 2009, 7:50 http://www.biomedcentral.com/1741-7015/7/50
28. Zermansky AG: Who controls repeats. Br J Gen Pract 1996,
46:643-647.
29. Jani YH, Ghaleb MA, Marks SD, Cope J, Barber N, Wong ICK: Elec-tronic prescribing reduced prescribing errors in a pediatric renal outpatient clinic. J Pediat 2008, 152:214-218.
30. Collins DJ, Nickless GD, Green CF: Medication histories; does anyone know what medicines a patient should be taking? Int J Pharmacy Practice 2004, 12:173-178.
31. Hippisley-Cox JH, Pringle M, Cater R, Wynn A, Hammersley V, Cou-pland C, Hapgood R, Horsfield P, Teasdale S, Johnson C: The elec-tronic patient record in primary care- regression or progression? A cross sectional study. Br Med J 2003,
236:1439-1443.
32. Manday A, Kelly B, Forrester JWE, Timoney A, McGovern E: Do gen-eral practitioners and community pharmacists want infor-mation on the reasons for drug therapy changes implemented by secondary care? Br J Gen Pract 1997,
47:563-566.
33. Brookes K, Scott MG, McConnell JB: The benefits of a hospital based community services liason pharmacy. Pharm World Sci
2000, 22:33-38.
34. Ahmed S, Harding J: Investigating the procedures, drawbacks and implications of seamless primary-secondary care. Quality in Primary Care 2005, 12:51-55.
35. Rees S, Thomas P, Shetty A, Makinde K: Drug history errors in the acute medical assessment unit quantified by the use of the NPSA classification. Pharmaceutical J 2007, 279:469-471. 36. Pickrell L, Duggan C, Dhillon S: From hospital admission to
dis-charge: an exploratory study to evaluate seamless care. Phar-maceutical J 2001, 267:650-653.
37. Morcos S, Francis S-A, Duggan C: Where are the weakest links? A descriptive study of discrepancies in prescribing between primary and secondary sectors of mental health service pro-vision. Psychiatric Bull 2002, 26:371-374.
38. Sagripanti M, Dean B, Barber N: An evaluation of the process-related medication risks for elective surgery patients from pre-operative assessment to discharge. Int J Pharmacy Practice
2002, 10:161-170.
39. Franklin BD, O'Grady K, Donyai P, Jacklin A, Barber N: The impact of a closed-loop prescribing and administration system on prescribing errors, administration errors and staff time. Qual Safe Health Care 2007, 16:279-284.
40. Donyai P, O'Grady K, Jacklin A, Barber N, Franklin BD: The effects of electronic prescribing on the quality of prescribing. Br J Clin Pharmacol 2007, 65:230-237.
41. Barber N, Franklin BD, Cornford T, Klecun E, Savage I: Safer, faster, better? Evaluating electronic prescribing. Report to the Patient Safety Research Programme London: The Department of Health; 2006. 42. Tully MP, Parker D, Buchan I, McElduff P, Heathfield H, Rogers J,
Healthfield s, Latif S, Smith G, Eden M, Malik H, Cantrill J: Patient Safety Research Programme Medication Errors 2: Pilot StudyVolume 16. London: The Department of Health; 2007:40-44.
43. Gethins B: Wise up to medication errors. Pharmacy in Practice
1996, 6:323-328.
44. Olsen S, Neale G, Schwab K, Psalia B, Patel T, Chapman EJ, Vincent C: Hospital staff should use more than one method to detect adverse events and potential adverse events: incident reporting, pharmacist surveillance and local real-time review may all have a place. Qual Safe Health Care 2007,
16:40-44.
45. Duggan C, Bates I, Hough J: Discrepancies in prescribing. Where do they occur? Pharmaceutical J 1996, 256:65-67.
46. Duggan C, Feldman R, Hough J, Bates I: Reducing adverse pre-scribing discrepancies following hospital discharge. Int J Phar-macy Practice 1998, 6:77-82.
47. Smith L, McGowan L, Moss-Barclay C, Wheater J, Knass D, Chrystyn H: An investigation of hospital generated pharmaceutical care when patients are discharged from hospital. Br J Clin Phar-macol 1997, 44:163-165.
48. Hassey A, Gerrett D, Wilson A: A survey of validity and utility of electronic patient records in a general practice. Br Med J 2001,
322:1401-1405.
49. Jordon K, Porcheret M, Croft P: Quality of morbidity coding in general practice computerized medical records: a system-atic review. Fam Pract 2004, 21:396-412.
50. Natarajan R: Transferring best practices to healthcare: oppor-tunities and challenges. TQM Magazine 2006, 18:572-582. 51. Slack N, Chambers S, Johnston R, Betts A: Operations and Process
Man-agement New Jersey: Prentice Hall; 2006.
52. Benneyan JC, Lloyd RC, Plsek PE: Statistical process control as a tool for research and healthcare improvement. Qual Safe Health Care 2003, 12:458-464.
Pre-publication history
The pre-publication history for this paper can be accessed here: